Open Access : : ISSN 1847-9286
www.jESE-online.org
Original scientific paper
Novel Mannich bases bearing pyrazolone moiety
Synthesis, characterization and electrochemical studies
KRISHNA NAIK
, ALURU RAGHAVENDRA GURU PRASAD*, YADATI NARASIMHA
SPOORTHY and LAKSHMANA RAO KRISHNA RAO RAVINDRANATH
Sri Krishnadevaraya University, Anantapur, A.P., India
*ICFAI Foundation for Higher Education, Hyderabad, A.P., India
Corresponding Author: E-mail: [email protected] Received: November 23, 2012; Published: April 19, 2013
Abstract
The present investigation describes a series of new {4-[3-Methyl-5-oxo-4-(4|-substituted phenyl hydrazono)-4,5-dihydro-pyrazol-1-yl]-phenoxy}-acetic acid (2-oxo-1-piperidine-1- -ylmethyl-1,2-dihydro–indol-3-ylidene)-hydrazides synthesized by the Mannich reaction of {4-[3-Methyl-5-oxo-4-(4|-substituted phenyl hydrazono)-4,5-dihydro-pyrazol-1-yl]- -phenoxy}-acetic acid (2-oxo-1,2-dihydro-indol-3-ylidene)-hydrazide with aqueous formaldehyde and a solution of piperidine in dimethylformamide. These novel Mannich bases were characterized by elemental analysis, IR, 1H NMR and mass spectral data. Electrochemical behavior of these compounds were studied by two techniques namely polarography and cyclic voltammetry. The results from both the techniques were compared and the reduction mechanism in acidic as well as basic medium was proposed.
Keywords
Mannich bases, Synthesis, Polarography, Cyclic voltammetry, Comparison, Reduction mechanism.
Introduction
attention of pharmaceutical chemists. In view of the above mentioned facts, we propose to synthesize certain novel Mannich bases containing a pyrazolone moiety.
The pharmacological properties of many compounds have been quantitatively related to their reduction process [15-18]. Structure-activity relationship studies [19,20] demonstrated that the reduction potential correlates with the antimicrobial activity of certain compounds.
Extensive work on electrochemical behavior of medicinally important compounds has been already reported from these laboratories [21,22]. In this article, the cyclic voltammetric behavior of Mannich bases on a hanging mercury drop electrode and modified carbon paste electrode is reported. A comparison of polarographic behavior of the compounds with their cyclic voltammetric behavior is also presented.
Experimental
All the chemicals and reagents used in the studies were analytical reagent grade obtained from Merck. Britton-Robinson buffer solutions were prepared from the appropriate volumes of acetic acid (0.04 M), phosphoric acid (0.04 M), boric acid (0.04 M) and sodium hydroxide (0.2M). pH meter, Model LI – 10 manufactured by ELICO Private Limited, Hyderabad, India was used for pH measurements.
A CL-25 Pen Recording Polarograph manufactured by ELICO Private Limited, Hyderabad, India was used to record current-voltage curves. The capillary having the characteristics 1.80 mg2/3 s-1/2 at h = 80 cm was employed in the studies.
The cyclic voltammeter used consists of an X-Y recorder (Model RE 0074), a PAR 175 Potentiostat and an PAR 175 Universal Programmer. A single compartment cell Model 303 SMDE with silver wire as reference electrode and platinum wire as counter electrode was used for cyclic voltammetric studies. A stationary mercury drop electrode (SMDE 303) with a drop area 0.0096 cm2 was used as the working electrode.
General polarographic procedures (Scheme 1)
8.0 mL of the buffer solution of desired pH, 2.0 L of Ma i h ase solutio . × -2 M) in dimethylformamide, 6.0 mL of dimethylformamide (DMF) and 4.0 mL of distilled water were mixed thoroughly in the polarographic cell. The polarograms were recorded after the expulsion of dissolved oxygen with nitrogen gas. Geltain was used as the maximum suppressor in all the investigations except in the experiments where the effect of surfactants was studied.
Synthesis of Mannich bases
{4-[3-Methyl-5-oxo-4-(4|-substituted phenyl hydrazono)-4,5-dihydro-pyrazol-1-yl]-phenoxy}-acetic acid hydrazide I were synthesizedand characterized by the procedures reported in the literature [23].
Synthesis of {4-[3-Methyl-5-oxo-4--(4|-substituted phenyl hydrazono)-4,5-dihydro-pyrazol-1-yl]- -phenoxy}-acetic acid (2-oxo-1,2-dihydro-indol-3-ylidene)- hydrazide IV.
The required isatins were prepared by the procedure described by Marvel and Heirs [24].
Synthesis of isonitrosoacetanilide (II)
wire gauge for about 45 minutes. The reaction mixture was cooled, the solid separated was filtered and dried.
a. Synthesis of Isatin 46 (R = H). (III)
A miture of 8 mL of concentrated H2SO4, 18 g of dry isonitrosoacetanilide taken in a round
bottem flask was heated to 80 oC for about 10 minutes. The reaction mixture was cooled to room temperature and poured onto crushed ice. The precipitated isatin was filtered, washed several times with cold water and dried.
c. Synthesis of {4-[3-Methyl-5-oxo-4-(4|-substituted phenyl hydrazono)-4,5-dihydro-pyra- zol-1-yl]-phenoxy}-acetic acid(2-oxo-1,2-dihydro-indol-3-ylidene)-hydrazide IV.
A mixture of I (R = H) and III in 1 : 1 molar ratio when heated in DMF-water bath for 45 minutes, resulted in a compound with melting point 214 oC. Based on spectral data, the compound was assigned structure as {4-[3-Methyl-5-oxo-4-(phenyl - hydrazono)-4,5-dihydro-pyrazol-1-yl]-phe-noxy}-acetic acid (2-oxo-1,2-dihydro – indol-3-ylidene)- hydrazide IVa (R = H).
Other members of the series were prepared by similar procedures and their characterization data are given in the Table 1.
Table 1. Characterization of {4-[3-Methyl-5-oxo-4-(4|-substituted phenyl hydrazono)-4,5-dihydro-pyra- zol-1-yl]-phenoxy}-acetic acid (2-oxo-1,2-dihydro-indol-3-ylidene)-hydrazide.
Com-
pound R M.P.
oC Yield, % Molecular formula
Mass fraction found, % (Calc., %)
C H N O Cl Br
IVa H 214 70 C26H25N7O4
62.52 (62.48) 5.01 (4.89) 19.63 (19.50) 12.82 (12.70) IVb CH3 241 70 C27H27N7O4
63.15 (63.02) 5.26 (5.15) 19.10 (18.95) 12.47 (12.32) IVc OCH3 234 70 C27H27N7O4
61.24 (61.12) 5.10 (4.95) 18.52 (18.38) 15.12 (15.00) IVd OC2H5 224 75 C28H29N7O5
61.87 (61.75) 5.34 (5.25) 18.04 (17.88) 14.73 (14.62) IVe Cl 225 75 C26H24ClN7O4
58.48 (58.35) 4.49 (4.32) 18.38 (18.22) 11.99 (11.75) 6.65 (6.52) IVf Br 243 80 C26H24BrN7O4
53.98 (53.82) 4.15 (3.98) 16.95 (16.80) 11.07 (10.95) 13.82 (13.65)
IR Spectral details
The IR (KBr) spectrum (Figure 1) of {4-[3-Methyl-5-oxo-4-(phenyl hydrazono)-4,5-dihydro-pyrazol-1-yl]-phenoxy}-acetic acid (2-oxo-1,2-dihydro–indol-3-ylidene)- hydrazide (hydrazone) IVa showed characteristic strong absorption bands at 3205 (NH), 3170 (Indole NH), 1602 (C = N), 1656 (pyrazoline C = O), 1700 (Indole C = O) and 1618 (CONH). The spectral data and the respective assignments of IV are given in the Table 2.
1
H NMR Spectral details
The 1H NMR (200 MHz) spectrum (Figure 2) of {4-[3-Methyl-5-oxo-4-(phenyl hydrazono)-4,5- -dihydro-pyrazol-1-yl]-phenoxy}-acetic acid (2-oxo-1,2-dihydro–indol-3-ylidene)-hydrazide (hydra-zone) IVa in DMSO – d6 showed the sig als at δ . s, H, CH3, δ . s, H, A – NH , δ .
Table 2: IR (KBr) Spectral data of{4-[3-Methyl-5-oxo-4-(4|-substituted phenyl hydrazono)-4,5-dihydro-pyra- zol-1-yl]-phenoxy}-acetic acid (2-oxo-1,2-dihydro-indol-3-ylidene)-hydrazide.
Compound νmax / cm
-1
>NH Indole NH >C=N- Pyrazoloine C=O Indole>C=O >CO-NH-
IVa 3205 3170 1602 1656 1700 1618
IVb 3180 3140 1600 1654 1700 1622
IVc 3100 3150 1505 1654 1701 1625
IVd 3195 3155 1604 1654 1701 1624
IVe 3175 3140 1605 1654 1701 1624
IVf 3190 3150 1604 1654 1701 1624
Figure 1. IR Spectrum of {4-[3-methyl-5-oxo-4-(phenyl hydrazono)-4,5-dihydro-pyrazol-1-yl]- -phenoxy}-acetic acid (2-oxo-1,2-dihydro-indol-3-ylidene)-hydrazide
Table 3.1H NMRSpectral data of{4-[3-Methyl-5-oxo-4-(4|-substituted phenyl hydrazono)-4,5-dihydro-py- razol-1-yl]-phenoxy}-acetic acid (2-oxo-1,2-dihydro-indol-3-ylidene)-hydrazide.
Compound / ppm
IVa
1.1 (s, 3H, CH3), 5.78 (s, 2H, N-CH2-CO), 6.8 (s, 1H, Ar–NH), 6.9-7.0 (m, 4H, C6H4), 7.1–7.3 (m, 5H, Ar-H), 7.4 (d, 2H, C6H4), 7.7 (d, 2H, C6H4 . s, H, CONH , 12.75 (s, 1H, Indole NH)
IVb
0.95 (s, 3H, CH3), 1.14 (s, 3H, CH3), 5.82 (s, 2H, N-CH2-CO), 6.8 (s, H, Ar-NH), 6.9-7.0 (m, 4H, C6H4), 7.1-7.3 (m, 4H, Ar–H), 7.4 (d, 2H, C6H4), 7.7 (d, 2H, C6H4), 10.95 (s, 1H, CONH), 12.75 (s, 1H, Indole NH)
IVc
1.12 (s, 3H, CH3), 3.24 (s, 3H, OCH3), 5.8 (s, 2H, N-CH2CO), 6.8 (s, 1H, Ar-NH), 6.9-7.0 (m, 4H, C6H4), 7.1-7.3 (m, 4H, Ar-H), 7.4 (d, 2H, C6H4) and 7.7 (d, 2H, C6H4), 10.95 (s, 1H, CONH), 12.75 (s, 1H, Indole NH)
IVd
0.95 (s, 3H, CH3), 1.15 (t, 3H, CH3), 3.16 (q, 2H, O-CH2), 5.76 (s, 2H, N-CH2CO), 6.8 (s, 1H, Ar-NH), 6.9-7.0 (m, 4H, C6H4), 7.1-7.3 (m, 4H, Ar-H), 7.4 (d, 2H, C6H4) and 7.7 (d, 2H, C6H4), 10.91 (s, H, CO-NH), 12.72 (s, 1H, Indole NH)
IVe
1.05 (s, 3H, CH3), 5.8 (s, 2H, N-CH2CO), 6.8 (s, H, Ar-NH), 6.9-7.0 (m, 4H, C6H4), 7.1-7.3 (m, 4H, Ar-H), 7.4 (d, 2H,C6H4) and 7.7 (d, 2H, C6H4), 10.93 (s, H, CO-NH), 12.7 (s, 1H, Indole NH)
IVf
1.02 (s, 3H, CH3), 5.78 (s, 2H, N-CH2CO), 6.8 (s, H, Ar-NH), 6.9-7.0 (m, 4H, C6H4), 7.1-7.3 (m, 4H, Ar-H), 7.4 (d, 2H, C6H4) and 7.7 (d, 2H, C6H4), 10.93 (s, H, CO-NH), 12.75 (s, H, Indole NH)
NH2 NHCOCH=N OH
Conc.H2SO4
NH4HSO4 N
H O O
NH2OH, HCl
Cl3C-CH(OH)2
3HCl, H2O
+
R NH N
N N O
CH3
O CH2CONHNH2 (I)
R NH N
N N O
CH3
O CH2CONHN
N H O DMF DMF N HCHO
R NH N
N N O
CH3
O CH2CONHN
N CH2 O N (V) (III) (II) (IV)
Scheme 1. Synthesis of {4-[3-Methyl-5-oxo-4-(4|-{4-[3-Methyl-5-oxo-4-(4|-substituted phenyl hydra- zono)-4,5-dihydro-pyrazol-1-yl]-phenoxy}-acetic acid (2-oxo-1- piperidine-1-ylmethyl-1,2 –dihy-
dro – indol-5-ylidene)- hydrazide (V)
d. Synthesis of {4-[3-Methyl-5-oxo-4-(4|-substituted phenyl hydrazono)-4,5-dihydro-pyrazol-1-yl]-phenoxy}-acetic acid (2-oxo-1-piperidine-1-ylmethyl-1,2-dihydro–indol-3-ylidene)- -hydrazide (V).
A mixture of hydrazone IVa (R = H), aqueous formaldehyde and a solution of piperidine in DMF were stirred for about six hours at room temperature to give {4-[3-Methyl-5-oxo-4-(phenyl hydrazono)-4,5-dihydro-pyrazol-1-yl]-phenoxy}-acetic acid (2-oxo-1-piperidine-1-ylmethyl-1,2-di -hydro–indol-3-ylidene)- hydrazide V a ( R = H).
Similar treatment of hydrazones IV b-f with piperidine in presence of formaldehyde in DMF at room temperature yielded respective {4-[3-Methyl-5-oxo-4-(4|-substituted phenyl hydrazono)-4,5- -dihydro-pyrazol-1-yl]-phenoxy}-acetic acid-(2-oxo-1-piperidine-1-ylmethyl-1,2-dihydro– indol-3-yli-dene)- hydrazide V b-f (R = CH3, OC2H5, -Cl, -Br).
The structures of the compounds V a- f were established on the basis of elemental analysis and spectral data (Table 4) and spectral data (Table 5 and Table 6).
IR Spectral details
The IR (KBr) spectrum (Figure 3) of {4-[3-Methyl-5-oxo-4-(phenyl hydrazono)-4,5-dihydro-pyra-zol-1--yl]-phenoxy}-acetic acid (2-oxo-1-piperidine-1-ylmethyl-1,2-dihydro–indol-3-ylidene)- hydra-zide V a exhibited characteristic bands at around 3195 (NH), 1610 (C = N), 1676 (pyrazoline C = O), 1720 (Indole C = O), 1654 (C – NH) and 2933 cm-1 (CH2) (Table 5).
The spectral data and the respective assignments of V are detailed below.
Table 4. Characterization data of {4-[3-Methyl-5-oxo-4-(4|-substituted phenyl hydrazono)-4,5-dihydro-pyrazol-1-yl]-phenoxy}-acetic acid (2-oxo-1-piperidine-1-ylmethyl-1,2-dihydro-indol-3-ylidene) - hydrazide V
Compd R M.P. Yield, %
Molecular formula
Mass fraction Found, % (Calc., %)
C H N O Cl Br
Va H 158 70 C32H32N8O4
64.86 (64.72) 5.40 (5.28) 19.91 (19.86) 10.81 (10.75) Vb CH3 164 70 C33H34N8O4
65.34 (65.21) 5.61 (5.45) 18.48 (18.34) 10.56 (10.38) Vc OCH3 167 70 C33H34N8O5
63.66 (63.56) 5.46 (5.32) 18.00 (17.85) 12.86 (12.64) Vd OC2H5 159 75 C34H36N8O5
64.15 (64.01) 5.66 (5.45) 17.61 (17.50) 12.56 (12.42) Ve Cl 161 75 C32H31ClN8O4 61.29
(61.15) 4.94 (4.78) 17.87 (17.73) 10.21 (10.8) 5.66 (5.45) Vf Br 160 80 C32H31BrN8O
57.23 (57.08) 4.62 (4.42) 16.69 (16.54) 9.53 (9.38) 11.90 (11.70)
Table 5. IR (KBr) spectral data of{4-[3-Methyl-5-oxo-4-(4|-substituted phenyl hydrazono)-4,5-dihydro-pyrazol-1-yl]-phenoxy}-acetic acid (2-oxo-1-piperidine-1-ylmethyl-1,2-dihydro-indol-3-ylidene)- hydrazide V.
Compound νmax / cm
-1
>NH >C=N- Pyrazoloine C=O Indole C=O >CO-NH- >CH2-
Va 3195 1610 1676 1720 1654 2933
Vb 3170 1616 1674 1715 1658 2920
Vc 3120 1610 1680 1712 1654 2625
Vd 3175 1614 1674 1711 1656 2915
Ve 3155 1616 1674 1714 1658 2920
Figure 3. IR Spectrum of {4-[3-methyl-5-oxo-4-(phenyl hydrazono)-4,5-dihydro pyrazol-1-yl]-phenoxy} –acetic acid (2-oxo-1-piperidine-1-ylmethyl-1,2-dihydro-indol-3-ylidene)-hydrazide
1
H NMR Spectral details
The 1H NMR (200 MHz) spectrum (Figure 4) of 3-[methyl-5-oxo-4-(4|-substituted phenyl hydra-zono)-4,5-dihydro-pyrazol-1-yl]-phenoxy}-acetic acid (2-oxo-1-piperidine-1-yl-methyl-1,2-dihydro– indol-3-ylidene)- hydrazide V was recorded in DMSO-d6 and the data is given below. The
appear-ance of a sig al at δ . due to N–CH2-N, confirmed the formation of Mannich bases (Table 6).
Table 6.1H NMR Spectral data of{4-[3-Methyl-5-oxo-4-(4|-substituted phenyl hydrazono)-4,5-dihydro-pyra- zol-1-yl]-phenoxy}-acetic acid (2-oxo-1-piperidine-1-ylmethyl-1,2-dihydro-indol-3-ylidene)- hydrazide
Compound / ppm
Va
1.14 (s, 3H, CH3), 1.45 (m, 6H, (CH2)3), 2.56 (t, 4H, CH2-N-CH2), 4.45 (s, 2H, N-CH2-N), 5.9 (s, 2H, N-CH2CO), 6.8 (s, 1H, Ar-NH), 6.9-7.0 (m, 4H, C6H4), 7.1-7.3 (m, 5H, Ar -H), 7.4 (d, 2H, C6H4), 7.7 (d, 2H, C6H4), 9.5 (s, H, -CONH).
Vb
0.97 (s, 3H, CH3), 1.12 (s, 3H, CH3), 5.90 (s, 2H, N-CH2-CO), 6.81 (s, H, Ar-NH), 6.9-7.0 (m, 4H, C6H4), 7.1-7.3 (m, 4H, Ar–H), 7.4 (d, 2H, C6H4), 7.7 (d, 2H, C6H4), 9.6 (s, 1H, CONH), 1.45 (m, 6H, (CH2)3), 2.54 (t, 4H, CH2-N-CH2), 4.48 (s, 2H, N-CH2-N).
Vc
1.15 (s, 3H, CH3), 3.12(s, 3H, OCH3), 5.91 (s, 2H, N-CH2CO), 6.8 (s, 1H, Ar-NH),
6.9-7.0 (m, 4H, C6H4), 7.1-7.3 (m, 4H, Ar-H), 7.4 (d, 2H, C6H4) and 7.7 (d, 2H, C6H4), 2.51 (t, 4H, CH2-N-CH2), 1.41 (m, 6H, (CH2)3), 4.41(s, 2H, N-CH2-N), 9.51 (s, 1H, CONH).
Vd
0.98 (s, 3H, CH3), 1.11 (t, 3H, CH3), 3.11 (q, 2H, O-CH2), 2.58 (t, 4H, CH2-N-CH2),
4.42 (s, 2H, N-CH2-N), 5.81 (s, 2H, N-CH2CO), 6.82(s, 1H, Ar-NH), 6.9-7.0 (m, 4H, C6H4), 7.1-7.3 (m, 4H, Ar-H), 1.45 (m, 6H, (CH2)3), 7.4 (d, 2H, C6H4) and 7.7 (d, 2H, C6H4), 9.41 (s, H, CO-NH).
Ve
1.07 (s, 3H, CH3), 2.57(t, 4H, CH2-N-CH2), 4.47 (s, 2H, N-CH2-N), 5.92 (s, 2H, N-CH2CO), 6.8 (s, H, Ar-NH), 6.9-7.0 (m, 4H, C6H4), 7.1-7.3 (m, 4H, Ar-H), 7.4 (d, 2H,C6H4) and 7.7 (d, 2H, C6H4), 1.47 (m, 6H, (CH2)3), 9.38 (s, H, CO-NH).
Vf
Figure 4. 1HNMR spectrum of {4-[3-methyl-5-oxo-4-(phenyl hydrazono)-4,5-dihydro pyrazol-1-yl]-phenoxy} – acetic acid (2-oxo-1-piperidine-1-ylmethyl-1,2-dihydro-indol-3-ylidene)-hydrazide
Mass spectral details
The mass spectrum of {4-[3-Methyl-5-oxo-4-(phenyl hydrazono)-4,5-dihydro-pyrazol-1-yl]-phe-noxy}-acetic acid (2-oxo-1-piperidine-1-yl methyl-1,2-dihydro-indol-3-ylidene)-hydrazide Va (R = H, X = CH2) exhibited the molecular (M+) ion peak at m/z 592.
The fragmentation pattern noticed in the mass spectrum of {4-[3-Methyl-5-oxo-4-(4|-phenyl hydrazono)-4,5-dihydro-pyrazol-1-yl]-phenoxy}-acetic acid (2-oxo-1-piperidine-1-yl methyl-1,2-di-hydro-indol-3-ylidene)-hydrazide Va (R = H, X = CH2) is presented in Scheme 2.
NH N
N N O
CH3
+
(F) m/z 278 (31.8%)
NH N
N N O CH3 O O +
m/z 335 (100%) (E)
NH N
N N O
CH3
O CH2CONHN
+
m/z 453 (18.9%) (G)
+
NH2 N
O CH2CONHN
N CH2 O
N
(H) m/z 421 (22.7%)
N N O
O CH2CONHN
N CH2 O
N
+
(D) m/z 473 (26.6%) O CH2CONHN
N CH2 O
N
+
(I) m/z 391 (26.6%)
NH N
N N
O CH2CONHN
N CH2 O
N
+
(B) m/z 563 (22.6%)
+
m/z 592 (19.6%) (A)
R NH N
N N O
CH3
O CH2CONHN
N CH2 O N
.
-CHO-C3H7 -C10H7N2O
-C10H9N4O
-C16H18N4O3
-C7H11N2O -C14H17N4O -C7H7N2
+
NH N
N N O
CH3
O CH2CONHN
N CH O
N
(C) m/z 549 (32.2%)
The molecular ion A was observed at m/z 592 (19.6 %). Disintegration of molecular ion A yielded the cation B at m/z 563 (22.6 %). Elimination of C3H7 molecule from molecular ion A
resulted in the formation of cation C at m/z 549 (32.2 %). Loss of C7H7N2 radical from A resulted in
the formation of cation D at m/z 473 (26.6 %). Expulsion of C14H17N4O radical from molecular ion
yielded cation E at m/z 335 (100 %). The other important fragments noticed were 278 (31.8 %, F), 453 (18.9 %, G), 421 (22.7 %, H) and 391 (26.6 %, I).
Results and Discussion
Polarographic behaviour of Mannich bases
General polarographic behaviour
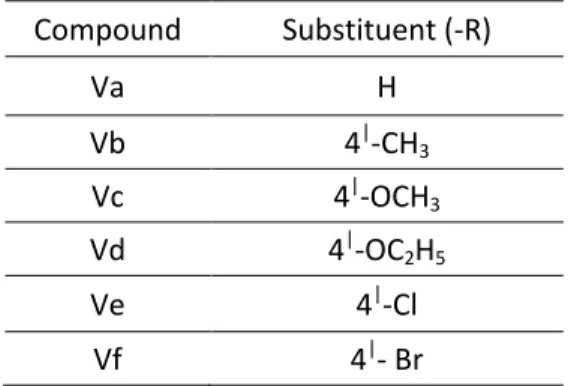
{4-[3-methyl-5-oxo-4-(4|-substituted phenyl hydrazono)-4,5-dihydro-pyrazol-1-yl]-phenoxy} -acetic acid (2-oxo-1-piperidine-1-ylmethyl-1,2-dihydro–indol-3-ylidene)-hydrazides Va-f (Table 7) gave two cathodic waves in the pH range 1.1-7.1 and three cathodic waves in the pH range 8.1-10.1. The Polarograms of Va is shown in the Figure 5. An inspection of structure of above compounds showed that the sites susceptible for reduction at the dropping mercury electrode were exocylic >C=N, exocyclic >C=O and cyclic >C=N.
Table 7. Details of Mannich bases synthesized Compound Substituent (-R)
Va H
Vb 4|-CH3
Vc 4|-OCH3
Vd 4|-OC2H5
Ve 4|-Cl
Vf 4|- Br
Among these groups exocyclic azomethine group was more susceptible for reduction than other groups. However [3-methyl-4,5-dioxo-4,5-dihydro-pyrazol-1-yl]-acetic acid hydrazide does not give reduction wave under experimental conditions. This was probably due to stabilization [25] of the pyrazoline-5-one by ketoenol tautomerism. These observations unambiguously suggest that the waves observed in the present studies were due to reduction of two exocyclic azomethine groups.
Figure 5. Polarograms of {4-[3-Methyl-5-oxo-4-(phenyl hydrazono)-4,5-dihydro-pyrazol-1- -yl]--phenoxy}-acetic acid (2-oxo-1-
-piperidine-1-ylmethyl-1,2-dihydro-indol-3-ylidene)-hydrazide ; c = 1 mM; Medium : Aqueous dimethylformamide (40 % v/v).
A represents the polarogram at pH 4.1 and B that at indicate
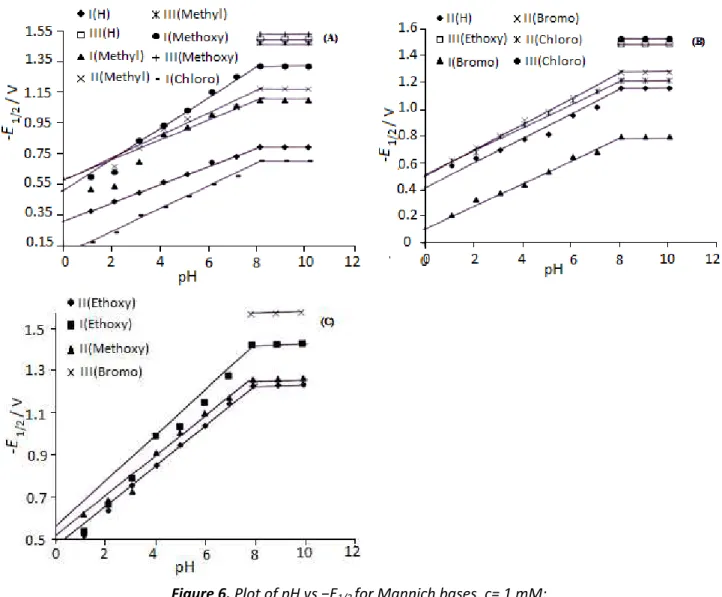
Half wave potential-pH relation
Half wave potentials of first and second waves shifted to more negative potentials with increase in pH of the medium in the range 1.1-7.1 (Table 1 in Supplementary material). The typical
E1/2 – pH graphs are shown in Figure 6. The half wave potentials of the waves were not altered in
alkali e ediu . The alue of ΔE½/ΔpH fo oth a es lie in the range of 0.089-0.094. The E1/2-pH plots observed in the pH range 1.1-10.1 suggest that both the protonated form (acidic) and the deprotonated form (basic) of the depolariser were electroactive.
Figure 6. Plot of pH vs −E1/2 for Mannich bases. c= 1 mM;
Medium = Dimethylformamide (40 % v/v). I, II and III indicate first, second and third wave respectively of corresponding compound at indicated pH as shown in the figures (A), (B), (C), (D) and (E).
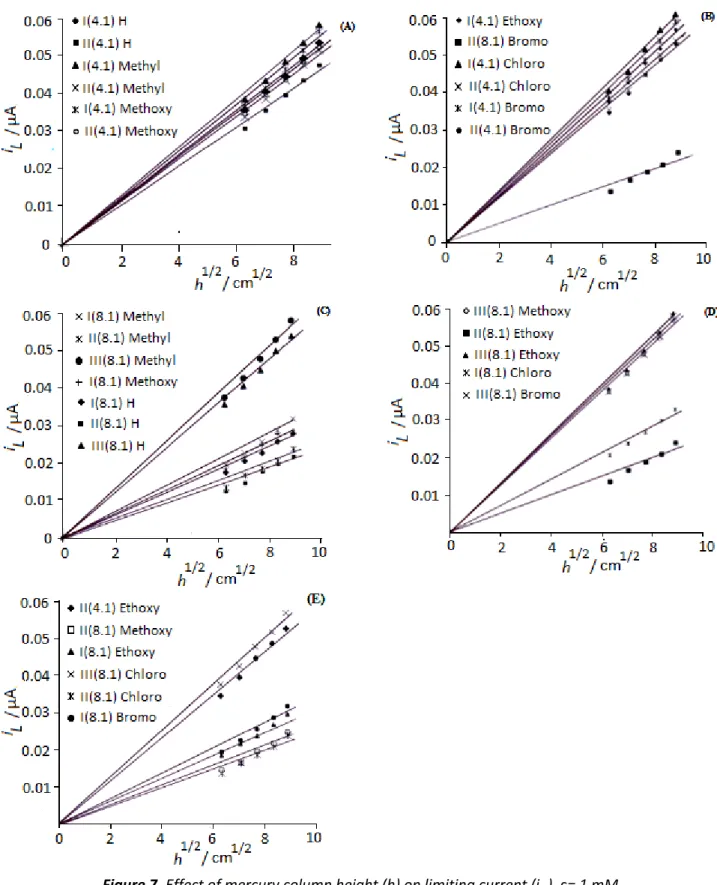
Effect of the height of mercury column head on the limiting current
Figure 7. Effect of mercury column height (h) on limiting current (iL ). c= 1 mM
Medium = Dimethylformamide (40 % v/v). I, II and III indicate first, second and third wave resp.
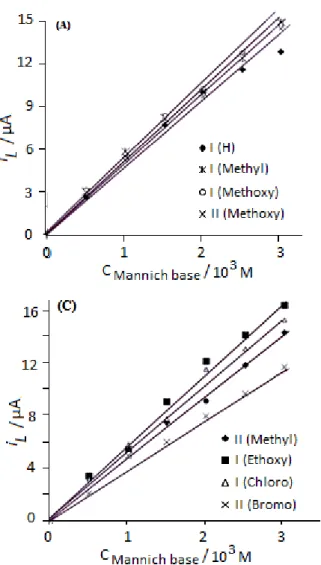
Effect of concentration on the diffusion current
Figure 8. Effect of concentration on limiting current (il). Medium = Dimethylformamide
(40% v/v).I and II indicate first and second wave respectively of corresponding compound as indicated in the figures (A), (B) and (C).
Nature of the electrode process
The linear Edme versus log (i/id-i) plots at typical pH 4.1 are shown in Figure 9. The slopes were
linear in the range 0.066-0.10 V and were not in agreement with the theoretical values 0.030 V and 0.015 V expected for two electron and four electron reversible reduction process respectively. This indicates the irreversible nature of reduction process. The irreversible nature of the pola og aphi a es as fu the o fi ed y e ployi g To e s ite ia [ ].The αna values are
presented in Table 1 in Supplementary material. The irreversible nature of the two waves was attributed to the bulky group present at the end of >C=N-NH-linkage [27].
Nature of the electrode process
The linear Edme versus log (i/id-i) plots at typical pH 4.1 are shown in Figure 9. The slopes were
linear in the range 0.066-0.10 V and were not in agreement with the theoretical values 0.030 V and 0.015 V expected for two electron and four electron reversible reduction process respectively. This indicates the irreversible nature of reduction process. The irreversible nature of the pola og aphi a es as fu the o fi ed y e ployi g To e s ite ia [ ].The αna values are
Figure 9. Semi log plots of Mannich bases. pH 4.1; c = 1 mM; Medium =
Dimethylform-amide (40 % v/v).I and II indicate first and second wave wave respectively of corresponding compound as indicated in the
figures (A), (B) and (C).
Kinetic parameters of the electrode reaction
The kinetic parameters kofha d ΔG* of the electrode reaction at typical pH values evaluated for
first and second waves are presented in Table 1 in Supplementary material. The magnitude of kofh
de eases a d ΔG* increases with the increase in pH of the medium. This indicates irreversible nature of the electrode process [28].
Controlled potential electrolysis
The electrochemical reduction of {4-[3-methyl-5-oxo-4-(4|-substituted phenyl hydrazono)-4,5- -dihydro-pyrazol-1-yl]-phenoxy}-acetic acid (2-oxo-1-piperidine-1-ylmethyl-1,2-dihydro–indol-3- -ylidene)-hydrazide (V) has been studied by the method of controlled potential electrolysis at pH 4.1.
Controlled potential electrolysis was carried out in a Lingane H-type cell. A large pool of mercury at the bottom of the large compartment was used as cathode and a similar pool of mercury at the bottom of smaller compartment served as anode. The cathode compartment contains 10 mL of V (0.01 M), 30 mL of DMF, 20 mL of KCl (1.0 M) and 40 mL of the buffer solution of required pH (4.1). A potential of -1.2 V was applied and maintained at constant potential by the manual control of output from the battery. The electrolysis was followed by recording the decrease in current with time. The number of electrons per molecule was calculated from i-t curves and was found to be 8 [29]. 1 mL of solution was withdrawn from the electrolysis cell to confirm the presence of aniline by standard spot test [30]. Part of the experimental solution was partially evaporated on water bath to half of its volume, allowed to cool to room temperature and was extracted with ether. The ether layer was evaporated under reduced pressure. The yellow crystalline solid obtained was identified to be 2-(5-thioxo- 4,5- dihydro-[1,3,4]-oxadiazole-2- -ylmethyl)-2,4-dihydro-pyrazol-3-o e A y ele e tal a alysis, TLC, I‘, a d 1H NMR spectral data.
separated by using benzene-methanol 4:1 (v/v) solvent as an eluent. The compounds B, C and D were found to be aniline, (4-Amino-3-methyl-5-oxo-4,5-dihydro-pyrazol-1-yl)-acetic acid hydrazide and 3-Amino-1--piperidin-1-ylmethyl-1,3-dihydro-indol-2-one respectively.
Table 8. Characterization data of 2-(5-thioxo-4,5-dihydro-[1,3,4]-oxadiazole-2-ylmethyl)-2,4-di-hydro-pyrazol-3-one Mass fraction of element
found, % (Calc., %) C 36.34 (36.36), N 28.31 (28.27), O 16.18 (16.14), S 16.11 (16.18) IR (KBr) Spectral data
(νmax / cm-1)
3126 (oxadiazole NH); 3180 (NH); 1603 (C = N); 1670 (C = O); 1134 (C = S)
1
H NMR Spectral data ( /ppm)
2.3(s, H, CH3); 5.45 (s, 2H, N – CH2),
14.7 (s, H, thiol-thione tautomeric proton NH), 3.9 & 4.1 (NH2) Mass spectral data: m/e
(Relative abundance, %)
172(77); 171(100); 156(10); 143(33.3); 140(40); 127(47.7); 112(57.7); 100(8.8); 84(13.3); 59(53.3); 57(34.4); 51(28.8); 29(38.8); 27(12.2)
NH N N N O
CH3
O CH2CONHN
N CH2 O N (IX a) HO N N O CH3
O CH2CONHNH2
8e, 8H+
NH2
N
CH2N
O H2N
(B)
(C) (D)
The compounds were characterized by IR and 1H NMR data. The compound B was further confirmed as aniline by azodye test.
Table 9. Elemental analysis and spectral data of B , C and D.
Comp. Mass fraction of element found, % (Calc., %)
IR Spectral data (νmax / cm
-1 )
1
H NMR Spectral data ( / ppm)
B C 77. 31 (77.33), N 15. 13 (15.09) 3180 (NH), 760 (ArH). 6.46 4.0 (s, 2H, ArNH), – 7.01 (m, 5H, ArH)
C C 38. 90 (38.96), N 37.68 (37.78), O 17.45 (17.34) 1676 (C=O), 1654 (CONH), 2933 (CH 2).
0.9 (s, 3H, CH3), 4.09 (s, 2H, N – CH2), 3.9 & 4.2 (s, 2H, NH2), 6.0 (s, 2H, CONH2).
D C 68.59 (68.51), N 17.21 (17.17), O 6.45 (6.54) 3180 (NH), 1666 (C = O). 2.70 (t, 4H, NCH4.52 (s, 2H, NCH2N), 2.0 (s, 2H, NH2), 2), 6.44 (m, 4H, ArH).
Reduction mechanism in acidic medium
Based on the experimental results (Table 10), it was proposed that two azomethine groups in the compounds Va-f were reduced separately involving four electrons. The reduction steps appear as two waves in solutions of pH 1.1-7.1.
It was clear that compounds Va-f were reduced at the dropping mercury electrode through a mechanism which involves the azomethine, imine intermediate and amine via usual sequence.
Hydrazone Imine Amine
It was reported [33,34] that the above mentioned steps of the reduction (formation of VI & VII) occur at the same potential. The mechanism (Scheme 3) proposed was also supported by the results obtained in cyclic voltammetry.
Reduction mechanism in basic medium
In alkaline medium (pH>pKa), V exists in the azomethine anionic form (I). The latter in alkaline solutions, was susceptible to chemical cleavage partially into the corresponding carbonyl compounds III, IV and V as shown in the Scheme 4. The first and second waves noticed in alkaline solutions were attributed to the two 4 electron reduction processes of azomethine anionic form to the species containing amino group. The third wave was attributed to the two 2 electron reduction process of heterocyclic carbonyl compounds (IV and V) obtained during the chemical cleavage of dianion I. The heterocyclic carbonyl compounds were reduced to carbinols by two electron reduction process. The decrease in the height of the first and second waves with increase in alkali concentration was attributed to the partial chemical cleavage of dianion.
Effect of substituents on polarographic behaviour
It is known that the polarographic reduction of compound depends on the nature of the compound, the position of the substituent and the reaction medium. Heyrovsky [35,36] correlated the polarographic behaviour of a representative number of compounds with their structure. He opined that the the reducibility of given compound is influenced by conjugated double bonds, triple bonds and aromatic rings present in the substrate.
E1/2- plots for the compounds under investigation are presented in Figure 10. The values of specific reaction constant () [38] are presented in Table 11.
Table 10. Millicoulometric [37] data of {4-[3-methyl-5-oxo-4(4|-substituted phenyl hydrazono)-4,5-di -hidro-pyrazole-1-yl)-phenoxy}-acetic acid (2-oxo-1-piperidine-1-ylmethyl-1,2-dihdro-indol-3-ylidene)-
-hydrazide at pH 4.1 and 8.1.
pH Current, µA Time, s n value
4.1
First wave
Second wave
Third wave
First wave
Second wave
Third wave
First wave
Second wave
Third wave
5.4 4.8 - - - -
4.4 4.0 - 7200 7200 - 3.2 3.2 -
8.1
3.4 3.2 - 10800 10800 - 3.0 3.2 -
2.7 2.1 5.3 - - - -
2.4 1.9 3.5 7200 7200 7200 2.8 2.8 2.1
2.1 1.7 2.5 10800 10800 10800 3.5 3.4 1.6
It was apparent from Table 1 in Supplementary material that the values of D, E1/2/pH, na and I
(diffusion current constant) were practically in the same range for entire reaction series under study. Thus it was possible to discuss the effect of substituents quantitatively in terms of the Hammett equation [39]. The values of the Hammett substituent constants were taken from the literature [39]. E1/2– plots in media of pH 4.1 and 9.1 for all the compounds under study are
Figure 10.−E1/2–σP plots of Mannich bases (A, B: First wave, C: Second wave at indicated pH). c= 1 mM; Medium = Dimethylformamide (40 % v/v).
Cyclic voltammetric studies of {4-[3-methyl-5-oxo-4(4|-substituted phenyl hyarazono)-4,5-dihydro-pyrazol-1-yl]phenoxy}-acetic acid (2-oxo-1-piperidine-1-ylmethyl-1,2-dihydro-indol-3-ylidene)-hydrazide (V a-f) at hanging mercury drop electrode
The cyclic voltammetric data of compounds Va-f at pH 2.1, 4.1, 6.1, 8.1 and 10.1 are given in Tables 2-7 in Supplementary material. The voltammograms contain two cathodic peaks in acidic solutions and three cathodic peaks in basic solutions at all sweep rates. The cyclicvoltammograms of Va is shown in the Figure 11.
Figure 11. Cyclic Voltammograms of {4-[3-Methyl-5-oxo-4-(phenyl hydrazono)-4,5-dihydro-pyrazol-1-yl]- -phenoxy}-acetic acid (2-oxo-1-piperidine-1-ylmethyl-1,2-dihydro-indol-3-ylidene)-hydrazide;
Influence of scan rate on peak potential and peak current
The cathodic peak potentials were shifted to more negative values with the increase in scan rate. The cathodic peak currents increase with the increase in scan rate. The results are shown in Tables 2-7in Supplementary material.
Nature of the electrode process
ipc vs. 1/2 was a linear plot passing through the origin for the cathodic peaks. This suggests the diffusion controlled nature of the reduction process. This fact was further confirmed by the increase of peak currents with the increase in the concentration of the depolarizer.
The irreversible nature of the electrode process was indicated by following observations. 1. The anodic peak was absent in the reverse scan.
2. The value of (Epc/2 – Epc) was greater than 56.5/n mV, where n represents number of electronics involved in the corresponding electrode process.
3. The Epc shifted towards more negative potentials with increase in the concentration of the
depolarizer.
4. The current function (ipc/ 1/2C) was independent of scan rate and
5. (ipc/ 1/2) vs.υ graph was similar to the one expected for case II of Nicholson-Shain Criteria [43].
Table 11. Effect of pH (Britton-Robinson buffers) on the reaction constant for the reduction of {4-(3-methyl-5-oxo-4-(4|-substituted phenyl hydrozono)-4,5 dihydro-1-yl]-phenoxy}-acetic acid
(2-oxo-1 piperidine – 1- ylmethyl-1,2-dihydro-indol-3-ylidene)-hydrazide.
pH value
First wave Second wave
1.1 0.29 0.20
2.1 0.25 0.25
3.1 0.25 0.25
4.1 0.20 0.20
5.1 0.33 0.58
6.1 0.66 0.66
7.1 0.58 0.58
8.1 0.66 0.50
9.1 0.66 0.50
10.1 0.66 0.50
Effect of pH on the peak potential and peak current
The results presented in Tables 2-7 in Supplementary material show that the cathodic peak potential shifts towards more negative values with the increase in pH of the solution.
The first and the second cathodic peak currents decrease with increase in pH of solutions from 2.1 to 10.1, while peak current corresponding to the third wave noticed in alkaline solutions remains constant. The results were similar to those observed in polarographic studies. Hence the reduction mechanism at HMDE was assumed to be same as that noticed at DME.
Reduction pattern in acidic media
From the position of the peak on potential axis, it was proposed that first and second cathodic peaks obtained in acidic solutions were due to the reduction of azomethine group to amines. The reduction mechanism is shown in Scheme 3.
R NH N
N N O
CH3
O CH2CONHN
N
CH2
O
N
fast 2H+
R NH2-N
N N O
CH3
O CH2CHONH2N
N
CH2
O
N
4e, 2H+
R NH
2+
N N O
CH3
O CH2CONH2
HN
HN
N
CH2
O
N
+
N N O
CH3
O CH2CONH2
H2N H2N
N
CH2
O
N
2e, 2H+ 2e, 2H+
(I)
(II)
(III) (IV) (V)
(VI) (VII)
+
+
Scheme 3. Reduction in acidic medium
Reduction pattern in alkaline media
Inverted peaks
Except in solutions of pH 8.1-10.1 and in 0.1 M NaOH, the compounds of V series exhibit inverted peaks (Figure 11). The inverted peak is a common phenomenon in electrochemical reduction of organic compounds [44-46].
8e, H2O
R NH N
N N O
CH3
O CH2CONHN
N CH2 O N (I) OH R N-N N N O CH3
O CH2CON-N
N CH2 O N (V) (III) (IV) (II) + R NHNH
2 + N
N O
CH3
O CH2CONHNH2
O
N CH2 N O
O
N CH2 N O HO HO N N O CH3
O CH2CONHNH2
2e, H2O 2e, H2O
(VI)
R NH2 +
+
N N O
CH3
O CH2CONHNH2 H2N
N CH2 N O
H2N
(VII)
(VIII) (IX)
(IX)
Electron reduction Partial chemical cleavage
Scheme 4. Reduction in basic medium
In present studies, the peak potentials were unaltered at lower sweep rates (10-50 V s-1). At higher sweep rates (100-500 V s-1), peak current increases with increases in sweep rate. However a cathodic peak during anodic cycle (Inverted peak) was noticed in buffer solutions of pH 2.1-6.10.
Inverted peaks are generally attributed to
The movement of mercury surface due to uneven drop polarisation. This bears similarity to the explanation of polarographic maximum of the first kind [47-49] or
If the peak is attributed to the second possibility, its intensity is expected to increase with decrease in scan rate. Hence the results in the present studies were not attributed to the second possibility. Moreover, a significant polarographic maximum was observed for the compounds under the experimental conditions of study. It is clear therefore that the inverted peak was attributed to the movement of the mercury surface due to uneven drop polarization.
Effect of substituents on the cyclic voltammetric behaviour of {4-[3- methyl-5-oxo-4(4| -substituted phenyl hydrazono)-4,5-dihydro-pyrazol-1-yl]phenoxy}-acetic acid (2-oxo-1-piperidene-1-ylmethyl- 1,2-dihydro indol-3-ylidene)-hydrazide.
To investigate the influence of the substituent on cathodic peaks corresponding to the azo g oup edu tio , Ha etts linear free energy relations were applied. The plots drawn between the athodi peak pote tial a d the Ha ett s su stitue t o sta t e e p ese ted i Figu e 12. The slope () of the linear plots so obtained was positive and confirms the nucleophilic reduction. The values are presented in Table 12.
Table 12. Effect of pH on the reaction constant for the reduction of {4-[3-Methyl-5-oxo-4-(4|-substituted phenyl hydrazono)-4,5-dihydro-pyrazol-1-yl] phenoxy}-acetic acid (2-oxo-1-piperidine-1-yl methyl)-1.2 di-
hydro-indol-3-ylidene)- hydrazide.
pH
I wave II wave
2.1 0.33 0.33
4.1 0.25 0.25
6.1 0.25 0.25
8.1 0.33 0.33
10.1 0.33 0.33
Cyclic voltammetric studies of {4-[3-methyl-5-oxo-4-(4|-substituted phenyl hydrazono)-4,5-dihydro-pyrazol-1-yl]-phenoxy}-acetic acid (2-oxo-1-piperidine-1-ylmethyl-1,2-dihydro– indol-3-ylidene)-hydrazide (Mannich bases V a-f) with a crown–ether modified carbon paste electrode.
Cyclic voltammetric studies of {4-[3-methyl-5-oxo-4-(4|-substituted phenyl hydrazono)-4,5-dihydro-pyrazol-1-yl]-phenoxy}-acetic acid (2-oxo-1-piperidine-1-ylmethyl-1,2-dihydro– indol-3-ylidene)-hydrazide (V a-f) were carried out at modified carbon paste electrode in buffer solutions of pH value 2.1, 4.1, 6.1, 8.1 and 10.1 at different scan rates i.e. 10 mV s-1, 20 mV s-1, and 50 mV s-1, 100 mV s-1, 200 mV s-1, 300 mV s-1, 500 mV s-1. At all scan rates, the compounds exhibit two well defined cathodic peaks in solutions of pH 2.1-6.1 and three cathodic peaks in alkaline solutions of pH 8.1 - 10.1. An extra anodic peak was noticed in the acidic solutions of pH 2.1 – 6.1.
Effect of scan rate on peak potential and peak current
Peak potentials and peak currents change with the change of scan rates. The cathodic peak potentials become more negative and cathodic peak currents increase with increase in scan rate (Tables 2-7 in Supplementary material).
Effect of pH on peak potentials and peak current
The cathodic peak potentials were shifted to more negative values with the increase in pH. The peak currents decrease with increase in pH of the medium. The data is given in the Tables 2-7 in Supplementary material.
Nature of electrode process
The irreversible nature of electrode process was established by the fact that a plot of ipc/υ1/2
versus sweep rate was a straight line parallel to sweep rate axis. The irreversible nature of electrode process was confirmed by
dependence of peak potential on sweep rate,
the separation of anodic peak and cathodic peak potential (Epa–Epc = Ep) was not equal to
60 / n mV at 25C53, where n represents number of electronics involved in the corresponding electrode process.
the shape of ipc/υ1/2 versus υ plot was in accordance with the Nicholson and Shain criteria
[43].
The linear plots of ipc versus υ1/2 suggest the diffusion controlled nature of the electrode
process. This was further supported by the negative shift of peak potential with increase in sweep rate. The plots of ipc vs concentration and ipc vsυ½ fulfil the criteria for the diffusion controlled
nature of the electrode process. The plots of Epc vs pH were similar to E½ vs. pH plots and this supports the findings and conclusion drawn from DC polorography.
Comparison between polarographic studies and cyclic voltammetric studies
Equal number of polarographic waves and cyclic voltammetric peaks noticed in DC polarographic and cyclic voltammetric studies respectively suggest similar behavior in both the studies. However, an additional anodic peak was noticed in solutions of pH 2.1 – 6.1 may be attributed to oxidation of amine formed in the previous reduction step.
Conclusions
polarographic waves in the media pH 1.1-7.1 and three waves in the media pH 8.1-10.1. The results were compared with those obtained in cyclic voltammetry at hanging mercury drop electrode and modified carbon paste electrode. The mechanism for the reduction process in acidic as well as basic medium is proposed.
References
[1] H. S. El-Kashef, M. A. Abd-Alla, B. E. Bayoumi, A. A. M. El-Timawy, J. Chem. Tech. Biotech.
33 (1983)294-298.
[2] K. Guckian, M.B. Carter, E. Y. Lin, M. Choi, L. Sun, P. A. Boriack-Sjodin, C. Chuaqui, B. Lane, K. Cheung, L. Ling, W. C. Lee, Bioorg. Med. Chem. Lett. 20 (2010) 326-329.
[3] P. Manojkumar, T. K. Ravi, S. Gopalakrishnan, Eur. J.Med. Chem.44 (2009) 4690-4694. [4] J. P. Raval, A. B. Shah, N. H. Patel, H. V. Patel, P. S. Patel, K. K. Bhatt, K. R. Desai, Eur. J. Chem
2 (2011) 238-242.
[5] X. Fan, X. Zhang, L. Zhou, K.A. Keith, E. R. Kernb, P. F. Torrencea, Bioorg. Med. Chem. Lett.
16 (2006) 3224-3228.
[6] R. Robinson, J. Chem. Soc. 111 (1917) 762-768.
[7] E. J. Corey, R. D. Balanson, J. Am. Chem. Soc.96 (1974) 6516-6517.
[8] S. D. Knight, L .E. Overman, G. Pairaudeau, J. Am. Chem. Soc.115 (1993) 9293-9294. [9] S. Joshi, A. D. Manikpuri, P. Tiwari, Bioorg. Med. Chem. Lett.17 (2007) 645-648. [10] S. Joshi, N. Khosla, P. Tiwari, Bioorg. Med. Chem. Lett. 12 (2004) 571-576.
[11] B. Shivarama Holla, BS. Sreenivasa, B. Kalluraya, Boll. Chim. Farm.133 (1994) 527-531. [12] T. B. Shah, A. Gupta, M. R. Patel, V. S. Chaudhari, H. Patel, V. C. Patel, Ind. J. Chem. B 48B
(2009) 88-96.
[13] A. Tambo-ong, S. Chopra, B. T. Glasar, K. Matsuyama, T. Tran, P. B. Madrid, Bioorg. Med. Chem. Lett. 21 (2011) 5697-5700.
[14] G. Q. Hu, L. L. Hou, S. Q. Xie, W. L. Huang, H. B. Zhang, Yao Xue Xue Bao43 (2008) 926-929. [15] M. A. La-Scalea, C. M. de Souza Menezes,M. S. da Silva Juliao, M. C. Chung, S. H. Pires
Serrano, E. I. Ferreira, J. Braz. Chem. Soc. 16 (2005) 774-782.
[16] D. I. Edwards, Comprehensive Medicinal Chemistry. The Rational Design, Mechanistic Study & Therapeutic Application of Chemical Compounds, Pergamon Press, Oxford, 1990, 546-554.
[17] C. Viode, C. De Albuquerque, G. Chau ie e, C. Houée-Levin, J. Perie, New J. Chem.21 (1997) 1331-1338.
[18] A. Guissani, Y. Henry, N. Lougmani, B. Hickel, Free Rad. Biol. Med.8 (1990) 173-189. [19] J. Rozenski, C.J. De Ranter, H. Verplanken, Quant. Struct-Act. Rel.14 (1995) 134-141. [20] H. Ce e etto, ‘. Di Maio, M. Go zález, M. ‘isso, G.Sag e a, G. Seoa e, A. De i ola, G.
Peluffo, C. Quijano, A. O. M. Stoppani, M. Paulino, C. Olea-Azar, M. A. Basombrio, Eur. J. Med. Chem. 35 (2000) 343-350.
[21] K. R. Kumar, A. R. G. Prasad, V. Srilalitha, G. N. Swamy, L.K. Ravindranath, Sci. Iran. Trans. C
19 (2012) 605-618.
[22] K. R. Kumar, A. R. G. Prasad, V. Srilalitha, G. N. Swamy, L.K. Ravindranath, Ovidius University Annals of Chemistry23 (2012) 5-20.
[23] L. K. Ravindranath, K. Srikanth, M. Dastagiri Reddy, S. D. Ishrath Begum, Orient. J. Chem. 25 (2009) 993-998.
[24] C. S. Marvel, G. S. Heirs, Organic Synthesis, Vol. I, John Wiley and Sons, New York, 1941, p. 342.
[25] J.W. Ross, R.D.Demars, I. Shain. Anal. Chem.28 (1956) 1768-1772. [26] J. Tomes, Coll. Czech. Chem. Commun. 9 (1937) 12-18.
[28] K. R. Kumar, A. R.G. Prasad, V. Srilalitha, G. N.Swamy, L.K. Ravindranath, Rev. Colomb. Quim. 40 (2011) 165-184.
[29] J.J. Lingane, J. Am. Chem. Soc.67 (1945) 1916-1922. [30] F. Feigl, Spot Test, Vol. II, Elsevier, Amsterdam, 1954, 231.
[31] R. N. Adams, Electrochemistry at Solid Electrodes, Marce Dekkar Inc., New York, 1969, 332. [32] R. N. Adams, Anal. Chem.30 (1958) 1576-1576.
[33] Saul Patai, The chemistry of hydrazo, azo and azoxy groups (Part – I), John Wiley and Sons, Interscience Publications, London, 1975, 389.
[34] P. Zuman, Topics in Organic Polarography, Plenum Press, New York, 1970, 231. [35] J. Heyrovsky, A polarographic study of the electrokinetic phenomena of adsorption,
electro-reduction and overpotential displayed at the dropping mercury cathode, Hermann, Paris, , . A tualités S ie tifi ues et I dust ielles, No. : ‘éu io I te atio ale de Chimie-Physique, 1933, No. 10)
[36] J. Heyrovsky, Polarography, Springer Verlag, Wien, 1941, 239. [37] T. De Vries, J. L. Kroon, J. Am. Chem. Soc.75 (1953) 2484-2486.
[38] A. R.G. Prasad, V. Seshagiri, L.K. Ravindranath, Jordan J. Chem.6 (2011) 51-64. [39] L. B. Hammett, Physical Organic Chemistry, McGraw-Hill, New York, 1940, 787. [40] H. H. Jaffe, Chem. Rev. 53 (1953) 191-261.
[41] P. Zuman, Substituent effects in Polarography, Plenum Press: New York, 1976, 213. [42] L. K. Ravindranath, S. R. Ramadas, S. Brahmaji Rao, Electrochim. Acta 28 (1983) 601-603. [43] R. S. Nicholson, I. Shain, Anal. Chem.36 (1964) 706-723.
[44] B. J. H. Wang, K .L. Lee. J. App. Electrochem. 26 (1996) 153-159.
[45] P. Krtil, L. Kavan, I. Moskovcova, K. Kratochvicova, J. Appl. Electrochem.26 (1996) 523-527. [46] M. Neol, C. Ravichandran, P. N. Anantharaman, J. Appl. Electrochem. 25 (1995) 690-698. [47] P. Delahay, New Instrumental Methods in Electrochemistry, Interscience Publishers Inc.,
New York, 1966, 389.
[48] M. Pourobaix, Atlass of Electrochemical Equilibrie in Aqueous Solutions, Pergamon Press, New York, 1966, 571.
[49] R. S. Nicholson, I. Shain, Anal. Chem. 36 (1964) 706-723.
[50] D. A. Tyssee, M.M. Baizer. J. Electrochem. Soc. 118 (1971) 1420-1425. [51] P. Tissot, P. Margaretha, Electrochim. Acta23 (1978) 1049-1052. [52] K. S. V. Santhanam, A. J. Bard, J. Am. Chem. Soc.88 (1966) 2669-2675. [53] P. Vanysek, Electrochim. Acta 40 (1995) 2841-2847.
© by the authors; licensee IAPC, Zagreb, Croatia. This article is an open-access article distributed under the terms and conditions of the Creative Commons Attribution license
![Table 1. Characterization of {4-[3-Methyl-5-oxo-4-(4 | -substituted phenyl hydrazono)-4,5-dihydro-pyra- zol-1-yl]-phenoxy}-acetic acid (2-oxo-1,2-dihydro-indol-3-ylidene)-hydrazide](https://thumb-eu.123doks.com/thumbv2/123dok_br/18356862.353683/3.893.73.818.529.796/characterization-methyl-substituted-hydrazono-phenoxy-dihydro-ylidene-hydrazide.webp)
![Figure 1. IR Spectrum of {4-[3-methyl-5-oxo-4-(phenyl hydrazono)-4,5-dihydro-pyrazol-1-yl]- -phenoxy}-acetic acid (2-oxo-1,2-dihydro-indol-3-ylidene)-hydrazide](https://thumb-eu.123doks.com/thumbv2/123dok_br/18356862.353683/4.893.96.800.137.708/figure-spectrum-hydrazono-dihydro-pyrazol-phenoxy-dihydro-hydrazide.webp)
![Table 3. 1 H NMR Spectral data of {4-[3-Methyl-5-oxo-4-(4 | -substituted phenyl hydrazono)-4,5-dihydro-py- razol-1-yl]-phenoxy}-acetic acid (2-oxo-1,2-dihydro-indol-3-ylidene)-hydrazide](https://thumb-eu.123doks.com/thumbv2/123dok_br/18356862.353683/5.893.98.813.532.1090/spectral-methyl-substituted-hydrazono-dihydro-dihydro-ylidene-hydrazide.webp)
![Table 4. Characterization data of {4-[3-Methyl-5-oxo-4-(4 | -substituted phenyl hydrazono)-4,5-dihydro- hydrazono)-4,5-dihydro-pyrazol-1-yl]-phenoxy}-acetic acid (2-oxo-1-piperidine-1-ylmethyl-1,2-dihydro-indol-3-ylidene) - hydrazide V](https://thumb-eu.123doks.com/thumbv2/123dok_br/18356862.353683/6.893.104.793.620.895/characterization-substituted-hydrazono-hydrazono-piperidine-ylmethyl-ylidene-hydrazide.webp)
![Figure 3. IR Spectrum of {4-[3-methyl-5-oxo-4-(phenyl hydrazono)-4,5-dihydro pyrazol-1-yl]- pyrazol-1-yl]-phenoxy} –acetic acid (2-oxo-1-piperidine-1-ylmethyl-1,2-dihydro-indol-3-ylidene)-hydrazide](https://thumb-eu.123doks.com/thumbv2/123dok_br/18356862.353683/7.893.119.777.88.473/figure-spectrum-hydrazono-phenoxy-piperidine-ylmethyl-dihydro-hydrazide.webp)
![Figure 4. 1 HNMR spectrum of {4-[3-methyl-5-oxo-4-(phenyl hydrazono)-4,5-dihydro pyrazol-1-yl]-phenoxy} – acetic acid (2-oxo-1-piperidine-1-ylmethyl-1,2-dihydro-indol-3-ylidene)-hydrazide](https://thumb-eu.123doks.com/thumbv2/123dok_br/18356862.353683/8.893.144.764.100.451/figure-spectrum-hydrazono-piperidine-ylmethyl-dihydro-ylidene-hydrazide.webp)