Industrial Performance Assessment through
the Application of a Benchmarking and
Monitoring System
CONFERENCE PAPER · FEBRUARY 2014
7 AUTHORS, INCLUDING:
Heráclito L. J. Pontes
Universidade Federal do Ceará
22PUBLICATIONS 1CITATION
SEE PROFILE
Enzo Morosini Frazzon
Federal University of Santa Catarina
23PUBLICATIONS 21CITATIONS
SEE PROFILE
Industrial Performance Assessment through the
Application of a Benchmarking and Monitoring
System
Prof. Dr. Marcos Ronaldo Albertin1, Prof. Dr. Heráclito Lopes Jaguaribe Pontes1, Prof. Dr. Enzo Morosini Frazzon2 , Eng. Enio Rabelo Frota1
1
Federal University of Ceará, Departamento de Engenharia de Produção, Campus do PICI, PICI – Fortaleza – Ceará - Brazil, CT – UFC. CEP – 60455-990.
2
Federal University of Santa Catarina, Departamento de Engenharia de Produção e Sistemas, Campus Universitário João David Ferreira Lima, Trindade – Florianópolis – Brazil, CTC – UFSC. CEP – 88040-900.
Abstract: The purpose of this paper is to describe a multiple criteria benchmark-ing and monitorbenchmark-ing system for assessbenchmark-ing the performance of industrial sectors. The referred system was designed for comparing and monitoring companies’ perfo r-mance against market requirements. As an illustration, data collected during a three-year period for a specific local productive arrangement of Ceará, Brazil are showcased. The findings indicate the opportunities and needs for collective strate-gic actions by the companies and sectors in order to promote local development.
1 Introduction
and individual performances represents a good opportunity to research, because there has been little exploration about integrated development actions in supply chains. For the performance analysis, a metric system is necessary. The literature on this subject of performance assessment emphasizes intra-organizational measures which conflicts with the emphasis on inter-organizational collaboration which is dominant in the literature addressing extended enterprises (Zhou and Benton Jr., 2007). Albertin at al. (2010) developed a computational system to share information in a competitive and collaborative environment using an internet benchmarking methodology called Benchmarking and Monitoring System of Pro-ductive Arrangements (SIMAP). Effective benchmarking requires standards or criteria for measuring performance across the broad range of organizations. SIMAP measures the relative performance levels of similar operations or activities from local or interconnected organizations. It shows individual and collective gaps and local development opportunities.
Benchmarking is defined by Xerox as a continuous and systematic process of evaluating companies recognized as industry leaders, to determine business and work processes that represent best practices and establish rational performance goals (Camp, 1989). Analyzing the evolution of benchmarking, Kyrö (2003) pro-poses a new and more complete definition: “Benchmarking refers to evaluating and improving an organisation’s, its units’ or a network’s performance, technol o-gy, process, competence and/or strategy with chosen geographical scope by learn-ing from or/and with its own unit, other organisation or a network that is identified as having best practices in its respective field as a competitor, as operating in the same industry, cluster or sector or in the larger context with chosen geographical scope” p.222.
3
2 Benchmarking and Monitoring System (SIMAP)
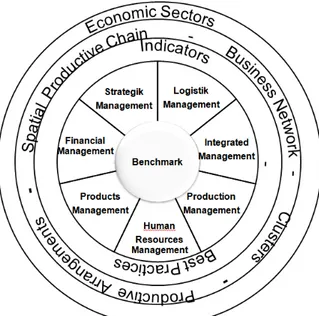
The SIMAP is an interactive benchmarking tool created to help companies, devel-oping agencies and policy makers to identify challenges and opportunities for im-proving their performance. Through a significant sample of collected data, the sys-tem allows for a more productive dialogue among government and companies, based on information updated dynamically, avoiding inefficient and unfocused ac-tions. To sum up, a company can compare itself with the average of the registered companies, in the state and country where they act. It can also identify benchmark companies, which are reference of efficiency (performance) and effectiveness (re-sults) to other companies that belongs to the same link (have the same process). Besides systemic competitiveness SIMAP’s proposal is supporting action at the meso-level (Messner, 1996; Altenburg et al., 1988). It was originally developed to promote the development of the automotive industry of the state of Rio Grande do Sul (RS-Brazil), and now is being used as a tool to increase the supply of local content in many regional PAs in the state of Ceará (Albertin, 2003).
Figure 1: Application of SIMAP. Source: authors
and Financial Management (GP07) as shown in Figure 1. The first subsystem GP01 has five criteria as shown in Appendix A. Each criterium has a growing per-formance metric adapted from Likert scale of five levels (0, 25, 50, 75, and 100), featuring categorized qualitative data. These criteria represent performance and best practices. For example, the criterion “ISO 9001” can only be answered with: NA (not applicable), 0% (informal procedures), 25% (documented procedures), 50% (formal program development), 75% (performs internal audits) and 100% (company certified).The criteria and performance levels derive from the require-ments established in the Malcolm Bridge Award, as well as in the Toyota Produc-tion System, ISO / TS 16949 and ISO 9001. Each subsystem was set based on in-terviews with companies and professionals to identify the most important tools. A minimal or desirable performance (requirement) to delivery to a focal company was identified for each PA.The data was collected by interviews, technical visits and mainly by internet. As a method to analyse the collected dates we are using: a) bars graphics and means and b) individual and collective visual gaps analysis. It is observed in Figure 2 the performance of a company (bar chart) and the mean comparison of performance in the GP01 to GP07 subsystems of all registered companies on the local automotive supply chain in the State of Ceará.
Figure 2: Individual performance (bars) and the average performance (line)
5
System Architecture - Main Components (web server)
Data management
Benchmarking
Analysis Cooperation Tools
Peer group
Benchmark Best Practices
Technologies Methods Indicators
Gap analysis
Analysis
Comparison of spatial productive chain Comparison of process, products and services by region, country and spatial
productive chain (Gaps) Market requirements
Sharing information and strategies
Initiatives
Competitive and collaborative environment
(Non-) commercial information
Statistical Analysis
Identificati on of outliers
Cause-effect analysis
Best Pratices
Reports on line
Bar graph and mean And-or reports Flexible reports Pie charts and
tables Productive
Arrangement Evaluation Monitoring
Figure 3: SIMAP System Architecture (adapted from Johnson et. al., 2010)
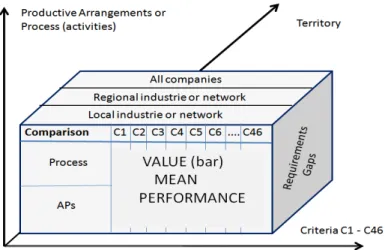
With this innovative tool any firm with Internet access can participate and view the individual performance analysis results in real-time. It is observed that the in-clusion of data in SIMAP occurs with the indication of the location, which can be territorial state, region or country, as represented in the axis "territory" in Figure 4.
This figure illustrates the possible comparisons in SIMAP. The axis "activities" provides the benchmarking by activity (link) of companies compared to other links of the same or different PA. It is possible, for example, for a machining company to compare itself with the average performance of other states and coun-tries, and with its direct competitors in the same PA (territory) or in the same country. It is possible to draw a value chain, a supply chain, cluster, or other types of productive arrangements (PAs), and make restricted or unrestricted access
comparisons.
A total of 285 entries were made in Ceará companies operating in 18 production chains. Supply chains with more registered companies are Metal-Mechanic (56) Construction (49) Automotive (35), Textiles and Clothing (30) and Food and Beverage (23).3 Industrial Performance Assessment
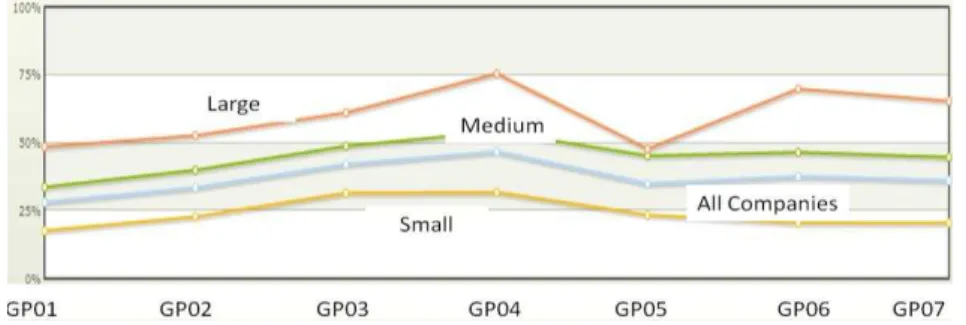
In this section we present results and analysis of the study. The graphs were gen-erated from SIMAP with the database of June/2012. The average performance of firms by size in Ceará is shown in Figure 5. It can be observed that the average performance of large companies is around the range of 50-75%, the performance of medium-sized companies is close to 50%, while the performance of small busi-nesses oscillates around 25%. The range of 25% indicates an effort towards the formalization and standardization of processes. The overall performance of all companies from Ceará registered in SIMAP is represented by the 3rd line (overall average) in the range between 25 and 50%.
Figure 5: Average performance by size in Ceará
7
Figure 6:Company “Benchmarking” and Automotive PA
The differences between the performance (continued line or bar graph) and indus-try market requirements (dotted line) are called bottlenecks or gaps. As shown SIMAP allows viewing "online and on time" gaps for any company registered for free. Gaps are considered technical barriers to supply the local production chain. The gaps in the criteria subsystems Integrated Management (GP01) and Product Management (GP03), by company size, are represented in Figure 7 and 8. Leg-ends can be found in the Appendix.
Figure 7: Gaps for the Automotive PA (AUT) considering the subsystem GP01
It is observed that there are gaps in all sizes of company, for the criteria C1 through C5, and that they are larger for small businesses. The certification to in-ternational standards ISO 9001 (C1) is not implemented yet in most of the state.
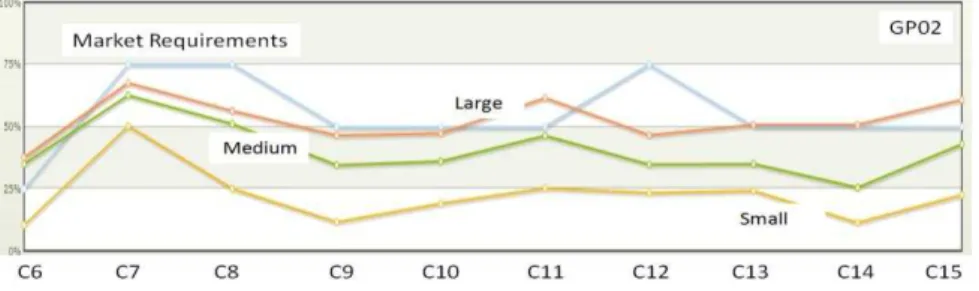
Figure 8 shows the gaps of Production Management subsystem (GP02). The gaps for the criteria C6 through C15 are smaller for medium and large companies and significantly large for small businesses. The gaps are larger than the criteria capa-bility studies (C8) and maintenance (C12).
Figure 10: Gaps for the Automotive PA considering the subsystem GP03
The Product Management subsystem chart above is comprised by the criteria gaps for C16 to C21. The highest development of products and processes through func-tional teams is in the criterium C18. It is observed that the requirements to provide the automotive industry are equal for any company, regardless of size. The small-sized companies work with informal procedures, which are not documented, and its processes are shown to be unstable.
4 Discussion
9
most supply requirements of regional or national leading companies, but it can be improved by benchmarking of companies that stand out. The benefit of SIMAP system is to promote individual and collective actions those impacts on an AP. The following information could be obtained online: a) Individual performance in 46 criteria and their 7 subsystems with the Likert scale (0-25-50-75-100%); b) Average performance of companies registered in the same PA, or even in the same activity or in the same territory; c) Individual and collective gaps analyses and d) Visualization of competitive positioning after some actions.
References
Albertin, M. (2003) O processo de governança em arranjos produtivos: o caso da cadeia automotiva do RGS. Doutorado - Faculdade de Engenharia de Produção UFRGS, Porto Alegre, 2003.
Albertin, M.; Telles, B.; Aragão, D. (2010) Methodology for monitoring of productive arrangements. Dynamics in Logistics: Second International Conference, LDIC 2009. Bremen: Springer.
Altenburg,T.; Hillebrand, W; Meyer-Stamer, J. Building systemic competitiveness. Berlim: German Development Intitute. Reports and Working Papers 3 (1998).
Balestrin, A.; Verschoore, J. (2008) Redes de cooperação empresarial: estartégias de gestão na nova economia. Porto Alegre: Bookman, 2008.
Camp, R.C. Benchmarking: The Search for Industrial Best Practices that Lead to Superior Perfor-mance. Quality Resources and ASQC Quality Press, New York, NY. Milwaukee, WI, 1989. Hon, K.K.B. Performance and Evaluation of Manufacturing Systems, CIRP Annals - Manufacturing
Technology 54 (2) (2005) 139–154.
Johnson, A.; Chen, W.-C.; Mcginnis, L. F. (2010) Large-scale Internet benchmarking: Technology and application in warehousing operations. Computers in Industry [S.I.], v. 61, n. 3, p. 280-286, KYRÖ, P. (2003). Revising the concept and forms of benchmarking. Benchmarking: An International
Journal, 10(3), 210-225.
Lehtinen, J.; Ahola, T. (2010) Is performance measurement suitable for an extended enterprise? Inter-national Journal of Operations & Production Management [S.I.], v. 30, n. 2, p. 181-204,
Messner, D. Staat, Markt und Netzwerksteuerung für systemische Wettbewerbsfähigkeit, 15, INEF Report, Duisburg: Gerhard Universität, 1996.
Polenske, K. (2004) Competition, Collaboration and Cooperation: An Uneasy Triangle in Networks of Firms and Regions. Regional Studies, [S.I.], v. 38, n. 9, p. 1029-1043, December 2004.
APENDIX A
Integrated Management System (GP01)
GP01 0 25 50 75 100
C1. ISO 9001 C2. ISO 14001 C3. 5S C4. SA 8000 C5. OSHAS 18000
Informal Procedures
Documented Procedures
Formal program deployment
Conducts inter-nal audits
Certificated
Production Management (GP02)
GP02 0 25 50 75 100
C6. Setup time Informal Procedures Documented Procedures
Time < 60 min Time < 40 min < 10 (SMED)
C7. Production Planning and Control (PPC)
Informal Procedures
Electronic sheets (Excel, Calc, etc.)
Software MRP and MRP II
ERP
C8. Capability studies
Informal Procedures
Instable process Stable process CEP Cpk > 2
C9. Quality costs
Unknown Monitors 1-10% revenue < 1 % revenue < 0,5 revenue
C10. Process Control
Informal Parameters
Formal Parame-ters
Monitored pa-rameters
Calibrated in-struments
Capability studies
C11. Part Per Million (PPM)
Unknown Known 1-10 % < 1000 PPM < 500 PPM
C12. Total Pre-ventive Mainte-nance
Corrective Maintenance plan informal
Preventive Predictive TPM
C13. Just in Time
Not use tools
One tool Two tolls Three tools Many tools
C14. Suppliers development
Informal Procedures
Formal Proce-dures
Monitors per-formance
Training pro-grams
Establishing part-nership
C15. Average age of equipment
Unknown More than 20 years
Between 10 and 20 years
Between 5 and 10 years
More than 5 years
Products Management (GP03)
GP03 0 25 50 75 100
C16. Use of tech-nical norms
Unknown Knows and use partly
Uses the main Always use Uses 100% and update C17.
CAD –CAE-CIM
Unknown Known Uses CAS Uses CAD e CAE
Uses CAD-CAE-CIM C18. Multifunctional groups Doesn’t perform
Uses informally Documented procedure
Implemented Always uses
C19.
Time to market
Doesn’t control
Informal control Monitor Competitive Is benchmark
C20. Methodolo-gy for develop-ment of new products
Unknown Informal Documented Continually im-prove
Concept uses of lessons learn
C21. Suppliers and customers partnerships
Doesn’t perform