Brajendra singh Rajpoot IRJP 2012, 3 (7)
Page 297
INTERNATIONAL RESEARCH JOURNAL OF PHARMACY
www.irjponline.com
ISSN 2230 – 8407
Research Article
METHOD DEVELOPMENT AND VALIDATION OF RP-HPLC METHOD IN THE
DETECTION OF EFAVIRENZ IN BULK DRUG AND TABLET FORMULATION
Brajendra singh Rajpoot*
Shri R.N.S. College of Pharmacy Gormi Bhind, M.P., India
Article Received on: 09/04/12 Revised on: 12/05/12 Approved for publication: 26/06/12
*Email: [email protected]
ABSTRACT
A simple, highly sensitive, isocratic reversed phase high performance liquid chromatography (RP-HPLC) was developed for the determination of efavirenz in the bulk drug and tablet dosage forms. Elution medium consisting of a mixture of methanol and water in the ratio of (89:11, v/v) at flow rate 1ml/min was employed in this study. The retention time of efavirenz was found 2.58 min. The calibration curves were linear with regression coefficient (r2) of 0.9999. The proposed method was extensively validated for linearity, range, accuracy, precision and specificity. The proposed method is sensitive, specific and was successfully applied for the estimation of efavirenz in pharmaceutical formulations (bulk drug and tablet).
Key Words:Efavirenz, Validation, RP-HPLC
INTRODUCTION
Efavirenz, (4S)-6-chloro-4-(cyclopropylethynyl)-1,4-dihydro-4-(trifluoromethyl)-2H-3, 1-benzoxazin-2-one, is a non-nucleoside reverse transcriptase (RT) inhibitor of human immunodeficiency virus type 1 (HIV-1). 1-2. Efavirenz activity is mediated predominantly by non-competitive inhibition of HIV-1 RT. HIV-2 RT and human cellular DNA polymerases alpha, beta, gamma, and delta are not inhibited by efavirenz. 3.
The literature survey reveals that there are analytical methods available for determination of efavirenz from biological matrices4-8 bulk drug, and dosage forms 9,10 and Several HPLC methods have been described for the simultaneous determination of efavirenz with some other antiretroviral drugs in biological samples and pharmaceutical dosage forms11-13 and some methods need liquid-liquid extraction of the sample before injection14. These are time consuming and cost effective. Literature survey reveals that there is no report has been published so far for analysis of Efavirenz both in pharmaceutical formulations.
Keeping this point into consideration, an attempt was made to develop simple, sensitive and validated RP-HPLC method for the detection of Efavirenz in bulk drug.
MATERIALS AND METHODS
Efavirenz reference standard was obtained as gift sample from Cipla Pharmaceutical Ltd. Mumbai, India. HPLC grade methanol was purchased from S.D. Fine Chemicals Ltd. Mumbai, India. HPLC grade water was procured from Merck Ltd. Mumbai, India. All the other chemicals and reagents used were of analytical grade and were purchased from S.D. Fine Chemicals Ltd. Mumbai, India.
Method Development: Various ratios of methanol and water
were tried for the development of suitable HPLC method for the detection of efavirenz in the pharmaceutical formulation. The suitability of solvent ratio was decided on the basis of area of peak, sharpness of peak, capacity factor and retention time.
Stock and Standard Solutions: A stock solution of efavienz
(200μg/ml) was prepared by dissolving 100 mg drug in 100ml of methanol, further 2ml of this solution was transferred to 10ml volumetric flask and volume was made
up to 10ml with mobile phase to obtain 200μg/ ml concentrations.
Different aliquots of the standard stock solution of efavirenz were transferred into 10ml volumetric flasks separately and the solutions were made up to 10ml with mobile phase to yield a concentration range from 25 to 100 μg/ml-1.The stock solution was passed through a 0.2μ membrane filter.
Selection of Analytical Wavelength: It is achieved by
dilution of standard stock solution with mobile phase; various concentration of efavirenz was prepared accurately. The solutions were scanned between the wavelength ranges of 400 nm to 200 nm using the double beam UV-Vis. spectrophotometer (Shimadzu-1700, Japan) in the spectrum analysis.
Instrumentation: LC-20AT pump, variable wavelength
programmable UV-Visible detector, Luna 5μ C-18 RP-HPLC column (250 x 4.6mm, 5 μm), Hamilton injector fitted with a 20μL loop, degasser and data processor all from Shimadzu, Kyoto, Japan. Spinchrom software was used to record and evaluate the data collected during and following chromatographic analysis.
Method Development: The prepared stock solutions were
injected serially in reverse order and area under the peaks was calculated for each dilution. The method was validated for various parameters such as linearity, accuracy, precision and specificity, limit of detection (LOD), limit of quantification (LOQ) and ruggedness.
Linearity: Appropriate aliquots of drug were pipette out
from the standard stock solution into a series of 10ml volumetric flasks. The volume was made up to the mark with mobile phase to obtain concentration levels of efavirenz ranging from 25-200 μg/ ml. Triplicate dilutions of each concentration of drug were prepared separately and chromatographed under the optimized conditions. Analysis of drug was performed with the UV detector set at 284nm and peak area was recorded. The graph was plotted between concentration and area under peak for linearity.
Accuracy: The study was carried out at three different
Brajendra singh Rajpoot IRJP 2012, 3 (7)
Page 298 volumetric flasks respectively. Volume was then made up to
10ml with mobile phase to get the resultant concentrations of 30, 40 and 50 μg/ml respectively and subjected them to the proposed HPLC method. The experiments were performed in triplicate. The recovery of sample and %RSD were calculated at each concentration level.
Precision: Precision was studied to find out intra-day and
inter-day variation in the HPLC method at three different concentration levels (i.e. 10, 15 and 20 μg/ml) in triplicate. The %RSD was calculated at each concentration level.
Specificity: The specificity of the method was determined by
exposing a solution (10 μg/ml) of the sample to acidic (0.1M HCl), basic (0.1M NaOH) and oxidizing (3% H2O2) stress
conditions. The resulting solutions were then analyzed and the analyte peak was evaluated for peak purity and for resolution from the nearest eluting peak.
Limit of Detection (LOD) and Limit of Quantification
(LOQ): Detection and quantification limits were calculated
by the method based on standard deviation (Sy/x) of the responses for the blank injection in triplicate and the slope (S) of the calibration curve. The peak area of the blank was calculated. The LOD and LOQ were determined using slope of the calibration curve and standard deviation of the blank sample by following formula:
LOD = 3.3×Sy/x/S LOQ = 10×Sy/x/S
Here Sy/x is the standard deviation of the blank response and S is the slope of the calibration curve.
Ruggedness:
The ruggedness of the method was assessed by comparison of the intra-day and inter-day assay results of efavirenz that have been performed by two analysts in the same laboratory.
RESULTS
Development of Mobile Phase: The selection of the solvent
was based on the basis of area of peak, sharpness of peak, capacity factor and retention time. A mobile phase consisting of methanol and water in the ratio of 89:11, v/v was optimized at a flow rate of 1.0ml/min for further studies after several preliminary investigatory chromatographic runs.
Optimized Chromatographic Condition: Chromatographic
separation was achieved using a C-18 column (250×4.6mm) which was packed with 5μ particles with mobile phase consisting of methanol and water in the ratio of 89:11.The column oven was set at a temperature of 25±0.5oC and the mobile phase was filtered, degassed and pumped at a flow rate of 1.0ml/min with back pressure of 270±4kgf/cm2. The injection volume was 20 μl and the total run time of each sample was 10min. The base line was continuously monitored during the process.
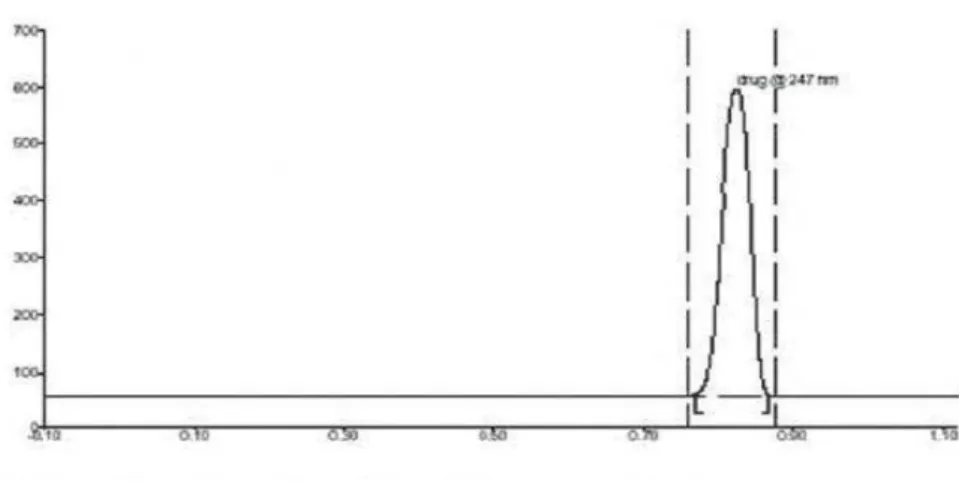
The λmax of efavirenz was found to be 274nm, which was selected as the analytical wavelength for further analysis. Under the described experimental conditions, all peaks were sharp, well defined, reproducible and free from tailing.
Calibration Curve: The calibration curve was plotted
between concentration and peak area and it was found to be linear over the concentration range of 25-200 μg/ml with regression coefficient (r2) 0.9996±0.0011. Statistical calculations were done at 5% level of significance. The retention time and asymmetry factor were found to be 3.14±0.01min and 1.01±0.02 respectively.
Linearity: The linearity was calculated by least squares
linear regression analysis of calibration curve (Table 1). The constructed calibration curve was linear over the concentration range of 25-200 μg ml-1 (n=3). The linear
regression equation was Y=15.65X+3.193 with regression coefficient 0.9999±0.0013. The mean value of slope and intercept were 15.65±0.02 and 3.19±0.01 respectively with standard error of slope and intercept 0.0926±0.001 and 9.425±0.023 respectively.
Accuracy: The proposed method affords recovery of 97.96 to
100.35%. The values of %recovery and %RSD are shown in (Table 2), in each case all the values for %RSD were found to be less which indicates the accuracy of the proposed method.
Precision: Precision of the proposed method was tested by
performing intra-day and inter-day studies. The precision data is summarized in Table 3. For intra-day studies, triplicate of prepared samples were analyzed within same day. For inter-day validation, concentrations were determined on three separate days. Low value of (<2%) of %RSD indicates the repeatability of the proposed method.
Limit of Detection (LOD) and Limit of Quantification
(LOQ): The limit of detection (LOD) and limit of
quantification (LOQ) of the method were determined by standard deviation method. The LOD and LOQ were found to be 3.178μg.ml-1 and 9.619μg.ml-1respectively.
Ruggedness: There was no significant change in the mean
area by comparison of the intra-day and indicating that the proposed method is highly sensitive (Table 4).
Specificity: The specificity of the method was determined by
exposing a solution of efavirenz to stress conditions, i.e.0.1M HCl, 0.1M NaOH and 3% H2O2. efavirenz was found to be
more stable under acidic degradation condition rather than under alkali stress conditions.
DISCUSSION:
In the present study, an attempt was made to develop a simple, accurate, selective and sensitive RP-HPLC method of efavirenz in pharmaceutical analysis. RP-18 column (5μm, RP-18 column, 250×4.6 mm i.d.), maintained at ambient temperature (25±2oC) was made for the method development. The method was validated for specificity, accuracy, linearity, precision (interday and intraday), sensitivity, and ruggedness. The peak areas of the drug were reproducible as indicated by the low coefficient of variation.
The sample recoveries in formulation were in good agreement with their respective label claim which suggested non-interference of formulation excipients on the estimation. Also the %RSD for both the tablet analysis and recovery studies was less indicating high degree of precision and accuracy of the proposed method. The results indicated that the method is unaffected by small variation in the chromatographic conditions.
CONCLUSION
A simple, reliable, linear, accurate, sensitive and reproducible RP-HPLC analytical method has been developed and validated. The method does not involve any costly sample extraction procedure. In addition, the reported method can also be used for the routine analysis of bulk drug, tablet dosage forms.
REFERENCES
1- Indian Pharmacopoeia. Vol. 2. Government of India Ministry of Health and Family Welfare. Ghaziabad: The Indian Pharmacopoeia Commission; 2007. pages 1071-72.
2- International Pharmacopoeia Monograph on Efavirenz, World Health Organization. Geneva, Switzerland: The World Health Organization; 2005 3- Adkins JC, Noble S. Efavirenz Drugs 1998:56 pages 1055-64
Brajendra singh Rajpoot IRJP 2012, 3 (7)
Page 299
with post-column photochemical derivatization and fluorescence detection. J Pharm Biomed Anal2002;28 pages 925-34.
5- Villani P, Massimo Pregnolato M, Banfo S, Rettani M, Burroni D, Seminari E, High-Performance Liquid Chromatography Method for Analyzing the Antiretroviral Agent Efavirenz in Human Plasma. Ther Drug Monit 1999;21 pages 346-50.
6- Saras-Nacenta M, López-Púa Y, Lípez-Cortés LF, Mallolas J, Gatell JM, Carné X. Determination of efavirenz in human plasma by high-performance liquid chromatography with ultraviolet detection. J Chromatogr B Biomed Sci Appl. 2001 Nov 5;763(1-2):53-9.
7- Veldkamp AI, Heeswijk RP, Meenhorst PL, Mulder JW, Lange JM, Beijnen JH, Hoetelmans RM. Quantitative determination of efavirenz (DMP 266), a novel non-nucleoside reverse transcriptase inhibitor, in human plasma using isocratic reversed-phase high-performance liquid chromatography with ultraviolet detection.J Chromatogr B Biomed Appl 1999;734 pages 55-61
8- Ribeiro JA, Campos LM, Alves RJ, Lages GP, Pianetti GA. Efavirenz related compounds preparation by hydrolysis procedure: setting reference standards for chromatographic purity analysis. J Pharm Biomed Anal 2007;43 pages 298-303
9- Martin J, Deslandes G, Dailly E, Renaud C, Reliquet V, Raffi F, Jolliet P : A liquid chromatography- tandem mass spectrometry assay for quantification of nevirapine, indinavir, atazanavir, amprenavir, saquinavir, ritonavir, lopinavir, efavirenz, tipranavir, darunavir and maraviroc in the plasma of
patients infected with HIV. J Chromatogr B Analyt Technol Biomed Life Sci 2009, pages 3072-3082,
10- L. Elens, S. Veriter, J.C. Yombi, V. Di Fazio, R. Vanbinst, D. Lison, P. Wallemacq, B. Vandercam and V. Haufroid. Validation and clinical application of (LC-MS/MS) method for the quantitative determination of 10 anti-retrovirals in human peripheral blood mononuclear cells Journal of Chromatography B Volume 877, Issues 20-21, 1 July 2009, Pages 1805-1814
11- N Appala Raju, Shabana Begum Simultaneous RP-HPLC Method for the Estimation of the Emtricitabine , Tenofovir Disoproxil Fumerate and Efavirenz in Tablet Dosage Forms”Structure (2009) Volume: 1, Issue: 4, Pages: 522-525
12- Anita A Mathias, John Hinkle, Mark Menning, James Hui, Sanjeev Kaul, Brian P Kearney Bioequivalence of efavirenz/emtricitabine/tenofovir disoproxil fumarate single-tablet regimen. Journal of Acquired Immune Deficiency Syndromes (2007) Volume: 46, Issue: 2, Pages: 167-173 13- K. Balamuralikrishna, K.Mahendra andB.Syama Sundar .Development and validation of analytical procedure for the simultaneous estimation of efavirenz, lamivudine and zidovudine through new RP-HPLC method. Journal of Pharmacy Research, Vol 4, No 10 (2011)
14- Bahrami G., Mirzaeei S., Kiani A., Mohammadi B. Sensitive high-performance liquid chromatographic quantitation of gabapentin in human serum using liquid-liquid extraction and pre-column derivatization with 9-fluorenylmethyl chloroformate. J. Chromatogr B. 2005; 823 Pages 213-216.
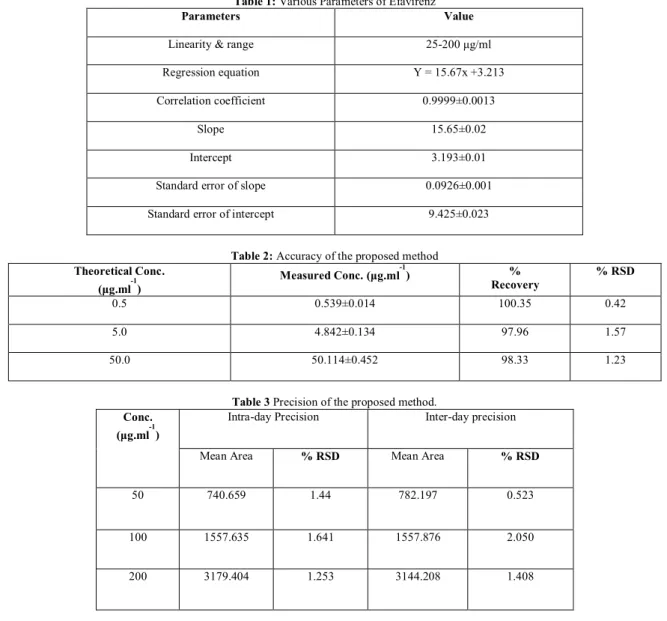
Table 1: Various Parameters of Efavirenz
Parameters Value
Linearity & range 25-200 μg/ml
Regression equation Y = 15.67x +3.213
Correlation coefficient 0.9999±0.0013
Slope 15.65±0.02
Intercept 3.193±0.01
Standard error of slope 0.0926±0.001
Standard error of intercept 9.425±0.023
Table 2: Accuracy of the proposed method
Theoretical Conc. (μg.ml-1)
Measured Conc. (μg.ml-1) % Recovery
% RSD
0.5 0.539±0.014 100.35 0.42
5.0 4.842±0.134 97.96 1.57
50.0 50.114±0.452 98.33 1.23
Table 3 Precision of the proposed method.
Conc. (μg.ml-1)
Intra-day Precision Inter-day precision
Mean Area % RSD Mean Area % RSD
50 740.659 1.44 782.197 0.523
100 1557.635 1.641 1557.876 2.050
Brajendra singh Rajpoot IRJP 2012, 3 (7)
Page 300
Table 4: System Suitability test
Parameters Value
Retention Time 2.58
HETP (mm) 0.009
Tailing factor 10113
LOD (μg.ml-1) 3.178
LOQ(μg.ml-1) 9.619
Figure 1: Chemical Structure of Efavirenz