Article
*e-mail: [email protected]
Structural and Energetic Analysis of Copper Clusters: MD Study of Cu
n(n = 2 - 45)
Mustafa Böyükata*
,aand Jadson C. Belchior
baDepartment of Physics, Bozok University, 66200 Yozgat, Turkey
bDepartamento de Química - ICEx, Universidade Federal de Minas Gerais, Pampulha,
31270-901 Belo Horizonte-MG, Brazil
Simulações usando a dinâmica molecular foram efetuadas, considerando-se um potencial empírico para investigar geometrias, padrões de crescimentos, estabilidades de estruturas e energias para clusters de Cun (n = 2-45). Os clusters estáveis otimizados foram calculados pelo rearranjo via processo de colisão. O presente procedimento apresenta-se como uma alternativa eficiente para a identificação do crescimento de clusters e como uma técnica de otimização. Foi verificado que os clusters de cobre preferem formar estruturas compactas tridimensionais em determinadas configurações enquanto os sistemas de tamanho médio apresentam simetria esférica. Além disso, também foram observadas correlações entre os arranjos atômicos e os números mágicos dos clusters. Particularmente, verificou-se que Cu26 tem uma estabilidade equivalente ao sistema Cu13.
Molecular dynamics simulations, via an empirical potential, have been performed in order to
investigate geometries, growing patterns, structural stabilities, energetics, and magic sizes of copper clusters, Cun (n = 2-45). Possible optimal stable structures of the clusters have been generated through following rearrangement collision of the system in fusion regime. This process serves as an efficient alternative to the growing path identification and the optimization techniques. It has been found that copper clusters prefer to form three-dimensional compact structures in the determined configurations and the appearances of medium sizes are five fold symmetry on the spherical clusters. Moreover, relevant relations between atomic arrangements in the clusters and the magic sizes have been observed. Cu26 may be accepted as another putative magic size like Cu13.
Keywords: copper, cluster, potential energy function, molecular dynamics
Introduction
Clusters are quite different from solid-state materials. They are aggregates of nanoscale size, with an intermediate state of matter between molecules and bulk. They also exhibit a range of unusual physical and chemical properties, such as structural, electronic, and thermodynamic. Metallic clusters have been the subjects of intense research. Due to their broad applications toward biology, catalysis, and nanotechnology, research on clusters has shown considerable development in both experimental and theoretical investigations.1-6 Understanding the intricate connection between the atomic and electronic structures can represent an important preliminary step toward the possible use of metal nanoclusters in future nanotechnological
applications.1-6 In this respect, the changes of cluster
properties as a function of size, such as evolution from small to large clusters, is one of the most interesting issues.6 Systematic structural studies represent the starting point for understanding other general cluster properties. Hence, enormous efforts are devoted to determine the lowest
energy structures of transition metal (TM) clusters.5-10
Unfortunately, determination of equilibrium structures, and of atomic arrangements in TM clusters, still remains as a challenging task. Moreover, any experimental investigation and production of isolated microclusters are extremely difficult.
Computational studies provide helpful atomistic
level simulations by using density functional/ab initio
calculations11-14 or any accurate empirical model potential
energy functions (PEF) with efficient methods.15 For ab
initio calculations, in spite of providing accurate results,
demanding. Usually, the first aim is to obtain the lowest-energy minimum of the PEF using global optimization techniques. Computational simulations for predicting cluster properties have been regarded as powerful tools relative to the experimental difficulties. For example, Genetic Algorithms (GA)16,17 and basin hopping (BH)18-20 have shown to be reasonably accurate and are widely used for inspecting the global minimum of various empirical
PEFs.21 As alternative methods, minima hopping (MH) for
complex molecular systems22 and simulated annealing (SA) for closed-shell systems23 have also been employed. Other methods used as complementary tools can be also proposed
for identifying any global minima of hypersurfaces.24
Moreover, theoretical approaches can supply a set of very simple formulas. There are several proposed empirical PEF’s in literature for various systems25 which can be used for predicting cluster properties.
Copper nanoclusters are interesting and important in the field of Physics and Chemistry of TMs and their alloys due to their useful applications in nanoscopic devices and catalysts. There exist various experimental works for free copper clusters26-29 and density functional/ab initio calculations12,30-35 for copper microclusters. For larger Cu clusters several relevant studies with model PEF have been also reported36-41 in literature. Doye and Wales42 applied Sutton–Chen type potentials to determine the global minimum structures of metal clusters by using a Monte Carlo (MC) minimization approach. Using an empirical PEF Bayyariet al.43 obtained stable structures of Ni, Cu, Pd and
Pt microclusters via Molecular Dynamic (MD) simulations.
The existing literature on Cu clusters has mainly focused on the structural and electronic properties. For example, in a recent work, Grigoryan et al.39 used embedded-atom method
to obtain a detailed description of copper clusters. Erkoç44 has investigated the effect of radiation damage on copper clusters by performing MD simulation using empirical PEF. Such a potential model is applied in the present work for describing the interaction between copper atoms. Erkoç also studied
Cun (n = 3-55) clusters at room temperature (T = 300 K)
with the same pair potential by using a MC technique.40In reference 45 the structural properties of Cu50, Cu100 and Cu150 nanoparticles have been studied by using a modified version of diffusion MC method and by applying an empirical pair potential. The compact spherical shapes for stable structures of these nanoparticles have been reported.
In this paper, computational results are presented for isolated medium size copper clusters containing up to 45 atoms. This work follows a similar approach in regards to
previous work on gold46 clusters. MD simulations have
been performed using an empirical PEF for copper.40,47 The goals of this work are to establish an efficient optimization
method and to further understand the structural implications of this PEF by identifying the characteristic structural motifs associated with the stable minima of copper clusters. In particular, a possible geometrical packing phenomenon was studied for Cu2–Cu45 sizes. In order to predict their structural and energetic properties, rearrangement collision processes6,15,24,48,49 have been applied in the fusion regime. Similar growing up procedure has also been applied for silver clusters.50 The growing of the structures of copper clusters and also the magic numbers were characterized. The magic size indicates that any cluster with a certain size is more stable than its neighboring clusters against dissociation or fragmentation. It was found that the 13- and 26-atom clusters are particularly stable and also there are several other structures that are relatively stable. The rest of this work is organized as follows: next section presents theoretical background and other sections contain analyses of the results and some brief conclusions, respectively.
Computational Background
All calculations have been carried out using classical MD methods for investigating the structures of copper clusters through the Cu+Cun-1 (n a 45) collision. It is possible to compute the total interaction energy of a N-particle system from the sum of suitable effective-pair interactions.25,41,47 The effective-pair PEF used here is40,47
(1)
with the parameters25 A
1= 110.766008, A2=46.1649783,
L1= 2.09045946, L2= 1.49853083, A1= 0.394142248, A2=
0.20722507, D21= 0.436092895, and D22= 0.245082238
for copper. In these parameters, the energy is in eV and the distance is in Å. Erkoç has reviewed various potentials
used in atomistic simulations.25 He reported the present
empirical PEF for FCC metal microclusters of copper, silver and gold.25 In reference 47 it was pointed out that this PEF satisfies the bulk cohesive energy, and the bulk stability condition for Cu element. Moreover, the present
PEF has been used to simulate copper nanowires.51 In the
present work, based on equation (1) the MD was performed and the Runge-Kutta algorithm, of 5th and 6th order, is used as the numerical integration in all calculations. In the trajectory integration, Cartesian coordinates are used for time dependent positions and moments of the particles. All trajectories were checked during the integration to produce energy conservations of the order of 10-10 in step size control of the microcanonical simulations.
atom-cluster collision the initial potential energy of the system is equal to the target Cun-1 cluster energy. While this building-up procedure the colliding atom was sent from an asymptotic region. Formation of the new cluster is expected when the translation energy of the new projectile atom is released to the cluster in order to produce lower energy for the whole new cluster. The initial center of mass motion was kept constant during the interaction and the collision occurs around the center of mass of the system. To avoid fragmentation and scattering, all collisions are performed with low energies to keep particles together in the fusion regime. There is not any typical collision energy value because it can be change depending on sizes, sites, impact parameters, etc. Collision sites on the target cluster are also effective for these regimes. For example, when the colliding atom hits the target cluster on any open sites, it may easily construct a new structure. Moreover, the orientation of the target clusters is randomly represented by Euler angles.52 After the interaction starts, the collision energy of the projectile atom is distributed amongst the kinetic energies of all particles in the system through the rearrangement. The most stable orientation is determined by following each trajectory, set by checking the potential energy of the system at 100 steps up to the end of 2 million steps. The newly generated configuration that has the energy nearest the minima in each trajectory set is kept, and after 104 relaxation steps, it is minimized by removing kinetic energy step by step to determine the corresponding structure at 0 K. That is, the particles are kept under the force generated from the potential through this simple energy minimization procedure. Thermal quenching to reach 0 K means the minimization of the kinetic energy5i.e. the total energy is equal to just the potential energy values. After finding the new cluster, it is used in a new collision and this procedure is repeated in order to find new larger clusters. This procedure is repeated for randomly selected orientations of five initial configurations. As in our previous
work46,49 this methodology was applied to investigate the
structures and the possible growing mechanism.
Results and Discussions
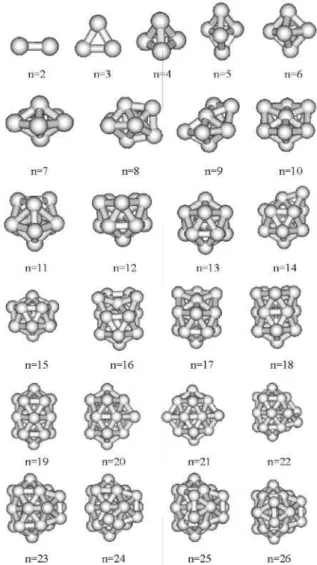
Optimized possible stable structures of copper clusters up to 45 atoms are presented in Figures 1 and 2. Most of the structures are similar to previously reported geometries of LJ clusters.53,54 The structures of small clusters up to
Cu26 are displayed in Figure 1. The well-known primitive
geometries for 2-, 3- and 4-atom clusters are small enough to allow possible minima to be constructed directly. A
regular tetrahedron is the most stable geometry of Cu4
withinTd symmetry. Its bond length and binding energy
values have been calculated as 2.52 Å and 0.87 eV/atom, respectively. Such findings are found in similar studies
using different empirical potentials. Grigoryan et al.39
reported the same symmetry for Cu4 via model potentials,
an embedded atom-method (EAM) study. If one takes a DFT computations, such as Li et al.,55 one finds linear
for Cu3 and planar structures for Cu4 and Cu5. In the present work, a trigonal, an octahedron, and a pentagonal bipyramids are predicted as ground state structures for Cu5 (D3h), Cu6 (Oh) and Cu7 (D5h) clusters with 1.06, 1.26 and 1.38 eV/atom binding energies, respectively. In previous studies,40 Erkoç and Shaltaf generated Cu clusters by using MC computation.
The structures, found here by using rearrangement collisions of clusters, are in agreement with their results40 and also the results in reference 39. In this building-up
procedure, from Cu9 to Cu12 clusters, the ground state
geometries are in a growing pattern based on icosahedrons packing through filling the triangular open sites of 7-atom
copper structure. In this work the determined geometry of Cu11 is slightly different than that one reported in reference 40 in spite of the common potential. Here Cu11 prefers to go in more close packing structure based on MD optimization. The second pentagonal ring is observed in the incomplete
icosahedron form of Cu12. The obtained putative stable
structure for the Cu13cluster is in spherical icosahedron
form, having Ih symmetry. A five-fold ring is a common
backbone leading to a nearly perfect icosahedrons form of 13-atom cluster. In this work, the ground state structures
for Cu14-Cu19 clusters mainly follow an icosahedric
growth pattern based on the geometry of Cu13. However,
determined structures for Cu15 and Cu19 are different than those in reference 40, in spite of having the same potential.
The geometry found for Cu19 is the double icosahedrons
structure (D
5h), another well-known magic size. The clusters
possess the tendency to form trigonal pseudospherical
polyhedra. Cu20 grows by adding an atom to the most
open hollow sites on the equatorial part of Cu19 and filling
another hollow site will bring about the Cu21 geometry.
In a similar way, up to Cu25 the clusters prefer to grow
from the low coordination and more reactive sites on the equatorial region. A similar behavior was also observed in
other studies of gold clusters as described in references 46
and 56. Cu26 has an interesting view of crossed shape of
19-atom geometry. These structures are often based on the double icosahedrons geometry, with the additional atoms attached to various positions on 19-atom cluster as observed for titanium, vanadium and chromium clusters.6 Increasing the number of atoms on the surface of the cluster leads to some structural distortions of the basic building elements. This behavior was also verified in the previous studies of gold46 and iron49 clusters. As cluster size increases further, it becomes increasingly difficult to visualize the growth pattern. For microstructures consisting of a few atoms, it is easy to get a new structure by binding over a favorable open site. However, the new geometry for larger clusters may go in different local isomers of the new configuration. This is due to their dislocated structures and high symmetries.46
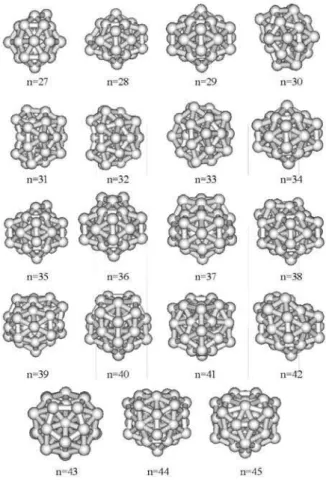
Most of the clusters, in general, might have various local minima corresponding to the absolute minimum energy of the PEF of a many-particle system. Metal clusters are extremely floppy, usually leading to numerous minima in the potential hypersurfaces. The considerable adsorption regions are atop, bridge, and hollow sites on cluster surfaces. From rearrangement structures, computationally it takes a long computational time to obtain the stable geometry of the clusters, unless the colliding atom hits the target at a suitable site. Therefore, the target position was randomly changed in order to improve the efficiency of the collision process. The cluster formation mechanism can be analyzed by investigating their preference for a growing pattern. As presented in Figure 2, from Cu27 up to Cu45 clusters, atoms prefer to fill favorable hollow sites (the most favorable adsorption site) on the target clusters. It is observed here that the new optimized structure grows from the hollow site of the previous smaller cluster. All configurations led to the migration of the colliding atom from the on-top or bridge sites to the hollow sites. Due to their reactivity, the adsorbing atoms were generally introduced onto low coordination copper atoms. As a consequence of this pattern, filling the hollow and more reactive sites, all low
coordination points on the equatorial region of Cu19 are
covered one by one. Finally, a closed shell structure of Cu34 is formed with 3 new five-atom rings, as can be observed in Figure 2. The structural evolution of the Cu35 cluster in this formation pattern is demonstrated in the form of
placing an atom on more reactive hollow site of the Cu34
geometry. As a result, the new larger sizes will continue by filling the open sites of the surface of 34-atom cluster, such as the growing pattern of Cu36 and larger clusters. With the
increasing number of atoms the skeletal structure of Cu34
gains stability and loses their original form inside of the larger clusters. The smaller sizes of the determined possible
global minima have centered icosahedral morphologies. Octahedral, decahedral, and icosahedral morphologies have also been observed for the predicted low-lying structures, due to the increasing size. Larger sizes, up to Cu45, lead to more reactive, favorable hollow sites on the surface of clusters. Therefore, it becomes more complicated to determine the most stable structures. The DFT results57-59 indicate that the sequence form sizes 34 to 45 atoms for copper clusters proceeds from the polyicosahedron of 34 atoms towards the anti-Mackay icosahedron of 45 atoms as determined the same structure in the present work. This common behaviour with DFT results indicates that the two-body potential used here can be considered as a reasonable PEF approach for this kind of analysis.
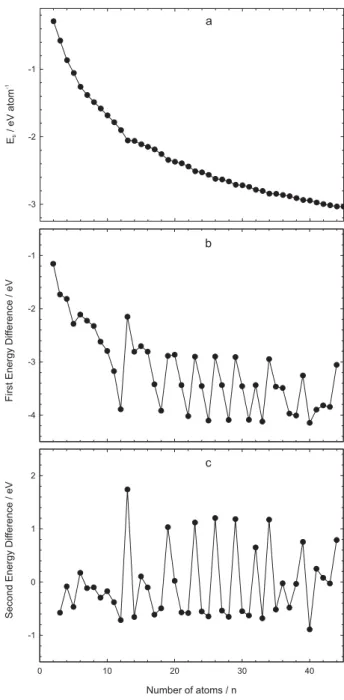
The calculated total energy values (Etot) for Cu2-Cu45 clusters are given in Table 1. The binding energies, the average interaction energy per atom in the cluster, versus the
cluster size are plotted for the putative stable structures in Figure 3a. The decaying trend of the average binding energy with respect to the cluster size is an expected behavior for almost all metal clusters.60
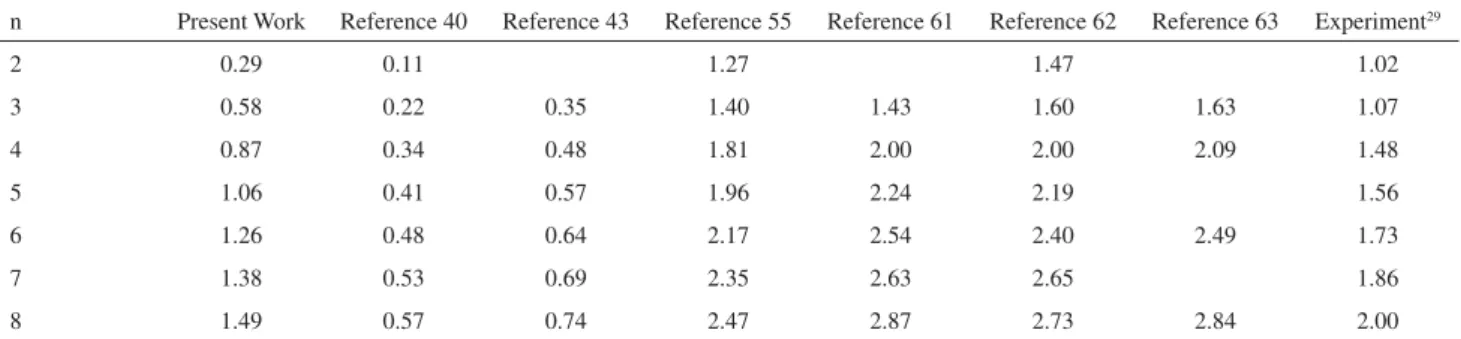
As compared in Table 2, the calculated binding energies are, in magnitute, higher than the reported results in reference 40 and also closer to the experimental findings.29 The present results are also closer to the other theoretical results.55,61-63 The average binding energy per atom in the cluster may be, therefore, expressed as a function of the cluster size,64-66
(2)
where the coefficients Ev, Es, and Ec correspond to the volume, surface, and curvature energies of the particles forming the cluster, respectively, and Ee defines the energy origin.67 Fitting the data according to equation (2) gives
5.82, 11.45, 5.64 and 6.6r 10-5 eV/atom, respectively. In reference 40 this fit has been done with 3-terms for three parameters, Ev=1.736, Es= 2.727 and Ec = 0.835 eV/atom.
The experimental bulk cohesive energy is –3.49 eV/atom68
corresponding to calculated volume energy values. The differences between calculated and experimental values are 1.76 eV/atom in reference 40 and 2.33 eV/atom in the present calculation. However, the value determined here by our fitting procedure seems to converge to the experimental value faster than the previous work.40 That is, the corresponding size of the cluster for the experimental value here is about Cu73 for equation (2) but it is in the
limit of nlc in reference 40. Accordingly, the level-off
value of binding energy here is 3.03 eV/atom for Cu45 but
in that work40 it is 1.06 eV/atom for Cu
55, far from the bulk cohesive value. A central issue in cluster physics is
to identify particularly stable sizes. A detailed structural picture and the nonmonotonic variation in the cluster properties can be obtained by locating the global minimum as a function of size. Therefore, this can give information regarding the provided abundances of particularly stable clusters.52 Figures 3b and 3c show the first energy difference and the second finite difference (the stability function) of the total energy of the determined clusters
(3)
(4)
Figure 3. a) binding energies b) first and c) second finite difference of
as a function of the number of atoms, respectively. The peaks observed in Figure 3c correspond to the most stable structures (magic clusters) and the minima show the least stable sizes. Although it is known that the theoretical results of cluster stabilities are determined by the $2E, this term has been assigned in the literature14,15,19,39,46,49,67 as equivalent to the term of magic clusters as also indicated, for example, in references 6 and 40. In the actual work the same term is therefore used but one should remember that the correct is the second difference of the cohesive energy. The
appearance of magic numbers for enhanced stability of the clusters and the fact that the clusters tend to form in spatial arrangements. The following magic numbers are observed: 13, 19, 23, 26, 29, 32, 34 and 39. The corresponding sizes for the least stable clusters are: 12, 14, 17, 22, 25, 28, 31, 33, and 40. In reference 48, the determined peaks based on LJ potential are at n= 13, 19, 23, 26, 29, 32, 36, 39 and
43. However, Erkoç and Shaltaf40 generated 13, 20, 24, 26, 29, 34, 38, 40 and 45-atom clusters corresponding to these
more stable structures. On the other hand, Grigoryan et
al.39 pointed out 13, 19, 23, and 28 sizes particularly stable with EAM. Further calculations and alternative analysis with more accurate methods may be helpful in identifying more magic clusters.
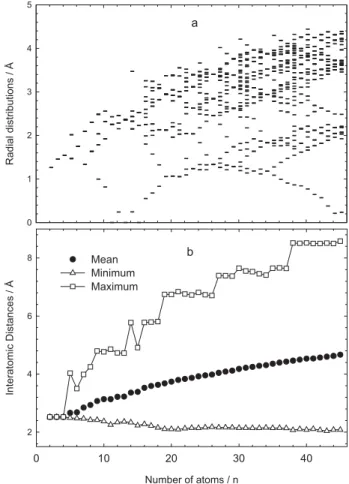
In order to obtain further insight regarding the size dependence of structural growth and to make the magic sizes more deterministic, distributions of the atoms in their determined stable geometries have been investigated (Figure 4). Firstly, the radial distributions of the atoms are analyzed, which are displayed in Figure 4a. The radial distribution is the distance of each atom with respect to the center of mass of a Cuncluster and it is given by,
(5)
in which Riis the position of the ith atom. In the upper panel
of Figure 4, all these distances are shown as a function of the cluster size. One aspect in the resulting diagram is the increasing radius of the clusters with increasing size. The largest distance to the origin (assumed as radius of the cluster) is increasing continuously with the increasing number of atoms. Some irregularities occur and in those cases the cluster radius decreases slightly by adding an atom e.g., the radius of Cu5 is larger than Cu6, and Cu10 has a larger radius than those of its larger neighbors Cu11
and Cu12. The maxima in the largest distances correspond
to the more reactive sizes. For example, the capped
icosahedron form of Cu14, has more reactive sites due to
the low coordination of the system. In particular, the trends
Table 1. The calculated total energy values (Etot) for Cun (n = 2-45)
clusters
n Etot(eV) n Etot(eV)
2 −0.577 24 −60.635
3 −1.732 25 −64.089
4 −3.465 26 −68.192
5 −5.281 27 −71.092
6 −7.566 28 −74.531
7 −9.676 29 −78.623
8 −11.902 30 −81.533
9 −14.228 31 −84.991
10 −16.848 32 −89.080
11 −19.643 33 −92.519
12 −22.818 34 −96.641
13 −26.710 35 −99.589
14 −28.861 36 −103.055
15 −31.670 37 −106.545
16 −34.375 38 −110.518
17 −37.183 39 −114.527
18 −40.605 40 −117.783
19 −44.523 41 −121.930
20 −47.410 42 −125.828
21 −50.275 43 −129.646
22 −53.713 44 −133.490
23 −57.734 45 −136.545
Table 2. Comparision of the calculated binding energies (eV/atom) with previous available theoretical and experimental values for Cun (n = 2-8) clusters
n Present Work Reference 40 Reference 43 Reference 55 Reference 61 Reference 62 Reference 63 Experiment29
2 0.29 0.11 1.27 1.47 1.02
3 0.58 0.22 0.35 1.40 1.43 1.60 1.63 1.07
4 0.87 0.34 0.48 1.81 2.00 2.00 2.09 1.48
5 1.06 0.41 0.57 1.96 2.24 2.19 1.56
6 1.26 0.48 0.64 2.17 2.54 2.40 2.49 1.73
7 1.38 0.53 0.69 2.35 2.63 2.65 1.86
of the radial distribution of the clusters (largest distances) have lower values identifying obviously for determined magic sizes. In most cases, this decrease is consistent with a reorganization of the system and an increase of the number of symmetry elements. In reference 69 Joswig and Springborg have noticed similar characteristics in aluminum clusters. Another aspect of the radial distribution analysis is that increasing the number of atoms per cluster leads to various different distances. It means that these clusters have lower symmetries than those with only a few different distances to the origin as stated in reference 69. A similar plot of the radial distribution for copper cluster was also observed in reference 39. It is also possible to identify more atomic shells using the radial distribution function. The second shell of atoms is already established from Cu13, but for the smallest systems the inner shell contains just a single atom, which is placed very close to the center of the cluster. The microclusters up to the 13-atom cluster grow
via the pushing of an atom to the center of the cluster. Cu4
and Cu6 have similar behavior since they are in regular
tetrahedron and octahedron structures, respectively. In other words, all atoms are the same distance from the center. For magic sizes, the number of atoms of the inner shell can be easily observed due to their higher symmetric structures.
For example, Cu19 and Cu26 have mainly four distances.
There is a dominant deviation of the central atom from Cu12 to Cu26 clusters. It reaches the biggest value in this medium size region. Cu26 is the turning point for the central atom because the growing structure at this point has half filled equatorial sites of the Cu19 cluster. Even though the closest and the largest distances have absolutely different properties, the mean displacements from the center of mass of the clusters are, as expected, slightly increasing due to the close packing phenomena. These results have also been observed in gold clusters.46
In Figure 4b, mean, minimum, and maximum values of the interatomic distances (pair displacement distributions) are demonstrated for Cu2–Cu45 clusters as a function of the number of atoms. Maximum, minimum, and mean pair distances of atoms are the same, 2.52 Å, for the 4-atom cluster, due to its regular pyramidal geometry. The minimum pair distances decrease slightly while the mean pair distance increases with the increasing number of atoms. This is because the increase in the number of atoms leads to close packing of the system. When it reaches up to 45-atoms the mean and minimum values become 4.67 Å and 2.08 Å, respectively. On the other hand, the maximum pair distances have different trends in different size ranges. Structurally, different reorientations cause sudden increases and fluctuations in the maximum pair distances. For example, up to Cu8 all structures are in different orientations. From
Cu8 to Cu13 the icosahedrons packing based growing pattern based on pentagonal bipyramid structure of Cu7 results in decrease for maximum pair distances. An addition of an atom to the triangular open sites of Cu13 suddenly leads to a new increase in the maximum pair distance for Cu14, while the spherical structures of Cu15, with 6-atom rings, leads to
a decrease in the maximum pair distance. Up to Cu19, the
growing pattern is based on 13-atom geometry. The distance between two polar atoms of 19-atom cluster is the source of
the rapid increase in the maximum pair distance from Cu18
to Cu19. From Cu19 up to Cu26 one observes a slight decrease in the maximum pair distances. For the particular case of Cu26 there is an interesting symmetric form, crossing shape of the two 19-atom clusters. After passing the Cu26 structure there is a rapid increase in the maximum pair distance due
to the new nonsymmetrical form of Cu27. There are slight
fluctuations in regions 27-38 but no significant change in 37-45. In general, any changes are typically determined around the magic sizes.
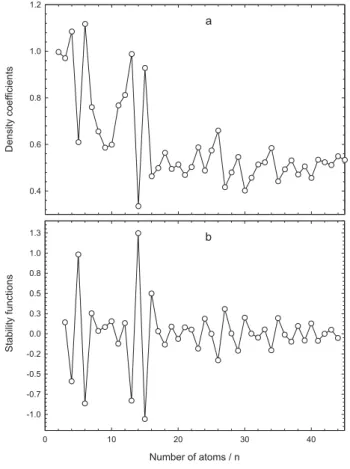
Another alternative analysis used to investigate the growth mechanism in more detail was the calculation of density coefficients for number of atoms per volume
Figure 4. a) radial distributions and b) interatomic distances of atoms for
based on the work in reference 42. For each cluster one can write
(6)
that defines the proportionality relation for the cluster density, where n is the number of atoms and rn is the radius
of the cluster corresponding to the largest value of the radial distributions in Figure 4a. Figures 5a and 5b illustrate the density coefficients and their stability functions i.e. the
second finite difference of the calculated coefficients. Large fluctuations occur in the microcluster region. This means that they are reoriented through the changing of all atom positions. This fluctuation is smaller for medium size clusters because for larger clusters the orientation of the new clusters after rearrangement collision occurs on the surface atoms of the clusters. Inner structures of these clusters generally keep their previous geometries. The minima in the stability functions visually seem more symmetrical for close packing sizes, such as 4, 6, 13, 15, 23, 26, 29, and 34. There is an interesting result for Cu15 that looks structurally like a magic size cluster, but it is not energetically favorable to form magic size cluster. This implies that spherical structures may not be energetically
magic. In a similar way, Guo et al.70 showed that a cluster with high symmetry is not always more stable than that with a lower symmetry.
Additionally, the moment of inertia (MoI) for these particular Cu2-Cu45 clusters is analyzed in a similar way with regards to reference 71. The calculated results are presented in Figure 6. The values (Ix, Iy, Iz) of MoI with respect to the three components of the Cartesian coordinates are plotted as functions of the cluster size in Figure 6a. They have been calculated assuming the mass of the particles to be a normalized unit mass of 1. Therefore the units depend on the distance of the atoms in the clusters from the center of mass of the clusters. The equal values of three MoI show that cluster is in a spherical structure. As observed from the figure, the sizes n = 4, 6, 13 and 26 are spherical geometries.
Second finite difference of the total MoI values are given in the stability graphs in Figure 6b.
The maxima in this figure demonstrate the relatively more spherical copper structures. The cluster sizes 13, 15, 23, 26, 29, 34 and 41 have magic size characteristics. Finally, mean values of the component dependent differences of MoI have been calculated by using absolute values of Ix-Iy, Iy-Iz and Iz-Ix. As presented in Figure 7, Cu4,
Figure 5. a) density coefficients and b) their stability values.
Figure 6. a) the moment of inertia (MoI) with respect to x, y and z
Cu6, Cu13 and Cu26 are exactly in spherically symmetric geometries.
Conclusions
In this paper a rearrangement collision procedure has been systematically performed to find likely global
minima for the free Cun clusters, in the size range of
n = 2−45. These studies were based on the PEF proposed
by the Erkoç.40,47 It has been shown, by using MD and
energy minimization techniques, that copper clusters prefer to form three-dimensional compact structures and the five-fold symmetry appears on the spherical clusters. Particularly, all structural and energetic results show that the Cu26 cluster has relatively more stable and spherical features. Therefore, it may be assumed to be another well-known putative magic size. Additionally, high symmetry clusters are not always more stable than those with lower symmetries. As a result, the PEF can be used for qualitative structural analysis of medium size clusters such as for determinations of magic sizes. The rearrangement collision approach may be used as an alternative procedure for the investigation of possible structures of atomic clusters. The procedure can easily be applied to other cluster systems with different interatomic PEFs. In addition, the selected calculations of moment of inertia, radial, pair, and density coefficient distributions can be considered as efficient tools for structural analysis.
Acknowledgments
This work was supported by Research Fund of Erciyes University in Turkey (Project Number: FBA.06.07) and by CNPq and FAPEMIG in Brazil. We would like to thank Dr. Jim Chelikowsky and Dr. Shen Li for supplying data.
Böyükata would like to thank Daniel Seaton for his critical reading. We also would like to thank unknown refrees whose comments helped us to improve the paper.
References
1. Haberland, H., ed. In Clusters of Atoms and Molecules;
Springer: Berlin, 1995.
2. de Heer, W. A.; Rev. Mod. Phys.1993,65, 612.
3. Gao, Y.; Zeng, X. C.; J. Am. Chem. Soc.2005,127, 3698.
4. Baletto, F.; Ferrando, R.; Rev. Mod. Phys.2005,77, 371.
5. Böyükata, M.; Güvenç, Z. B.; Braz. J. Phys.2006,36, 720.
6. Böyükata, M.; J. Theo. Comp. Chem.2007,6, 81.
7. Böyükata, M.; Karabacak, M.; Özçelik, S.; Güvenç, Z. B.; Jellinek, J.; Bulgarian J. Phys.2000,27, 110.
8. Böyükata, M.; Güvenç, Z. B.; Özçelik, S.; Durmus, P.; Jellinek, J.;Int. J. Quantum Chem.2001,84, 208.
9. Yıldırım, E. K.; Atıs, M.; Güvenç, Z. B.; Phys. Scripta2007,
75, 111.
10. Özçelik, S; Güvenç, Z. B.; Surf. Sci.2003,532, 312.
11. Chang, C. M.; Chou, M. Y.; Phys. Rev. Lett. 2004, 93,
133401.
12. Calaminici, P.; Koster, A. M.; Salahub, D. R.; J. Chem. Phys.
1996,105, 9546.
13. Aprà, E.; Ferrando, R.; Fortunelli, A.; Phys. Rev. B2006,73,
205414.
14. Böyükata, M.; Özdogan, C.; Güvenç, Z. B.; J. Mol. Struc. (THEOCHEM)2007,805, 91.
15. Böyükata, M.; Borges, E.; Belchior, J. C.; Braga, J. P.; Can. J. Chem.2007,85, 47.
16. Rossi, G.; Ferrando, R.; Rapallo, A.; Fortunelli, A.; Curley, B. C.; Lloyd, L. D.; Johnston, R. L.; J. Chem. Phys.2005,122,
194309.
17. Hartke, B.; Struct. Bond. 2004,110, 33.
18. Wales, D.; Doye, J.; J. Phys. Chem. A2004,101, 5111. 19. Sebetçi, A.; Güvenç, Z. B.; Model. Simul. Mater. Sci. Eng. 2005,
13, 683.
20. Doye, J.; Wales, D.; Miller, M.; J. Chem. Phys. 1998, 109,
8143.
21. Yoo, S.; Zeng, X.; J. Chem. Phys.2003,119, 1442.
22. Goedecker, S.; J. Chem. Phys.2004,120, 9911.
23. de Andrade, M. D.; Mundim, K. C.; Malbouisson, L. A. C.; Int. J. Quantum Chem.2005,103, 493.
24. Solov`yov, I. A.; Solov`yov, A. V.; Greiner, W.; Int. J. Mod. Phys. E2004,13, 697.
25. Erkoç, S.; Physics Reports 1997,278, 79.
26. Cheshnovsky, O.; Taylor, K. J.; Conceicao, J.; Smalley, R. E.;
Phys. Rev. Lett.1990,64, 1785.
27. Chen, S; Sommers, J. M.; J. Phys. Chem. B 2001,105, 8816. 28. Häkkinen, H.; Moseler, M.; Kostko, O.; Morgner, N.; Hoffmann,
M. A.; Issendorff, B.; Phys. Rev. Lett.2004,93, 093401.
29. Spasov, V. A.; Lee, T. H.; Ervin, K. M.; J. Chem. Phys.2000,
112, 1713.
30. Massobrio, C.; Pasquarello, A.; Dal Corso, A.; J. Chem. Phys.
1998,109, 6626.
31. Kabir, M.; Mookerjee, A.; Datta, R.; Banerjea, A.; Bhattacharya, A. K.; Int. J. Mod. Phys. B2003,17, 10.
32. Häkkinen, H.; Moseler, M.; Landman, U.; Phys. Rev. Lett.2002,
89, 033401.
33. Olviedo, J.; Palmer, R. E.; J. Chem. Phys.2002,117, 9548.
34. Jaque, P.; Toro-Labbe, A.; J. Chem. Phys.2002,117, 3208.
35. Jaque, P.; Toro-Labbe, A.; J. Phys. Chem. B2004,108, 2568.
36. Darby, S.; Mortimer-Jones, T. V.; Johnston, R. L.; Roberts, C.;
J. Chem. Phys.2002,116, 1536.
37. Zhurkin, E. E.; Hou, M.; J. Phys.: Condens. Matter 2000,12,
6735.
38. Zhang, T.; Wu, A. -L.; Guan, L.; Qi, Y. -H.; Chin. J. Chem.
2004,22, 148.
39. Grigoryan, V. G.; Alamanova, D.; Springborg, M.; Phys. Rev. B2006,73, 115415.
40. Erkoç, S.; Shaltaf, R.; Phys. Rev. A1999,60, 3053.
41. Özdogan, C.; Erkoç, S.; Z. Phys. D1997,41, 205.
42. Doye, J. P. K.; Wales, D. J.; New J. Chem.1998,22, 733.
43. Bayyari, Z.; Oymak, H.; Kökten, H.; Int. J. Mod. Phys. C2004,
15, 917.
44. Erkoç, S.; Int. J. Mod. Phys. C2000,11, 1025.
45. Dugan, N.; Erkoç, S.; Int. J. Mod. Phys. C2006,17, 1171.
46. Böyükata, M.; Physica E2006,33, 182.
47. Erkoç, S.; Z. Phys. D 1994,32, 257.
48. Rogan, J.; Ramirez, R.; Romero, A. H.; Kiwi, M.; Eur. Phys. J., D2004,28, 219.
49. Böyükata, M.; Borges, E.; Braga, J. P.; Belchior, J. C.; J. Alloys Compd.2005,403, 349.
50. Baletto, F.; Mottet, C.; Ferrando, R.; Phys. Rev. Lett. 2000,84,
5544.
51. Mehrez, H.; Çıracı, S.; Fong, C. Y.; Erkoç, S.; J. Phys.: Condens. Matter1997,9, 10843.
52. Schmelzer Jr., J.; Brown, S. A.; Wurl, A.; Hyslop, M.; Blaikie, R. J.; Phy. Rev. Lett.2002,88, 226802.
53. Wales, D. J.; Doye, J. P. K.; J. Phys. Chem. A 1997, 101,
5111.
54. Northby, J. A.; J. Chem. Phys.1987,87, 6166.
55. Li, S.; Alemany, M. M. G.; Chelikowsky, J. R.; J. Chem. Phys.
2006,125, 034311.
56. Phala, N. S.; Klatt, G.; van Steen, E.; Chem. Phys. Lett.2004,
395, 33.
57. Rossi, G.; Rapallo, A.; Mottet, C.; Fortunelli, A.; Baletto, F.; Ferrando, R.; Phys. Rev. Lett. 2004,93, 105503.
58. Ferrando, R.; Fortunelli, A.; Rossi, G.; Phys. Rev., B 2005, 72,
085449.
59. Barcaro, G.; Fortunelli, A.; Rossi, G.; Nitta, F.; Ferrando, R.;
J. Phys. Chem., B 2006, 110, 23197.
60. Scoles, G., ed. In The Chemical Physics of Atomic and Molecular Clusters; North-Holland: Amsterdam, 1990.
61. Kabir, M.; Mookerjee, A.; Bhattacharya, A. K.; Phys. Rev. A
2004,69, 043203.
62. Kabir, M.; Mookerjee, A.; Datta, R. P.; Banerjea, A.; Bhattacharya, A. K.; Int. J. Mod. Phys. B2003,17, 2061.
63. Massobrio, C.; Pasquarello, A.; Car, R.; Chem. Phys. Lett.1995,
238, 215.
64. Uppenbrink, J.; Wales, D. J.; J. Chem. Phys.1992,96, 8520.
65. Jortner, J.; Z. Phys. D1992,24, 247.
66. Lordeiro, R. A.; Guimaraes, F. F.; Belchior, J. C.; Johnston, R. L.;Int. J. Quantum Chem. 2003,95, 112.
67. Erkoç, S.; Physica E2000,8, 210.
68. Kittel, C.; Introduction to Solid State Physics, Wiley: New York,
1996.
69. Joswig, J. -O.; Springborg, M.; Phys. Rev., B 2003, 68, 085408.
70. Guo, J.; Shen, J.; Chen, N.; Chem. Phys.2006, 324, 314.
71. Grigoryan, V. G.; Springborg, M.; Chem. Phys. Lett.2003,375,
219.
Received: July 6, 2007