Article
Printed in Brazil - ©2011 Sociedade Brasileira de Química0103 - 5053 $6.00+0.00
A
*e-mail: [email protected]
Chemical and Spectroscopic Characterization of a Vegetable Oil used as Dielectric
Coolant in Distribution Transformers
Neffer A. Gomez,a Rodrigo Abonia,*,a Hector Cadavidb and Ines H. Vargasc
aDepartamento de Química and bGrupo GRALTA, Escuela de Ingeniería Eléctrica,
Universidad del Valle, A. A. 25360 Cali, Colombia
cArea de Ingeniería de Distribución, Empresas Públicas de Medellín (EPM), Carrera 58, N. 42-125,
Piso M, Torre Sur, Medellín, Colombia
Neste trabalho, uma análise espectroscópica completa de UV-Vis, IR e RMN (1H, 13C e DEPT)
foi realizada para uma amostra de óleo vegetal FR3® usada como refrigerante dielétrico em um
transformador de distribuição experimental. A mesma análise espectroscópica foi realizada para três amostras de óleo FR3® (i.e., com 4 meses de uso, 8 meses e 7 anos de uso), removidas de
vários transformadores de distribuição operacional. A comparação entre os dados indicou que não ocorreram mudanças espectroscópicas significativas, e, portanto, não ocorreram mudanças estruturais aos óleos, pelo uso. Transformações químicas como hidrogenação catalítica e hidrólise foram realizadas à amostra de óleo FR3® e os produtos obtidos foram analisados por
métodos espectroscópicos, a fim de recolher mais informações sobre o óleo FR3®. Testes de
envelhecimento acelerado em laboratório também foram realizados para as três amostras de óleo FR3®, proporcionando informações interessantes sobre a estrutura dos produtos de degradação.
Estas informações podem ser valiosas à busca de uma técnica baseada em espectroscopia para monitoramento do tempo de vida e desempenho deste óleo vegetal isolante.
In this work, a complete UV-Vis, IR and (1H, 13C and DEPT) NMR spectroscopic analysis was
performed for a FR3® vegetable oil sample used as dielectric coolant in an experimental distribution
transformer. The same spectroscopic analysis was performed for three used FR3® oil samples (i.e.,
4 months in use, 8 months in use and 7 years in use), removed from several operating distribution transformers. Comparison of the data indicated that no significant spectroscopic changes, and hence, no structural changes occurred to the oils by the use. Chemical transformations like catalytic hydrogenation (hardening) and hydrolysis were performed to the FR3® oil sample and the obtained
products were analyzed by spectroscopic methods in order to collect further structural information about the FR3® oil. Accelerated aging tests in laboratory were also performed for three FR3® oil
samples affording interesting information about the structure of the degradation products. These findings would be valuable to search for a spectroscopy-based technique for monitoring the life-time and performance of this insulating vegetable oil.
Keywords: vegetable oils, dielectric coolants, spectroscopic characterization, thermal aging, distribution transformers
Introduction
The distribution transformers are, nowadays, the most numerous elements in the electrical networks, therefore, any alternative that increases or improves its operation, will improve the electrical service displayed by this equipment.1 The insulation system of nearly all transformers which are presently used in distribution is a combination of dielectric
used in the range of small to medium distribution power transformers.2
Structurally, vegetable oils are mixtures of natural fatty acid esters and are an ideal alternative to replace the commonly used mineral oils due to their naturally occurring and renewable sources, their fast biodegradation rates (reducing environmental risks) and for reducing the burning risk due to their higher fire points than mineral oils.3 Nevertheless, there are still some technical issues that need to be answered before introducing definitively this new dielectric insulating and coolant fluid for distribution transformers, which encourage the scientific community to continue searching for more information about the performance and properties of insulating vegetable oils. The purpose of this work is to evaluate the structural changes between an unused dielectric vegetable oil sample with respect to several used and accelerated aged samples of the same oil by comparing their corresponding UV-Vis, IR and NMR spectra. These finding should afford useful structural information to search for an alternative spectroscopy-based monitoring procedure for distribution transformers using vegetable oils as their dielectric insulation systems.
Experimental
The vegetable dielectric coolant sample (I) studied in this work corresponded to Envirotemp® FR3® from COOPER Power Systems company. Also were studied three used FR3® oil samples corresponding to: (II) 4 months aged FR3® oil sample removed from an experimental distribution transformer installed at EPM (Medellin, Colombia) (1000 kVA 3-phase padmount, 13200-214/123.6 V, average top oil temperature < 65 oC, 80% of rated load), (III) 8 months aged FR3® oil sample removed from an experimental distribution transformer installed at GRALTA (Universidad del Valle, Colombia) (5 kVA single phase, 76220-240/120 V, average top oil temperature 110 oC, 200% of rated load) and (IV) 7 years aged FR3® oil sample removed from a distribution transformer installed in (Brazil) (45 kVA, 11.9-0.22/0.127 kV, average top oil temperature < 65 oC). The solvents and chemicals used (ethanol, ethyl acetate, dichloromethane, chloroform, sodium chloride, sodium hydroxide and anhydrous sodium sulfate) were purchased from Merck, Aldrich, Fluka and Acros (analytical reagent grades) and were used as provided. The UV-Vis spectra were recorded on a Shimadzu UV-1700 spectrophotometer. The IR spectra were recorded on Shimadzu IR Affinity-1 and Nicolet 6700 spectrophotometers. The 1H and 13C NMR spectra were recorded on a Bruker UltraShield spectrophotometer operating at 400 MHz and 100 MHz respectively.
Preparation of samples for UV-Vis analysis
The solutions for UV-Vis analysis were prepared by dissolving 3-5 mg of sample in 5 mL of n-hexane as solvent. Measures were carried out adding 4 mL of solution in 5 mL quartz cuvettes.
Preparation of samples for IR analysis
The samples for IR analysis were applied in form of films (neat) on NaCl cells.
Preparation of samples for RMN analysis
The solutions for NMR analysis were prepared by dissolving 20-22 mg of sample in 0.4 mL of CDCl3 as solvent (in 1 mL NMR tubes), bearing tetramethylsilane as internal standard. The experiments were run at ambient temperature.
Catalytic hydrogenation (hardening) of a FR3® oil sample
Raney-Nickel (0.52 g) was washed with water (2 mL), then with methanol (2 mL) and placed into the reaction vessel of a Parr reactor. Then sample (I) (4.98 g), methanol as solvent (12 mL) and a magnetic stirring bar were added to the reaction vessel. The reactor was hermetically sealed, the hydrogen pipe was opened and the reaction was left stand during 70 h at ambient temperature, at 140 rpm and 2500 KPa. After finish (monitored by IR), the reactor was opened, dichloromethane (20 mL) was added to dissolve the product and to remove the catalyst by filtration. Finally, the solvent was removed by rotary evaporation affording a white solid corresponding to the hydrogenated product (4.94 g, 98% yield respect to trilinoleylglycerol).
Hydrolysis of a FR3® oil sample. Synthesis of the
corresponding free fatty acids
Saponification of a FR3® oil sample. Synthesis of the sodium
soap derivative
Neutralization of a soap sample. Synthesis of free fatty acids from the oil (I)
A sample of sodium soap (1.00 g) was dissolved in distilled water (10 mL), and then aqueous 18% HCl (8 mL) was added dropwise until pH 3-4. The solid formed was filtered under vacuum, washed with distilled water (2 × 3 mL) and dried at ambient temperature affording a white solid corresponding to the free fatty acids mixture (0.88 g, 95% yield).
Transesterification reaction of unused and used FR3® oil
samples. Preparation of biodiesel
The weight of the starting materials was calculated taking as reference the trilinoleylglycerol as it is the main component of the FR3® oil. A mixture of NaOH (6.85 g) and methanol (6.93 mL) was dissolved in a 250 mL Beaker. Then, sample (I) (49.97 g) was added and the solution was stirred at ambient temperature for 7.5 h. After finish, the reaction was left standing during 2 h until formation of two phases. The upper phase corresponding to the biodiesel was isolated by means of a separatory funnel, affording 47.19 g of product (94% isolated yield respect to trilinoleyglycerol). The same procedure was followed for the sample (IV) (30.25 g), yielding 27.96 g of biodiesel (92% isolated yield).
Accelerated aging assays for unused FR3® samples
To carry out this experiment three samples were prepared: (i) Sample A. Oil (I) (100 g) was placed into a 250 mL Beaker and stoppered with a perforated paraffin paper. (ii) Sample B. A mixture of oil (I) (100 g) and de-ionized water (5 g) was placed into a 250 mL Beaker and covered lightly with a round clock glass. (iii) Sample C. A mixture of oil (I) (100 g), de-ionized water (5 g) and Kraft paper (5 g) was placed into a 250 mL Beaker and covered lightly with a round clock glass.
Then, sample A was heated at 110 oC while samples B and C were heated at 90 oC. All samples were heated for a period of 360 h and the progress of the processes was monitored by physical changes and by IR.
Results and Discussion
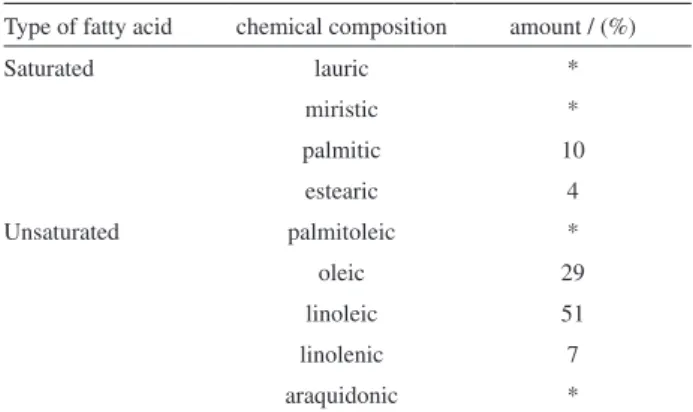
It is known that the natural source of the FR3® dielectric coolant used in this work correspond to soybean seeds.4 According to the literature,5 soybean oil, and hence FR3®, is composed by about 15.1% of saturated fatty acids (mainly palmitic and stearic acids), and about 83.5% of unsaturated fatty acids (mainly oleic, linoleic and linolenic
acids), see Table 1. In this sense, it should be expected that the spectroscopic and physicochemical properties and the performance of this oil inside of the distribution transformer should be tightly related to its chemical composition.
If FR3® oil is composed of mainly by unsaturated fatty acids, it is also reasonable that its performance depends basically on the stability of such acids during the use inside of the distribution transformer. Figure 1, shows the structure of the triacylglycerol derived from linoleic acid, being the main component of this oil (51%), Table 1, which will be used as reference to explain some further properties observed for this oil. In this sense, and according to Figure 1, the main spectroscopic and physicochemical properties of the FR3® oil will be related with the C−O, C=O and C=C functionalities, which should be key for the design of a possible spectroscopic-based technique to monitor the performance of the vegetable oil inside of the distribution transformer.
Our study started with the spectroscopic analysis of an unused oil sample (I) along with three used oil samples (II), (III) and (IV), extracted from several distribution transformers installed in Colombia and Brazil.
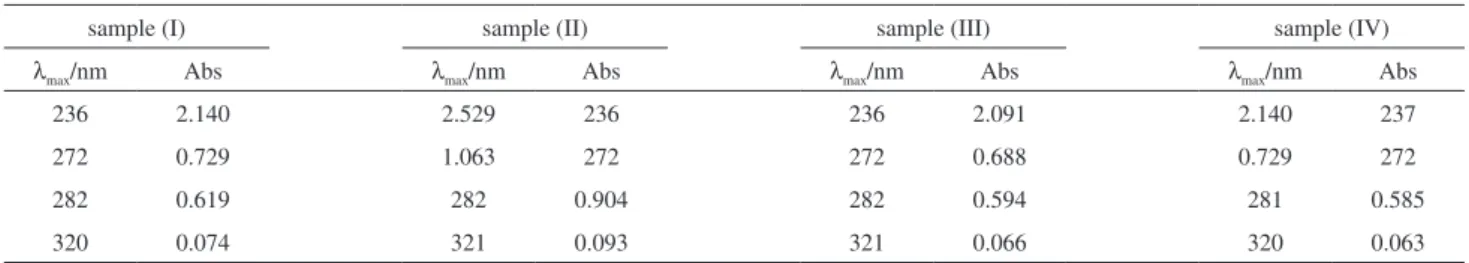
Analysis of the UV-Vis spectra for the oil samples (I-IV)
The UV-Vis spectra were performed in n-hexane because its expected absorption bands are less than 200 nm, being a saturated hydrocarbon. Absorption bands over
Table 1. Chemical composition of the soybean oil
Type of fatty acid chemical composition amount / (%)
Saturated lauric *
miristic *
palmitic 10
estearic 4
Unsaturated palmitoleic *
oleic 29
linoleic 51
linolenic 7
araquidonic *
*Traces.
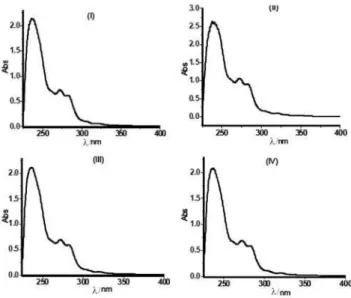
200 nm should exclusively be generated by the samples of the FR3® oil. Particularly, sample (I) showed four main absorption bands at 236.0 [2.140], 272.0 [0.729], 282.0 [0.619] and 320.0 [0.074] nm respectively, (see Figure S1 in Supplementary Information). The values in brackets are referred to the absorbances. All absorption bands are in agreement with π-π* and n-π* electronic transitions due
to C=C and C=O functionalities respectively.6 Taking into account that the FR3® oil is a triacylglycerols mixture rich in unsaturated fatty acids, the UV-Vis absorption bands also agrees with its structure and composition.
Similarly, the UV-Vis spectra of samples (II-IV) showed four absorption bands as well as sample (I), see Table 2. (See Figure S1 for UV-Vis spectra of samples (II-IV)). This finding suggests that in spite of the use time (i.e., 4 months, 8 months or 7 years) inside of the distribution transformers, the chromophoric groups of those oil samples have not suffered significantly changes and therefore their chemical structures apparently remain unmodified. Table 2 shows and compare the main absorption bands of the four oil samples (I-IV).
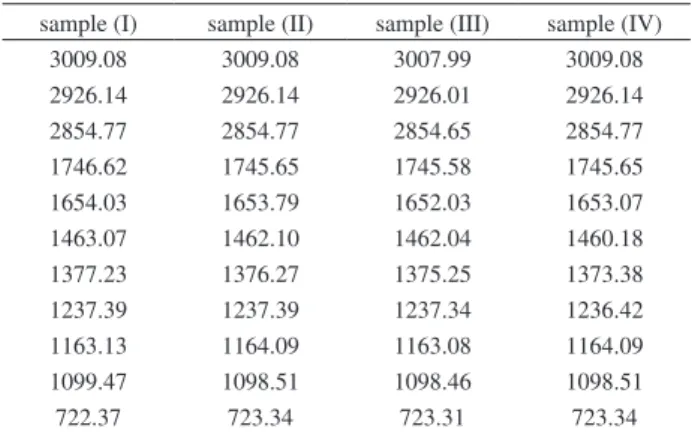
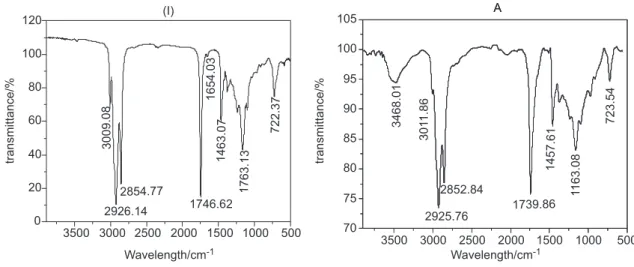
Analysis of the IR spectra for the four oil samples (I-IV)
The Figure 2 shows the IR spectrum of the oil sample (I), where the main absorption bands correspond to: 3009.08 cm-1 assigned to (=C−H) stretching of the carbon-carbon
double bonds, 2926.14 cm-1 and 2854.77 cm-1 assigned to (C−H) stretching of the saturated carbon-carbon bonds,
1746.62 cm-1 assigned to (C=O) stretching of the carbonyl functionalities, 1650.0 cm-1 assigned to (C=C) stretching of the carbon-carbon double bonds, 1163.13 cm-1 assigned to (C−O−C) stretching of the ester functionalities and
722.37 cm-1 assigned to (C−H) out of the plane stretching of the saturated carbon-carbon bonds. Consequently, all absorption bands observed in the IR spectrum are in agreement with the structure of a triacylglycerol bearing unsaturated fatty acids in its structure.
It can be observed that the IR spectra of the used oil samples (II-IV) are very similar to the spectrum of sample (I) Figure 2 and Table 3, (see Figure S2 for IR spectra of (II-III)). These findings confirm that no significant structural changes have been produced during the use of the FR3® oil inside of the three distribution transformers.
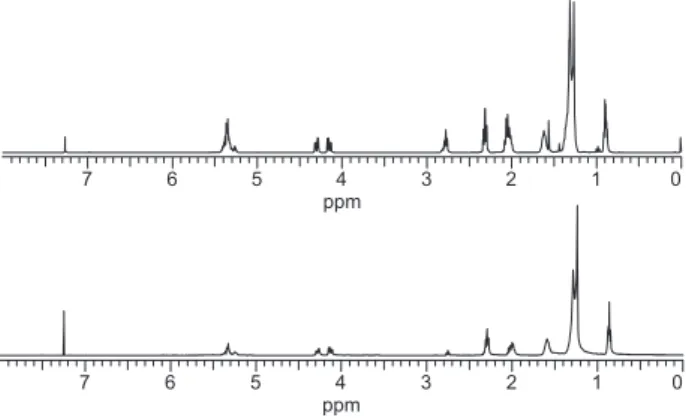
Analysis of the NMR spectra for the four oil samples (I-IV)
For the oil sample (I) the 1H NMR, 13C NMR and DETP-135 spectra were obtained (Figures 3 and 4 respectively). Although a vegetable oil is constituted by a complex mixture of triacylglycerols, surprisingly the FR3® oil showed relatively well defined NMR spectra. In the 1H NMR spectrum we observed signals for CH
3, CH2 and allylic protons of the fatty acid fragments as multiplets in the
Table 2. Comparison of the UV-Vis absorption bands of unused and used FR3® oil samples
sample (I) sample (II) sample (III) sample (IV)
λmax/nm Abs λmax/nm Abs λmax/nm Abs λmax/nm Abs
236 2.140 2.529 236 236 2.091 2.140 237
272 0.729 1.063 272 272 0.688 0.729 272
282 0.619 282 0.904 282 0.594 281 0.585
320 0.074 321 0.093 321 0.066 320 0.063
region of 0.87-2.78 ppm. In the range of 4.13-5.28 ppm we observed two multiplets assigned to the CH2 and CH protons of the glyceryl moiety and in the range of 5.33-5.41 ppm we observed a broad multiplet assigned to the vinylic (=CH) protons of the double bonds of the fatty acid chains.
As expected, in the 13C NMR spectrum numerous signals are seen, most of them in the range of 13.99-34.00 ppm corresponding to CH3, CH2 and allylic carbon atoms. Signals at 62.08 ppm and 68.91 ppm were assigned to the glyceryl CH2 and CH carbon atoms. Signals at 127.89-130.19 ppm were assigned to the vinylic (=CH) carbon atoms, while the signals at 172.75-173.16 ppm were assigned to the carbonyl (C=O) carbon atoms of the triester functionality. The DEPT-135 experiment confirmed
that only signals around 13.99-14.03 ppm, corresponds to the terminal CH3 carbon atoms of the fatty acid chains.
The other signals below of 34.00 ppm correspond to CH2 carbon atoms of the same chains. The signals at 62.08 ppm and 68.91 ppm corresponded to the CH2 and CH carbon atoms of the glyceryl moiety respectively. The absence of signals at 172.75-173.16 ppm confirmed the presence of the carbonyl (C=O) carbon atoms.
All of the above NMR signals are in agreement with the structure of a triacylglycerol bearing unsaturated fatty acid chains as expected for FR3® oil. Although the FR3® oil should contain antioxidant or stabilizing agents, they should be present in very low concentration because they do not affect the appearance of the entire spectra. Comparing the NMR spectrum of the oil sample (I) with the NMR spectra the oil samples (II-IV) (see Figure S3), it is remarkable that the appearances and number of signals are very similar in all spectra. These findings confirm that none of the oil samples (II), (III) or (IV) have suffered chemical changes during the use inside of the distribution transformers, as was suggested by their UV-Vis and IR analysis. This means that all three used oil samples may continue being used as dielectric coolant inside of the transformers for longer times.
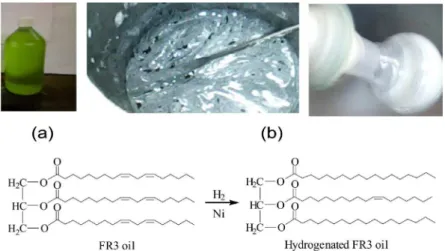
Analysis of the catalytic hydrogenation (hardening) of a FR3® oil sample
The catalytic hydrogenation (hardening)7 of the FR3® oil sample (Figure 5), was carried out in order to establish
Table 3. Comparison of the main IR absorption bands for the four FR3®oil
samples (I-IV) (cm-1)
sample (I) sample (II) sample (III) sample (IV)
3009.08 3009.08 3007.99 3009.08
2926.14 2926.14 2926.01 2926.14
2854.77 2854.77 2854.65 2854.77
1746.62 1745.65 1745.58 1745.65
1654.03 1653.79 1652.03 1653.07
1463.07 1462.10 1462.04 1460.18
1377.23 1376.27 1375.25 1373.38
1237.39 1237.39 1237.34 1236.42
1163.13 1164.09 1163.08 1164.09
1099.47 1098.51 1098.46 1098.51
722.37 723.34 723.31 723.34
Figure 3.1H NMR spectrum of the oil sample (I) (400 MHz, CDCl
3 as solvent).
Figure 4.13C NMR (up) and DEPT-135 (down) spectra of the oil sample (I) (100 MHz, CDCl
the effect of the double C=C bonds over the chemical shifts of the adjacent (allylic) hydrogen and carbon atoms of their 1H NMR and 13C NMR spectra. These findings should be useful for a further spectroscopic-based monitoring protocol to evaluate the performance of the vegetable oil if reductive processes could occur inside of the distribution transformer. Disappearing or shifting of such signals in a used FR3® oil sample may indicate the formation of such reduction products and hence, should give valuable information about the aging degree and performance of the oil inside of the transformer. After the hydrogenation reaction, the change in appearance, physical state and color of the product (Figure 5 (b)) with respect to the original oil (I) (Figure 5 (a)), is notable.
At the same time, the IR spectrum (see Figure S4) changed in both form and intensities of the absorption bands, especially at the fingerprints region (1500-700 cm-1), with respect to Figure 2 for sample (I). It is notable also, the differences between the 1H NMR spectrum of the starting oil sample (I), Figure 3, and the hydrogenated product, Figure 6. The signals around 5.3 ppm corresponding to (=CH) protons have almost disappeared. Also, allylic signals around 1.8-2.3 ppm have reduced their intensities and conversely the intensity of the signal at 1.24 ppm (saturated protons), has increased.
The 13C NMR and DEPT-135 spectra also agree with changes resulting from the hydrogenation process. In this
case, the olephinic carbon atoms at 127-130 ppm (Figure 4) have disappeared in Figure 7. This finding confirmed that almost all C=C double bonds were hydrogenated, but the hydrogenation process did not affect the carbonyl carbon atoms because the signals around 172-173 ppm remained unchanged in the hydrogenated product. All above spectra are in agreement with the structure of the expected hydrogenated triacylglycerol derived from the FR3® oil sample.
Hydrolysis of an oil sample (I)
The hydrolysis of the oil sample (I) was carried out in order to establish the spectroscopic profile of the free fatty acids formed from this oil. These findings should be useful for a further spectroscopic-based monitoring protocol to evaluate the performance of the vegetable oil if hydrolytic processes occur inside of the distribution transformer. The appearance of spectroscopic signals belonging to the free fatty acids into a used FR3® oil sample should give valuable information about the aging degree and performance of the oil inside of the transformer.
Figure 5. Catalytic hydrogenation of a FR3® oil sample. (a) Oil sample (I); (b) hydrogenated product.
Figure 6.1H NMR of the hydrogenated FR3® oil sample (400 MHz,
CDCl3 as solvent).
Figure 7.13C NMR and DEPT-135 spectra of the hydrogenated FR3® oil
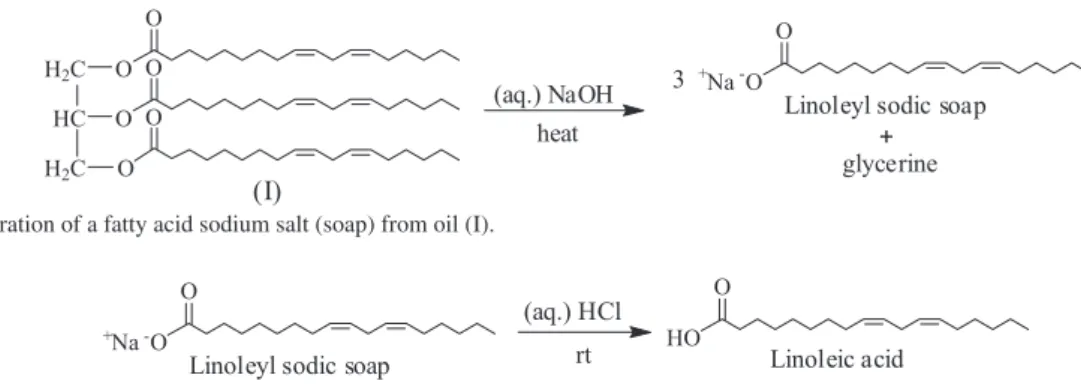
Saponification of a FR3® oil sample. Synthesis of a sodium
soap derived from FR3® oil
After the saponification of the oil sample (I) was performed, a doughy white solid was obtained, Scheme 1.
Because FR3® oil is obtained from soybean oil; the soap formed should consist of mainly by sodium salts of the unsaturated oleic, linoleic and linolenic acids. The IR spectrum agrees with such composition (see Figure S5). As reference, Scheme 1 depicts the linoleic acid sodium salt as reaction product; as such acid is the major constituent of the soybean oil. The main differences of the IR spectrum of the soap (see Figure S5), with respect to the IR spectrum of the starting oil sample (I) (Figure 2), are found at the fingerprints region (1300-500 cm-1), confirming that the chemical transformation effectively proceeded.
Neutralization of a soap sample. Preparation of free fatty acids from the oil sample (I)
Treatment of a soap sample with aq 18% HCl released the free fatty acids derived from FR3® oil, Scheme 2. Again, linoleic acid is shown as the representative product of this process to facilitate the analysis of its spectral charts.
Figure 8 shows the IR spectra of the free fatty acid obtained. Differences at the fingerprints region with respect
to sample (I) and the presence of a carboxylic broad COO−H absorption band at 3560-2500 cm-1 confirmed the formation of this product.
The most relevant NMR features for the free fatty acid corresponded to the disappearing of the (CH−O
and CH2−O) signals at 4.0 and 4.5 ppm (in the
1H NMR, see Figure S6) and the CH signal at 68.91 ppm (in the DEPT-135, Figure 9). Both signals referred to the removal of the glyceryl moiety from the starting oil sample (I) (Figures 3 and 4). These findings confirmed the formation of the expected free fatty acid.
Transesterification reaction of unused and used FR3® oil
samples. Preparation of biodiesel
This experiment was carried out with the unused and used oil samples (I) and (IV) respectively, in order to evaluate their potential for generating biodiesel. This reaction was planned as a future alternative to extend the usefulness of dielectric vegetable oils after finishing their useful lifes inside of the transformers. In this sense, treatment of an oil sample (I) with methanol in the presence of NaOH at ambient temperature produced the expected methyl fatty acid ester (biodiesel), Scheme 3. The same product was efficiently obtained from the used oil sample (IV).
The structure of the methyl ester obtained was confirmed from their IR (see Figure S7) and NMR spectra, Figures 10 and 11. The main differences between IR spectrum of the biodiesel and the starting oil sample (I) (Figure 2) were found at the fingerprints region, indicating that the reaction proceeded effectively.
Figure 8. IR spectrum of the free fatty acid obtained from a FR3® oil
sample (film on NaCl cell).
Scheme 1. Preparation of a fatty acid sodium salt (soap) from oil (I).
Scheme 2. Preparation of the free fatty acid from a sample of soap derived from FR3® oil.
The main features of 1H NMR and 13C NMR spectra of the obtained biodiesel corresponded to the presence of a new singlet at 3.67 ppm and (51.38 ppm), respectively, assigned to the new CH3O of the methyl ester functionality, and the disappearing of the signals around 4.5 and 4.0 ppm (68.91 and 62.08 ppm) associated with the CH and CH2 groups of the glyceryl moiety. These findings unambiguously confirmed the formation of the biodiesel from the oil samples (I) and (IV).
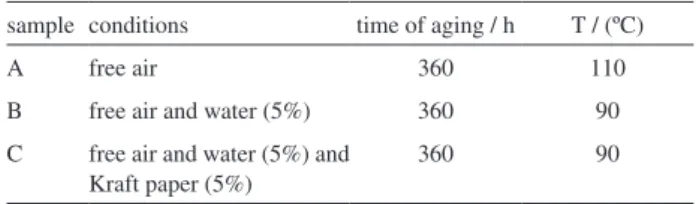
Accelerated aging tests for FR3® oil samples
To complement the chemical and spectroscopic studies performed to the four oil samples (I-IV), we decided to evaluate the effect of the heating, humidity, the ambient oxygen and the Kraft paper on the chemical stability of the FR3® oil, based on experiments previously reported by Wilhelm et al.8 As mentioned in the Experimental section three samples A, B and C were prepared to carry out these experiments (Table 4).
The three oil samples A, B and C were subjected to thermal stress at the temperatures and conditions described in Table 4. These experiments were aimed to produce structural changes in the oil samples detectable by spectroscopic techniques. These results should be useful for a future development of a procedure to diagnostic the natural aging of the FR3® oil associated with thermal, hydrolytic or oxidative processes inside of the distribution transformers.
The monitoring of the aging processes was carried out by continuous observation of the physical changes suffered by the samples along with analysis by IR spectroscopy during the periods of time and temperatures established in Table 4. Figure 12 shows how the physical properties (i.e., viscosity and color) of the three samples changed during the heating. It is interesting that the sample with major increasing of its intensity of color (darkness) and viscosity corresponded to sample A where neither water nor Kraft paper was present. As it can be seen the final texture of this sample was a semi-solid (gelatinous) material, Figure 12.
Contrary to the UV-Vis spectrum of the original FR3® oil sample (I), the UV-Vis spectra of the three accelerated aged samples showed only two but not four absorption bands, as shown in Figure 13 and Table 5, (see Figure S8 for UV-Vis spectra of samples B and C).
This is an important finding because suggest that the chromophoric system of the oil samples has changed
Table 4. FR3® oil samples subjected to accelerated aging
sample conditions time of aging / h T / (ºC)
A free air 360 110
B free air and water (5%) 360 90
C free air and water (5%) and Kraft paper (5%)
360 90
Scheme 3. Preparation of biodiesel from an oil sample (I) by a transesterification reaction.
Figure 10.1H NMR spectrum of the biodiesel obtained from the oil
samples (I) and (IV) (400 MHz, CDCl3 as solvent).
Figure 11.13C NMR and DEPT-135 spectra of the biodiesel obtained from
the oil samples (I) and (IV) (100 MHz, CDCl3 as solvent).
Figure 13. UV-Vis spectra of the oil sample (I) and the accelerated aged samples A (n-hexane as solvent).
significatively after the heating process; and consequently, their chemical structures also should have changed.
The main feature of the IR spectra corresponded to a broader (C=O) absorption band around 1741 cm-1 than the same signal for the original oil sample (I), along with the almost disappearing of the =C−H olephinic absorption band
at 3005 cm-1 in the aged samples. Also, the appearance of a new broad absorption band around 3500 cm-1 is observed in the spectra of the three aged samples. It is worth mentioning that these above differences are greater in sample A than
Figure 14. IR spectra of the original oil sample (I) and the accelerated aged sample A (films on NaCl cells).
Table 5. Comparison of the absorption bands of the three accelerated aged oil samples A-C.
sample band 1 (λmax/Abs) band 2 (λmax/Abs)
A 239/3.436 272/1.561
B 231/0.858 273/0.267
C 232/1.126 274/0.310
the others B and C samples, Figure 14, (see Figure S9 for IR spectra of samples B and C).
Scheme 4. Possible hydroxylated degradation products derived from the FR3® oil samples during the aging experiments.
although the products formed are of the same nature as those of sample A.
In the case of the IR spectra of the accelerated aged FR3® oil samples A, B and C the small broad band around 3400 cm-1 might be associated with hydrolytic processes by formation of the OH functionality or by generation of small fractions of free fatty acids during the aging, Scheme 4. The first case would be associated with radical mediated processes involving addition of oxygen and migration of hydrogen atoms (species 1, Scheme 4),9 while the second one should involve a typical hydrolysis of triacylglycerols.7 The absence of water reduces the probability of this second process in sample A. Nevertheless, both processes should affect dramatically the physicochemical and dielectric properties of the vegetable FR3® oil sample.
An additional process which should be responsible for the increasing viscosity of the aged FR3® oil samples (mainly sample A), is associated with the formation of high molecular-weight oxidation products generated by the presence of oxygen in the reaction media, Scheme 5. Formation of such products should be associated with the drying oils concept.7,10 The high content of unsaturated fatty acids in FR3® oil agrees with this concept. In these
Figure 15. Comparison of the 1H NMR spectrum of the oil sample (I) (up)
with the spectrum of the accelerated aged oil sample A (down) (400 MHz, CDCl3 as solvent).
processes oligomeric or even polymeric structures may be formed through free radical species, Scheme 5. The oxidation pathway starts by the abstraction of allylic or
bis-allylic hydrogen atoms mediated by oxygen through peroxide radicals, (species 2, Scheme 5).11,12 Transformation of these peroxide radicals generally involves competitive reactions such as formation of cyclic peroxides (species 3, Scheme 5), isomerization of the double bonds or even formation of dimers, oligomers and polymers (species 6, Scheme 5). According to our experimental conditions, this latter process should be the favored one, yielding the semi-solid material in sample A. Such material should be generated by a high degree of crosslinking through the C=C double bonds with the formation of numerous C−C
and C−O−C new bonds, as shown in Scheme 5. The profiles
of the IR and NMR spectra of the aged samples A, B and C, are more likely with a triacylglycerol nature than a free fatty acid. This finding indicates that oxidation processes (conducting to crosslinked triacylglycerols, Schemes 5 and 6) prevailed over hydrolytic processes (conducting to free fatty acids, Scheme 4), during the accelerated aging experiments of the three oil samples (A-C).
The fact that sample A was the most affected by the air and the heating in the accelerated aging experiments is in agreement with an oxypolymerization type mechanism as depicted in Scheme 5. Because this mechanism is mediated by oxygen- and carbon-based free radicals, the presence of water in the media (samples B and C), should decrease the speed of formation of those species.13 For that reason processes B and C proceeded slower than process A, where no water was present. Apparently the presence or absence of Kraft paper in the media did not affect significantly the aging rate of the oil samples.
Scheme 5. Proposed mechanistic pathway for the formation of oligomers or polymeric products derived from the accelerated aging experiments of the oil samples A-C. Trilinoleyglycerol was taken as reference for being the main component of the FR3® oil.
Scheme 6. Possible route of formation of the hydroxylated products detected by IR spectra derived from the accelerated aging experiments of the oil samples A-C.
radical species 1, which may propagate and oligomerize, as shown in Scheme 6.
Conclusions
Pursuing the further development of a spectroscopy-based methodology for monitoring the life-time and performance of vegetable dielectric oils as coolant for distribution transformers, several studies were performed in this work. A complete UV-Vis, IR, 1H NMR, 13C NMR and DEPT spectroscopic analysis was carried out to an unused vegetable FR3® dielectric coolant oil sample (I) in order to establish its structural properties. The same spectroscopic analysis was performed for three used FR3® oil samples (i.e., 4 months old (II), 8 months old (III) and 7 years old (IV)), obtained from several operating distribution transformers. Comparison of the spectroscopic data of both unused and used oil samples indicated that no significant spectroscopic, and hence, no structural changes occurred after months or years of use, indicating that the performance of the FR3® oil tested continues to be acceptable even after 7 years of being in use inside of the transformers, (sample IV).
Chemical transformations like catalytic hydrogenation (hardening) and hydrolysis were also performed for some oil samples and their products were analyzed by spectroscopic methods in order to collect additional structural information about the vegetable FR3® oil. Thermal and air exposed degradation through accelerated aging tests in laboratory was also performed for three FR3® oil samples at 90 oC and 110 oC. The effect of the presence or absence of water and Kraft insulating paper was evaluated, showing that the sample with absence of water and Kraft paper had the higher increase of viscosity and degradation. Spectroscopic analysis of that aged material suggested the formation of highly crosslinked products involving the majority of C=C double bonds of the fatty acid chains mediated by free radicals oxypolymerization type processes. The spectroscopic study of the oil samples along with their transformation products gave valuable information to search for the aforementioned monitoring procedure.
efficiently and products were obtained in good yields. These findings are remarkable because they may become in the future a useful alternative to give added value to the vegetable dielectric oil residues.
Supplementary Information
Supplementary data are available free of charge at http://jbcs.sbq.org.br as PDF file.
Acknowledgments
The authors wish to credit COLCIENCIAS, Empresas Públicas de Medellín (EPM) and Universidad del Valle for financial support. Authors kindly thank to Ing. Vagner Vasconcellos (CPFL Energia, Brazil) for supplying the 7 years old used FR3® oil sample (IV) and Dr. Helena M. Wilhelm (LACTEC, Universidade Federal do Paraná, Brazil) for her valuable advices during the developing of this work.
References
1. Marulanda, A. R.; Artigas, M. A.; Gavidia, A.; Labarca F.; Paz, N.; Transmission and Distribution Conference and Exposition: Latin America; IEEE/PES, IEEE, 2008, pp. 1-6. http://ieeexplore.ieee.org/xpls/abs_all.jsp?arnumber=4641781, accessed in February 2009.
2. Badent, R.; Kist, K.; Schwab, A. J.; High Voltage Engineering Symposium; IEEE, Conference Publication N. 467, 1999, p. 140. http://ieeexplore.ieee.org/xpl/freeabs_all. jsp?arnumber=816740 accessed in March 2009.
3. Lee, B.; Jeong, J.; Park, C.; Song, I.; Annual Report Conference on Electrical Insulation Dielectric Phenomena; IEEE, 2008, p. 115. http://ewh.ieee.org/soc/dei/ceidp/CEIDP%202008%20 Program.pdf accessed in April 2009.
4. Envirotemp FR3 Fluid Testing Guide, Section R900-20-12, Reference Document, 2008, pp. 1-8. www.waukeshaelectric. com/.../R900-20-12FR3testingGuideApril2008.pdf accessed in October 2009.
5. Wilcox, J. R.; Cavins, J. F.; Nielsen, N. C.; J. Am. Oil Chem. Soc. 1984, 61, 97.
6. Silverstein, R.; Clayton, G.; Morrill, T.; Spectrometric Identification of Organic Compounds, 5th ed., John Wiley &
sons, Inc.: Toronto, USA, 1991.
7. Hart, H.; Craine, L.; Hart, D.; Hadad, C.; Química Orgánica, 12th ed., Mc Graw Hill: Madrid, 2007.
8. Wilhelm, H. M.; Stocco, G. B.; Tulio, L.; VI Workspot-International Workshop on Power Transformers, Foz do Iguaçú, Brazil, 2010. http://biovolt.com.br/conteudo/artigos_ cientificos/20010%20VI_Workspot.pdf accessed in June, 2010. 9. Gardner, H.; Free Radical Biol. Med. 1989, 7, 65.
10. Taylor, W. L.; J. Am. Oil Chem. Soc. 1950, 27, 472.
11. Laguerre, M.; Lecomte, J.; Villeneuve, P.; Prog. Lipid Res. 2007, 46, 244.
12. Güner, F. S.; Yağcı, Y.; Erciyes, A. T.; Prog. Polym. Sci. 2006, 31, 633.
13. Encinas, M. V.; Lissi, E. A.; Rufs, A. M.; Altamirano, M.; Cosa, J. J.; Photochem. Photobiol. 1998, 68, 447; Smirnoff, N.; New Phytol. 1993, 125, 27.
Submitted: April 15, 2011
Supplementary Information
Printed in Brazil - ©2011 Sociedade Brasileira de Química0103 - 5053 $6.00+0.00S
I
*e-mail: [email protected]
Chemical and Spectroscopic Characterization of a Vegetable Oil used as Dielectric
Coolant in Distribution Transformers
Neffer A. Gomez,a Rodrigo Abonia,*,a Hector Cadavidb and Ines H. Vargasc
aDepartamento de Química and bGrupo GRALTA, Escuela de Ingeniería Eléctrica,
Universidad del Valle, A. A. 25360 Cali, Colombia
cArea de Ingeniería de Distribución, Empresas Públicas de Medellín (EPM), Carrera 58, N. 42-125,
Piso M, Torre Sur, Medellín, Colombia
Figure S1. UV-Vis spectra of the FR3® oil samples (I-IV) (n-hexane as solvent).
Figure S3. (A) Comparison of the 1H NMR spectra of the unused (I) and used (II-IV) FR3® oil samples. (400 MHz, CDCl
3 as solvent). (B) Comparison
of the 13C NMR and DEPT-135 spectra of the used (II-IV) FR3® oil samples. (100 MHz, CDCl
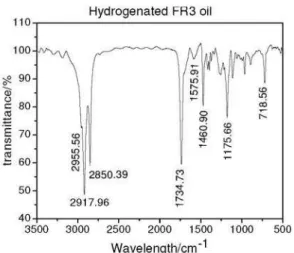
Figure S4. IR spectrum of the hydrogenated FR3® oil sample (film on
NaCl cell).
Figure S5.IR spectrum of the soap obtained from the saponification of a FR3® oil sample (I) (film on NaCl cell).
Figure S6. 1H NMR spectrum of the free fatty acid obtained from a FR3®
oil sample (I) (400 MHz, CDCl3 as solvent).
Figure S7. IR spectrum of the biodiesel obtained from the FR3® oil
samples (I) and (IV) (film on NaCl cell).
Figure S9. IR spectra of the FR3® oil samples (B and C) (films on NaCl cells).
Figure S10. 13C NMR and DEPT-135 spectra of the accelerated aged FR3® oil sample A (100 MHz, CDCl
3 as solvent).
Figure S11. NMR spectra of the accelerated aged FR3® oil sample B (400 and 100 MHz, CDCl
Figure S12. NMR spectra of the accelerated aged FR3® oil sample C (400 and 100 MHz, CDCl