0103 - 5053 $6.00+0.00
Article
* e-mail: [email protected]; [email protected]
Phenolic Compounds in Acerola Fruit (
Malpighia punicifolia, L
.)
Ana Lúcia A. Vendramini* and Luiz C. Trugo*
Instituto de Química, Universidade Federal do Rio de Janeiro, Ilha do Fundão, CT bloco A, sala 528, 21949-900 Rio de Janeiro – RJ, Brazil
Agliconas de antocianinas e outros compostos fenólicos foram identificados na fruta acerola (Malpighia punicifolia, L). As antocianinas, os flavonóides e os ácidos fenólicos foram fracionados e caracterizados através de dados cromatográficos e espectrais. O teor de antocianinas na casca da acerola madura foi 37,5 mg.100g-1. Os pigmentos fenólicos identificados foram a pelargonidina, a
malvidina 3,5-diglicosilada e a cianidina 3-glicosilada. Foram também identificados a quercetina, o kaempferol, e os ácidos p-cumárico, ferúlico, cafeico e clorogênico.
Anthocyanin aglycons and other phenolic compounds were identified in acerola (Malpighia punicifolia, L.). Anthocyanins, flavonoids and phenolic acids were fractionated and characterized by means of chromatographic and spectral data. The total content of anthocyanin pigments was 37.5 mg per 100 g of ripeacerola skin. The phenolic pigments identified were pelargonidin, malvidin 3,5-diglycoside and cyanidin 3-glycoside. Quercetin, kaempferol and the phenolic acids p-coumaric acid, ferulic, caffeic and chlorogenic were also identified.
Keywords: flavonoids, anthocyanins, phenolic acids, acerola, Malpighia punicifolia L.
Introduction
Phenolic compounds are important for plant meta-bolism and have also becoming important for humans due to their health characteristics, particularly related to their antioxidant properties.1
Anthocyanins are one of the most attractive plant phenolic pigments of the group of flavonoids. Their visual impact allied to their health properties make them potentially useful as natural food colorants.
One possible source of anthocyanin pigments is the fruit of acerola (Malpighia punicifolia, L.), a highly productive plant, which provides fruits during long periods of the year and is extensively cultivated in Brazil. The attractive red colour in acerola skin is mainly due to anthocyanins and the abundance of this fruit in Brazil represents a potential source of anthocyanin pigments.
Flavonoids are polyphenolic compounds that occur ubiquitously in food of plant origin and more than 2000 chemically distinct flavonoids have been already reported.2
Phenolic compounds are also important because of their contribution to the sensory quality of fruits (colour and flavour, including astringency and bitterness) which may
be affected during the technological processes used for production of juice and other derived products.3 In
addition, anthocyanins and other phenolic compounds have been used successfully in the characterization of fruits and juices.4
Due to the importance of flavonoids, many techniques have been used to identify and quantify these compounds. In the early 1990s, high-performance liquid chromato-graphy (HPLC), with photodiode array detection was used to isolation and quantification. 1H and 13C NMR
spectroscopy are the most powerful techniques for deter-mination of molecular structure. The coupling of HPLC and mass spectrometry methods, such as electrospray, thermospray, or fast-atom bombardment, have been widely used to provide molecular weight and characteristic fragment ions for structural elucidation2, but these are very
expensive techniques which are not readily available.5 Due
to simplicity of methodology and low cost, techniques like paper chromatography and thin-layer chormatography have been applied routinely in many laboratories.2,6-8
be used in food, pharmaceutical and cosmetic industries is based on consumer demand for natural colorants, and on the nutraceutical properties frequently reported for flavonoids.9 However, as far as we know, no studies on
characterization of acerola phenolics have been published. Thus, the objective of the present work was to isolate and characterize the phenolic compounds present in acerola and to estimate the amount of anthocyanin pigments found in the acerola skin which is usually a by product from the production of acerola pulp.
Material and Methods
Fruit
Acerola fruits (M. punicifolia, L.) were chosen by intensive red colour, firmness and a pleasant acid flavour, which are indicative of an ideal stage of ripeness. The fruits were harvested during June 2000 in a commercial plantation in Rio de Janeiro city (Brazil). After harversting, the fruits were washed, packed in polyethylene bags and stored in the dark at –18 °C for two days before anthocyanin extraction.
Chemicals
Caffeic, ferulic, p-coumaric and chlorogenic acids and quercetin, kaempferol, myricetin, and pelargonidin chloride, were obtained from Sigma Chemical Co (USA). The solvents used were of HPLC grade obtained from Tedia Co (USA). All other chemicals were of analytical grade.
HPLC equipment
A Pharmacia (Switzerland) liquid chromatographic system, equipped with two pumps (LKB model 2248), a controller (LKB model LCC 2252), and an injector motor valve (model PMV-7) with 20 µL loop was used. The system was attached to a UV-VIS detector SPD 10 AV (Shimadzu – Japan). An integrator model C-R6A (Shimadzu - Japan) was used for data processing.
Characterization of anthocyanin aglycones
Anthocyanins were analyzed in the extract from acerola skin where these pigments are concentrated. The skin of ripe acerola fruit (500g) was extracted with 600 mL of acidified methanol (0.1% citric acid, v/v) in the dark at about 15 °C and the extract concentrated under vacuum. Due to the non-availability of standards, anthocyanin characterization was carried out based on several
physico-chemical information such as mobility in HPLC, separation by paper chromatography and spectroscopic charac-teristics. Paper chromatographic separation was performed in the dark using Whatman paper 3 MM Chr (23 x 57 cm) according to the method described by Francis.10 Analysis
of HPLC was performed in a Lichrospher-100 RP-18 column (250 x 4.6 mm, Merck, Germany) using methanol-water (1:1, v/v) acidified with 2 mol L-1 HCl as mobile
phase until pH 2.5 and flow rate of 1.3 mL min-1. Detection
was carried out at 530 nm.11 UV-Vis spectroscopy was
carried out in the fractions separated by paper chromato-graphy that were dissolved in methanolic 0.01% HCl. UV-Vis spectra were obtained with a Beckman DU 650 spectro-photometer (Fullerton, USA), in the range of 200 – 600 nm, with the absorption spectra registered before and after the addition of 3 drops of a solution of the aluminum chloride salt in absolute ethanol (5% m/v).8,12-14 The position of the
sugar in the anthocyanin molecule was assigned based on the spectral shifts by calculation of the ratio of absorption at 440 nm to the specific absorption maximum for each pigment.8,13,14 The amount of total anthocyanin in the
acerola skin was estimated based on the calculation described by Lees and Francis15 after measurement of the
absorbance of the acidified ethanol extract at 535 nm.
Characterization of flavonols and phenolic acids
Flavonols and phenolic acids are distributed both in the fruit skin and pulp. Consequently, in order to obtain a higher yield, the whole fruit was used for extraction. Frozen acerola fruit (260 g) was blended with 250 mL of cooled distilled water and centrifuged at 3000 x g for 20 min at 4 °C. The extraction and centrifugation procedures were repeated twice. The combined supernatants were filtered through Whatman No.1 filter paper. Selective solvent extractions were then carried out to obtain one fraction containing the flavonol aglycons and other containing the phenolic acids, following the procedure described by Kader et al.16 Characterization was then carried out using
HPLC for separation and identification was done by comparison and spiking with external standards. For the analysis of flavonol aglycons, the mobile phase was methanol containing 0.5% orthophosphoric acid (1:1 v/v) with a flow rate of 1.2 mL/min., and detection at 370 nm.17
For the analysis of the phenolic acids, the mobile phase consisted of a gradient elution with 0.01 mol L-1 tri-sodium
citrate solution and 20% methanol adjusted to pH 2.5 with 6 mol L-1 HCl (solvent A) and methanol (solvent B). Elution
at 325 nm.18 In both cases, a Lichrospher-100 RP-18 column
(250 x 4.6 mm, 5 µm, Merck, Germany) was used.
Results and Discussion
The main objective of the present study was to characterize the phenolic compounds present in acerola, including the aglycones of phenolic glycosides. The structures of the compounds studied are shown in Figure 1. Phenolic pigments such as anthocyanins are usually found as glycosides in plants, however, when they are ingested as food the sugars are easily hydrolyzed from the
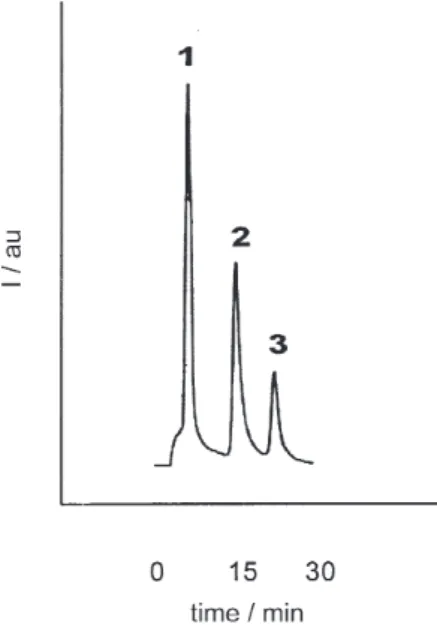
aglycones. HPLC analysis of the anthocyanin fraction showed three peaks with retention times of 5.7 min, 14.9 min and 22.1 min (Figure 2). Similarly, paper chroma-tography revealed three bands with pink, magenta and orange colours, respectively. The typical order of chromatographic elution in reverse phase HPLC of different anthocyanins with similar glycosylation patterns is determined by the polarity of the aglycone. The three peaks observed in the HPLC chromatogram were correspondent to the three bands observed by descending paper chromatography. Peak 1 corresponded to the pink band (Rf = 0.43); peak 2 corresponded to the magenta band (Rf = 0.12) and peak 3 to the orange band (Rf = 0.56). The different colours of anthocyanin pigments reflect the nature of their hydroxylation and methoxylation patterns. An increase in hydroxylation is accompanied by an increase in blue colour while methoxylation enhances the red colour.1 This would indicate that peak 1 may
correspond to a malvidin with one methoxylation and peak 2 to a cianidin with two hydroxylations. Peak 3 indicates one hydroxylation in the molecule which confirms the assignment of pelargonidin that was determined by comparison and spiking with the external standard.
Additional qualitative information was obtained with the aid of the spectral characteristics of the chromato-graphic bands. The spectral data presented in Table 1 show the maximum absorptions for the chromatographic peaks as 277 and 536 nm for peak 1 (5.7 min); 281 and 527 nm
Figure 1. Chemical structure of phenolic compounds identified in acerola.
Figure 2. HPLC chromatogram of the methanolic extract of acerola. Column: Lichrospher – 100 RP 18 (250 x 4.6 mm); eluent: metha-nol/water (1:1 v/v) pH 2.5; flow-rate: 1.3 mL min-1; detection: 530
for peak 2 (14.9 min) and 266 and 523 nm for peak 3 (22.1 min). These data are correspondent to spectral data of malvidin, cyanidin and pelargonidin.7,10-12,19
No change in colour was observed after addition of aluminum chloride in the fractions corresponding to peaks 1 and 3, but the one corresponding to peak 2 changed from red to blue as a consequence of a shift in the maximum of absorption. This is an indication that peak 2 is an ortho -dihydroxy anthocyanin belonging to the groups of pelargonidin, peonidin or malvidin.19 This test enables to
make a broad differentiation between the derivatives of the cyanidin, delphinidin and petunidin groups, which show a positive colour change, and those of the pelargonidin, peonidin and malvidin groups, which show no colour change.19 These results further support the
assignment of peak 3 as pelargonidin and indicate that peak 1 does not belong to the cianidin, delphinidin or petunidin groups.
The ratios of Abs440/Absλmax calculated for peaks 1, 2 and 3 were 11, 24 and 35, respectively. The ratio of absorption at 440nm to the maximum is useful in distinguishing anthocyanins when glycosilated at the 3-and 5- positions.11,13 The Abs
440/Absλmax ratio is usually
about 11 for malvidin, corresponding to 3,5-diglycosides. The Abs440/Absλmax ratio is 24 for cyanidin derivatives substituted at position 3 and is 35 for pelargonidin which is not glycosilated.11,13
The results obtained in the present work are in agreement with literature data7,13,19,20 for the assignment of
a malvidin 3,5-diglycoside as peak 1 and a cyanidin 3-monoglycoside as peak 2.
Absence of absorption in the 308–328 nm region of the spectra indicated that none of the acerola pigments were acylated with aromatic organic acid.20
The content of anthocyanins was estimated as 37.5 mg per 100 g of ripe acerola skin. This anthocyanin content is higher than that found in red cabbage (25 mg), plum (2 – 25 mg), strawberries (15 – 35 mg) and banana bracts (32 mg) per 100g fresh weight.14,21 This indicates that acerola
skin which is a by product of the acerola pulp production may be used as a commercial source of natural pigment.
Qualitative HPLC analysis and identification by means
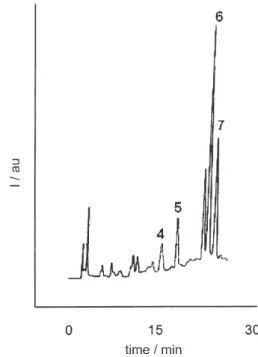
of spiking and comparison with external standards were carried out in the fraction containing phenolic acids. Two major peaks were identified as p-coumaric and ferulic acid (peaks 6 and 7). Smaller peaks corresponding to chlorogenic acid (5-caffeoylquinic acid), and caffeic acid (peaks 4 and 5, respectively) were also detected in the fraction (Figure 3).
Caracterization of flavonol aglycons is also important due to their biological activities particularly in relation to their antioxidant properties.9,22-24 The fraction containing
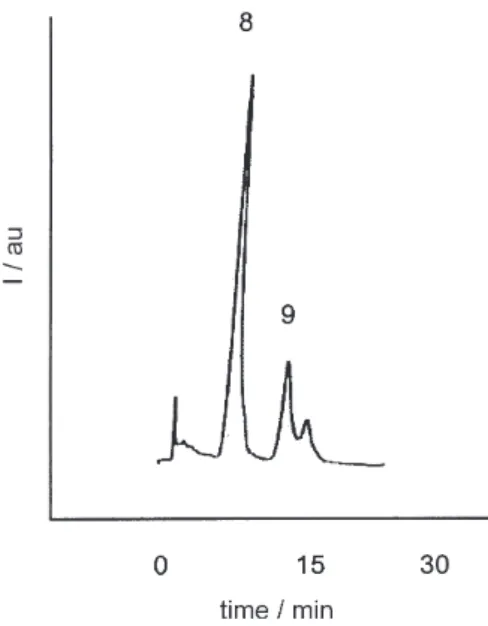
flavonol aglycons showed as expected maximum absorbance at 370 nm. Individual peaks obtained by HPLC were assigned after comparison of retention times and coelution with flavonol standards showing the presence of quercetin (Rt 8.2 min) and kaempferol (Rt 13.0 min) (Figure 4).
Table 1. Data of anthocyanin pigments from acerola
Rf (%) of bands
from paper λmax (nm) Absλ440nm /Absλvis max AlCl3 shift HPLC tR Relative amount Peak Assignment
chromatography (min.) (% of peak area)
4 3 277; 536 1 1 – 5.7 6 8 Malvidin 3,5-diglycoside
1 2 281; 527 2 4 + 14.9 2 1 Cyanidin 3-glycoside
5 6 266; 523 3 5 – 22.1 1 1 Pelargonidin
Figure 3. HPLC chromatogram of the phenolic acids extract of acerola. Column: Lichrospher – 100 RP 18 (250 x 4.6 mm); eluent: 0.01 mol L-1 tri-sodium citrate solution and 20% methanol (solvent
A) and methanol (solvent B); flow-rate: 1.0 mL min-1; gradient
In conclusion, the phenolic compounds detected in acerola may be classified in two categories; phenolic anthocyanin pigments and non-anthocyanin phenolics. The pigments detected were a 3,5-diglycosilated malvidin, a 3-monoglycosilated cyanidin and pelargonidin. Non-anthocyanin phenolic compounds identified were p-coumaric acid, ferulic acid, caffeic acid, chlorogenic acid, kaempferol and quercetin.
Acknowledgements
The authors would like to express their gratitude to Dr. M.C. Guedes for technical assistance on paper chromato-graphy and useful discussions and CNPq, FAPERJ, CAPES and FUJB (Brazil) for financial support. Author LCT is recipient of a fellowship from CNPq.
References
1. Jackman, R.L, Smith, J.L In Natural Food Colorants; Hendry, G.A.F.; Houghton, J.D., ed., Blackie Academic & Professional: London, 1996, pp. 249-250.
Figure 4. HPLC chromatogram of the flavonol aglycons extract of acerola. Column: Lichrospher – 100 RP 18 (250 x 4.6 mm); eluent: methanol/ 0.5% orthophosphoric acid (1:1 v/v); flow-rate: 1.2 mL min-1; detection: 370 nm. Peaks: 8, quercetin (8.2 min); 9, kaempferol
(13.0 min).
2. Wang, J.; Sporns, P.; J. Agric. Food Chem. 2000, 48, 1657. 3. Simón, B.F.; Pérez-Ilzarbe, J.; Hernández ,T.;
Gómez-Cordovés, C.; Estrella, I.; J. Agric. Food Chem. 1992, 40, 1531.
4. Gil, M.I.; Cherif, J.; Ayed, N.; Artés, F.; Tomás-barberán, F.A.; Z. Lebensm Unters Forsch. 1995,201,361.
5. Gao, L.; Mazza, G.; J. Agric. Food Chem.1994, 42, 118. 6. Strigl, A.W.; Leitner, E.; Pfaunhauser, W.; Z. Lebensm Unters
Forsch. 1995, 201, 266.
7. Mazza, G.; Velioglu, Y.S.; Food Chem.1992, 43, 113. 8. Mazza, G.; J. Food Sci. 1986, 51, 1260.
9. Bridle, P.; Timberlake, C.F.; Food Chem. 1996, 58, 103. 10. Francis, F.J. In Anthocyanins as Food Colors; Markakis, P.,
ed.., Academic Press: New York , 1982.
11. Guedes, M.C.; MSc. Dissertation (http://www.fea.unicamp.br), Campinas, Unicamp, Brazil, 1993.
12. Giusti, M.M.; Wrolstad, R.E. In Current Protocols in Food Analytical Chemistry; Wrolstad R.E., ed., John Wiley & Sons: New York, 2001. pp. F1.2.3-F1.2.4
13. Markakis, P.; Anthocyanins as Food Colors, Academic Press: New York, 1982.
14. Pazmiño-Durán, E.A.; Giusti, M.M.; Wrolstad, R.E.; Glória, M.B.A.; Food Chem. 2001, 73, 327.
15. Lees, D.H.; Francis, F.J.; Hortscience1972, 7, 83.
16. Kader, F.; Rovel, B.; Girardin, M.; Metche, M.; Food Chem.
1996, 55, 35.
17. Hasler, A.; Sticher, O.; J. Chromatogr. 1990, 508, 236. 18. Trugo, L.C.; Macrae, R.; Food Chem.1984, 15, 219. 19. Harborne, J.B.; J. Chromatogr. 1958, 1, 473. 20. Dekazos, E.D.; J. Food Sci. 1970, 35, 237.
21. Timberlake, C.F.; NATCOL Quarterly Bulletin1988, 1, 4. 22. Oomah, D.; Mazza, G.; J. Agric. Food Chem. 1996, 44, 1746. 23. Merken, H.M.; Beecher, G.R.; J. Agric. Food Chem. 2000, 48,
577.
24. Espin, J.C.; Soler-Rivas, C.; Wichers, H.J.; Garcia-Viguera, C.; J. Agric. Food Chem. 2000, 48, 1588.
Received: July 10, 2003