Article
Printed in Brazil - ©2012 Sociedade Brasileira de Química0103 - 5053 $6.00+0.00
A
*e-mail: [email protected], [email protected]
Determination of Copper in Human Hair and Tea Samples after Dispersive Liquid-Liquid
Microextraction Based on Solidification of Floating Organic Drop (DLLME-SFO)
Soleiman Bahar* and Razieh Zakerian
Department of Chemistry, Faculty of Science, University of Kurdistan, P. O. Box 416, Sanandaj, Iran
Um método simples de microextração líquido-líquido dispersiva com solidificação da gota orgânica flutuante (DLLME-SFO), prévio à espectrometria de absorção atômica em chama, foi usado com sucesso na separação e pré-concentração de cobre em amostras de cabelo humano e chá. O método proposto é simples, barato e altamente preciso. Neste estudo, a otimização de parâmetros experimentais que influenciam a extração, como tipo e volume dos solventes de extração e do dispersor, pH, quantidade de agente quelante e tempo de extração foi realizada normalmente usando uma abordagem passo-a-passo, na qual cada fator variou sequencialmente. O efeito dos íons interferentes na recuperação dos analitos também foi investigado. O gráfico de calibração
foi linear no intervalo de 5-200 ng mL−1, com limite de detecção de 3,4 ng mL−1. O desvio padrão
relativo (RSD) foi 0,7% (n = 10, C = 2 ng mL-1) e o fator de enriquecimento, 28.
A simple method of dispersive liquid-liquid microextraction-solidified floating organic drop (DLLME-SFO) prior to flame atomic absorption spectrometry was successfully used for separating and preconcentrating copper in human hair and tea samples. The proposed method was simple, cheap, and has high precision. In this study, optimization of experimental parameters influencing the extraction, such as type and volume of extraction and disperser solvents, pH, the amount of chelating agent and extraction time was normally carried out using a step-by-step approach, in which each factor was varied sequentially. The effect of the interfering ions on the analytes
recovery was also investigated. The calibration graph was linear in the range of 5-200 ng mL−1
with limit of detection of 3.4 ng mL−1. The relative standard deviation (RSD) was 0.7% (n = 10,
C = 2 ng mL−1) and the enhancement factor was 28.
Keywords:dispersive liquid-liquid microextraction, solidification, copper determination, tea
and human hair analysis
Introduction
Trace heavy metals are essential micro-nutrients and have a variety of biochemical functions in all living organisms.1-3
Due to the positive and negative effects and the toxicity of trace heavy metals on human health and the environment, many researchers are interested in the analysis of trace metal contents of the environmental and the food samples.4-10
Tea, one of the most widely consumed beverages in the world, is prepared from the young leaves of tea plants. It is considered as a healthy drink that has benefits including the prevention of many diseases.11-13 Although copper is an
essential trace element for humans and is an indispensable component for many enzyme systems, Cu can also act as a toxic metal to which a number of pathogenic characteristics
have been attributed.14 Therefore, Cu contamination in tea
leaves remains a concern, and researches should be done to ensure food safety from excessive Cu contamination.
The determination of trace elements in human hair is of basic importance considering that the concentrations of these elements in hair can indicate the levels of these elements in the organism. Therefore, the determination of the metal contents in human hair can be used either as the index of the exposition for potentially toxic elements (poisoning) or as the information of the conditions of health of an individual.15
The accurate and sensitive determinations of trace elements are the important part of analytical chemistry studies.16-18 Flame atomic absorption spectrometry (FAAS)
is relatively simple and available technique in many laboratories for heavy metal determinations.19-24 However,
frequently are not possible. To solve this problem, the preconcentration/separation procedures have been proposed. Preconcentration is a very important issue for achieving of low limits of detection.25-31
Analytical chemists continue to search for sample-preparation procedures that are faster, easier, and less expensive to perform, but provide accurate and precise data with reasonable limits of quantitation.32 Various methods
including liquid-liquid extraction,33,34 solid phase extraction
(SPE),35,36 cloud point extraction (CPE)37,38 and solid phase
microextraction (SPME)39,40 have been developed. However,
recent research trends involve the miniaturization of the traditional liquid-liquid extraction principle. The major idea behind these is the great reduction in the volume ratio of acceptor to donor phase. Liquid phase microextraction (LPME), initially introduced by Lucy in 1996,41,42 has
gained high popularity in organic analysis,43-45 because
it has incorporated sampling, extraction, concentration and sample introduction into a single virtually solvent-free step, and moreover, it has provided high sensitivity and has eliminated the possibility of carry-over effects. From the introduction of the first paper on liquid phase microextraction (LPME), different approaches of LPME such as single drop microextraction (SDME),46,47
hollow fiber liquid phase microextraction (HF-LPME),48
dispersive liquid-liquid microextraction (DLLME),49-51
and solidification of floating organic drop microextraction (SFODME)52,53 have been developed.
In SDME, a drop of organic solvent was suspended at the tip of a microsyringe and exposed to the analytical sample. The principal advantages of this technique were the ranges of solvents that could be used and were easy to collect. However, SDME suffered from the facts that it was time consuming and was significantly affected by the stir rate. The drawbacks were improved by the application of hollow fiber later. In HF-LLME, the extraction was limited by the small surface of the fiber. DLLME was a sample extraction procedure which could be able to provide great enrichment factors and good yields in a simple and fast way. Essentially, DLLME included the rapid addition to an aqueous sample contained in a conical test tube of a mixture of two selected solvents, few microliters of a water-immiscible extraction solvent with high density than water jointly with a disperser solvent with high miscibility in both extractant and water phases, in order to form a cloudy solution consisting of small droplets of extraction solvent which were dispersed throughout the aqueous phase. Because of the very large surface area, formed between the two phases, hydrophobic solutes are rapidly and efficiently enriched in the extraction solvent and, after centrifugation, they could be determined in the phase settled at the bottom of the tube. Despite many
benefits of the most common version of DLLME, the choice of the extraction solvent was its main drawbacks. In DLLME, solvents with the densities higher than water were required and further, they were not often compatible with analytical instruments and it used the extraction solvent with higher toxicity. In SFODME method, a droplet of an immiscible solvent with a melting point of 10-30 °C was floated in the surface of an aqueous sample containing the analytes. The mixture was agitated to maximize contact area between the two solutions. The sample vial was then placed in an ice bath to solidify the droplet which was easily removed and allowed to melt for determination of analyte. This method was simple, accurate and cheap, and has high precision involving minimal consumption of organic solvent. However, the rate of extraction was slow. In 2008, Leong and Huang54,55
reported a novel variation of SFODME called DLLME-SFO; this method was based on the principle of the two methods mentioned previously, which overcame the aforementioned problems. This technique was easily carried out. The large contact surface between the sample and the droplets of extractants speeded up mass transfer, as fast as DLLME and had shorter extraction time than SFODME. To meet recent concerns about the costs and environmental dangers of waste solvent disposal, in this method the low-toxicity extraction solvent 1-dodecanol (1-DD-OH) was used. In this method, there was no need to use conical bottom glass tubes, which were easily damaged and were hard to clean. The floated extractant was solidified and was easily collected for analysis. This version of SFODME has been used for extracting and determining halogenated organic compounds and polycyclic aromatic hydrocarbons from the aqueous sample55,56 and there has been a report on its application on
the extraction of inorganic compounds recently.57,58 In this
study, the possibility of Cu enrichment by dispersive liquid-liquid microextraction, based on solidified floating organic drop (DLLME-SFO), was considered. 8-Hydroxyquinoline (oxine) was selected as the chelating reagent and a DLLME-SFO method, combined with flame atomic absorption spectrometry (FAAS) was used for separating, enriching and determining copper in human hair and tea samples. Factors affecting the extraction efficiency, such as pH, concentration of chelating reagent, extraction time, and nature of the organic solvent were studied and optimized.
Experimental
Apparatus
PHS-25CW microprocessor pH/mV meter, equipped with a combined glass-calomel electrode, was used for determining pH values. A laboratory centrifuge (Heraeus, Labofuge 400 model, Germany) was used to accelerate the phase separation and a Hamilton syringe was used for injecting.
Standard solution and reagents
All reagents and solvents such as (CH3COO)2Cu·H2O,
1-undecanol, 1-dodecanol, 8-hydroxy quinoline (oxine), dimethyl formamide (DMF), methanol, ethanol, acetone, acetonitrile (ACN), chloroform, carbon tetrachloride, sodium chloride and nitric acid were high purity grade reagents from Merck Co. (Darmstadt, Germany). Stock standard solution of Cu2+ at a concentration 1000 µg mL-1
was prepared by dissolving 0.095 g of (CH3COO)2Cu.H2O
in 25 mL double distilled water. Solutions of lower concentrations were prepared daily by a suitable dilution of the stock solution with distilled water. The solution of oxine was prepared by dissolving the appropriate amounts of oxine in methanol. Vessels in the experiments were kept in 10% nitric acid for at least 24 h and subsequently washed with double distilled water. The developed method was successfully applied to real samples. The pH of the sample was adjusted to 4.0 by the use of the phosphate buffer solution (0.1 mol L-1).
Procedure
An amount of 20.0 mL of aqueous solution containing 0.1 µg mL-1 Cu(II) with adjusted pH to 4.0 using phosphate
buffer, was placed in a 40-mL test tube. After 10 min, 0.5 mL of 0.01 mol L-1 8-hydroxy quinoline solution was
added, by using a 5-mL syringe. Then, 0.5 mL ethanol containing 150 µL 1-undecanol was added to the above solution. A cloudy solution, resulting from the dispersion of fine 1-undecanol droplets in the aqueous solution, was formed in the test tube. This turbid solution was centrifuged for 10 min at 3500 rpm leading to aggregate 1-undecanol as a floating drop on the surface of solution. Then, the tube was transferred to a beaker containing crushed ice. After 5 min, the solidified solvent drop was transferred into small beaker where it melted immediately. This phase was diluted to 500 µL with DMF for FAAS determination.
The optimization of theDLLME-SFO sample preparation
method
In the present study, DLLME-SFO, combined with FAAS was used for determining Cu in real samples. In first step, in order to obtain high FAAS signals, the effect of
different parameters influencing the complex formation and extraction conditions, such as type and volume of extractant and disperser solvent, pH, concentration of chelating agent and extraction time, were optimized by usin one variable at a time in the method.
The percent of extraction was calculated as:
where V and C are the volume and concentration, and the suffixes o and aq indicate the organic and aqueous phase, respectively. Co was calculated from the calibration graph
of standard solution of interested metal in DMF.
The extraction and disperser solvents
In order to obtain high recovery and enrichment factor, the selection of organic solvent has an important role in the DLLME-SFO system. The extracting solvent must have low volatility, low water solubility, high solubility in disperser solvent, be capable of formation of cloudy solution in water in the presence of disperser solvent, have a melting point near to room temperature (in the range of 10-30 °C), should not interfere with the analytical techniques used for the determination of analyte, and should not have density lower than water. In the present work, 1-undecanol (mp 13-15 °C) and 1-dodecanol (mp 22-24 °C) were investigated. The disperser solvent in DLLME-SFO must be miscible with both water and extraction solvents. For these purposes, acetone, acetonitrile, methanol and ethanol were tested. The effect of these extraction and disperser solvents on the extraction efficiency of DLLME-SFO was tested by use of 2 mL and 100 µL of each disperser and extraction solvent, respectively.
The volume of the extraction solvent
To examine the effect of extraction solvent volume, the different volumes of 1-undecanol (25, 50, 100, 150, 200 and 250 µL) were subjected to the same DLLME-SFO procedures.
The volume of the disperser solvent
The influence of the volume of ethanol in the ranges of 0.25-3 mL on the extraction efficiency of copper was examined (the volume of 1-undecanol was fixed at 150 µL).
The sample pH
phase. So the effect of sample pH on the extraction of copper was studied by varying the pH within the ranges of 2-12. The pH was adjusted by using either nitric acid or ammonium hydroxide solution (0.1 mol L−1) and keeping
the other variable constant.
The oxine concentration
The variations in the recovery of copper as a function of the concentration of oxine in the ranges of 0.005-0.1 mol L-1
were investigated. The influence of oxine amount was carried out in which the other experimental variables were remained constant.
The amount of salt
In order to investigate the influence of the ionic strength on the DLLME-SFO performance, several experiments were performed with different NaCl concentrations (0.0-5.0%, m/v) while keeping other experimental parameters constant.
The extraction time
In DLLME,61 the extraction time was defined as the
time interval between injecting the mixture of disperser and extraction solvent, and the time starting to centrifuge. The effect of extraction time was examined in the range of 0.25-10 min with constant experimental conditions.
The centrifuging time
Centrifugation is necessary step to obtain two distinguishable phases in the extraction tubes. The effect of centrifuging time on the extraction efficiency was evaluated in the range of 1-10 min at 3500 rpm.
Results and Discussion
The effect of type of the extraction and the disperser solvents
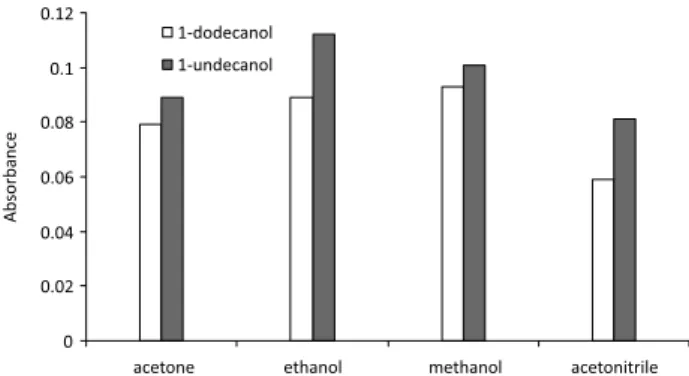
In Figure 1, the absorbance amounts are shown for all combinations of disperser and extraction solvents. Regarding the absorbance signals, the combination of 1-undecanol as extraction solvent with ethanol as disperser solvent was found to give the best extraction efficiency.
The effect of volume of the extraction solvent
As can be seen in Figure 2, low signals were observed when 25 and 50 µL of 1-undecanol were used. This may be
a result of an incomplete extraction (these volumes are not enough to extract all analyte present in standard solution), and the opposite occurs when the volume is too high and the decrease may be a result of the eluent dilution. Therefore, 150 µL of 1-undecanol was selected in order to achieve the higher enrichment factor and the lower limit of detection.
The effect of volume of the disperser solvent
The results showed (Figure 3) that at low volume of ethanol, 1-undecanol was not completely dispersed and the extraction efficiency was low. The absorbance of analyte was maximized in 0.5 mL of ethanol and then decreased with further increase of the ethanol volume. The decrease in the absorbance at high volume of ethanol was due to the increase of solubility of the copper complex in the aqueous solution containing high percentage of ethanol. Thus 0.5 mL of ethanol was used as the optimal volume of the disperser solvent.
The effect of sample pH
Figure 4 shows the influence of the sample pH on the analytical signal intensity. As it is demonstrated, the
Figure 1. The effect of extraction and disperser solvent type on the DLLME-SFO technique. Conditions: 20 mL 0.1 mol L-1 water sample; 2 mL disperser solvent; 100 µL extraction solvent; 0.5 mL of 0.05 mol L-1 oxine solution in methanol; 10 min centrifugation time (3500 rpm).
extraction of copper chelate is maximum at pH 4. The decrease in the extraction of copper at high pH values may be due to the hydrolysis of copper (II) ions.
The effect of oxine concentration
The results showed (Figure 5) that by increasing the amount of oxine, the recovery increases to 0.01 mol L-1.
It seemed that slight reduction of the extraction in higher amount of oxine was due to the extraction of oxine itself, which can easily saturate the small volume of extraction solvent. Therefore, the concentration of 0.01 mol L-1 was
selected for further studies.
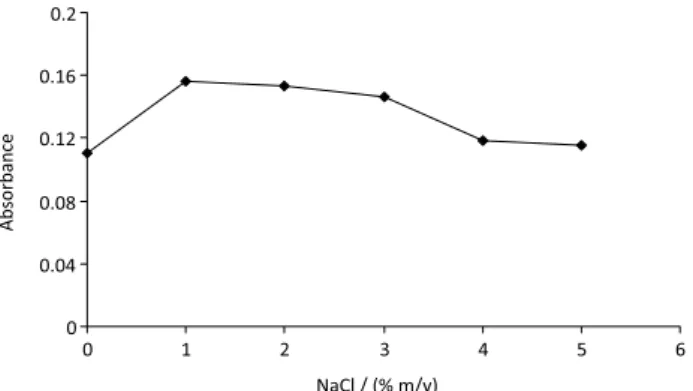
The salt effect
The results indicated (Figure 6) that the salt added up to a concentration of 1.0% (m/v) had significant effect on the extraction efficiency. However, a further increase in the salt concentration caused a decrease in signal absorbance, which could be related to the fact that the addition of salt could restrict the transport of the analytes to the extracting drop due to increase of the sample viscosity. By increasing
salt concentration, the diffusion of analytes towards the organic solvent became more and more difficult.59 In
addition, NaCl dissolved in water might have changed the physical properties of the Nernst diffusion film and reduced the rate of diffusion of the target analytes into the drop.60
Thus, in further experiments, the NaCl concentration was held at 1.0% (m/v).
The effect of the extraction time
As a result, the extraction time had no impact on extraction efficiency. It may happen because of the large contact surface area between the extractor solvent and the aqueous phase. Thereby, transition of analytes from aqueous phase to extraction solvent was fast. In this method, extraction time was very short and the most time-consuming step was the centrifugation.
The effect of centrifuging time
The extraction performance reached its peak when the solution was centrifuged at 3500 rpm for 10 min. When the
Figure 3. Selection of disperser solvent volume. Conditions: 20 mL water sample (0.1 mol L-1), 100 µL extraction solvent, 0.5 mL oxine solution (0.05 mol L-1) in methanol and 10 min centrifugation time (3500 rpm).
Figure 4. Effect of pH on the extraction efficiency of copper (II). Conditions: 20 mL water sample (0.1 mol L-1); 2 mL disperser solvent; 100 µL extraction solvent; 0.5 mL oxine solution (0.05 mol L-1) in methanol; 10 min centrifugation time (3500 rpm).
Figure 6. Effect of amount NaCl on the extraction efficiency of copper (II). Conditions: 20 mL water sample (0.1 mol L-1); 2 mL disperser solvent; 100 µL extraction solvent; 0.5 mL oxine solution (0.05 mol L-1) in methanol; 10 min centrifugation time (3500 rpm).
centrifuging time was longer than 10 min, the absorbance remained constant, so 10 min centrifuging time was chosen in the following study.
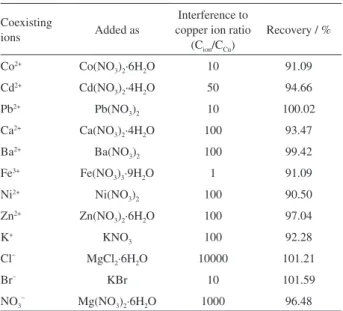
The interferences
In the present study, the interfering ions could affect the extraction recovery of Cu2+ ions by interacting with
oxine or Cu2+ ions. To perform this study, interference ions
in different interference to analyte ratios were added to a 20 mL solution containing 100 µg L−1 of Cu2+ and were
subjected to the recommended procedure. Table 1 shows the tolerance limits of the interference ions (± 10%).
The analytical figures of merit
The figures of merit of the presented method are summarized in Table 2. The precision of the method was calculated as the relative standard deviation of 10 independent measurements, carried out using 2 µg L−1
copper. In order to find linear dynamic range (LDR, which defines as concentration range that a linear relation between signal of FAAS and concentration of the copper ion exists) of the presented method for the copper ion, eight standard solutions were prepared in the distilled water and extracted under the optimal conditions. After the extraction of the copper ion by DLLME-SFO procedure, the floating droplet of 1-undecanol was dissolved in 500 µL of DMF and then injected into FAAS. LDR of 5-200 µg L−1 was obtained. The
limit of detection (S/N = 3) and the correlation coefficient (r) of the calibration curve were 3.4 µg L-1 and 0.999,
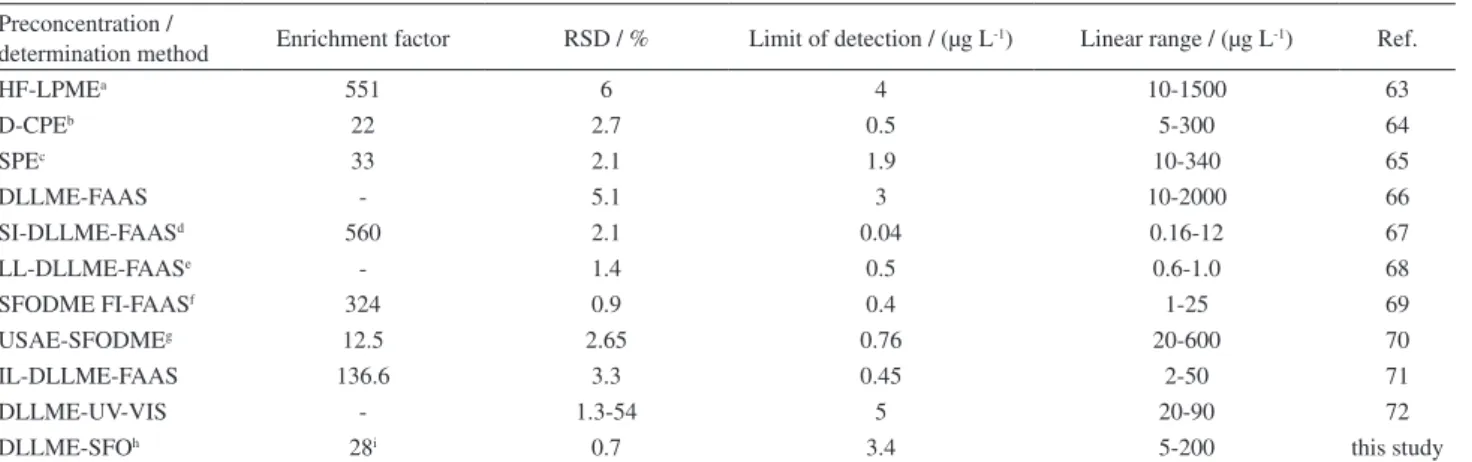
respectively. The enhancement factor calculated as the ratio of the slope of calibration curve of the analytes was found as 28 after preconcentrating to that of prior preconcentration. A comparison of the presented method with the other reported preconcentration methods for the copper extraction and determination is given in Table 3. The precision of the presented method was better than others, but the other parameters were comparable with other methods.
The analysis of real samples
In this study, we determined the copper in various samples (black and green tea and human hair) by using DLLME-SFO method (Table 4). The samples were spiked to assess the matrix effect.
The procedure used for the extraction of these ions from tea sample was similar to that of reported in the literature.62
A sample of 10 mg of the dry tea (dried at 110 oC) was
placed in a 50-mL beaker, followed by the addition of 7 mL of concentrated nitric acid, and the beaker was covered with a glass watch. The beaker was allowed to stand overnight, and the contents were heated on a hot plate (150 oC for
15 min). Then the sample was cooled, 8 mL of perchloric acid was added, and the mixture was heated again at 200 oC
until the solution became clear (about 1 h). The glass watch was removed and the acid evaporated to dryness level at 150 oC. The residue was completely dissolved in 5 mL of
1 mol L-1 nitric acid and the solution was transferred to a
100 mL calibrated flask. Then, the solution was neutralized with a proper NaOH solution and diluted to the mark, and the recommended procedure was followed. The results are given in Table 4.
Accuracy of the proposed method was further proved by analyzing for Cu in black tea with proposed method and an independent LLE-FAAS73 and the results were found
to be 17.48 ± 1.09 (n = 3) and 19.23 ± 2.11 (n = 3) µg g-1,
respectively. A comparison using t-test at 95% confidence interval demonstrated that there was no significant difference among the achieved results using the proposed and the reported method.
Table 1. Effect of interferences ions on preconcentration and determination of copper iona
Coexisting
ions Added as
Interference to copper ion ratio
(Cion/CCu)
Recovery / %
Co2+ Co(NO
3)2·6H2O 10 91.09
Cd2+ Cd(NO
3)2·4H2O 50 94.66
Pb2+ Pb(NO
3)2 10 100.02
Ca2+ Ca(NO
3)2·4H2O 100 93.47
Ba2+ Ba(NO
3)2 100 99.42
Fe3+ Fe(NO
3)3·9H2O 1 91.09
Ni2+ Ni(NO
3)2 100 90.50
Zn2+ Zn(NO
3)2·6H2O 100 97.04
K+ KNO
3 100 92.28
Cl– MgCl
2·6H2O 10000 101.21
Br– KBr 10 101.59
NO3– Mg(NO3)2·6H2O 1000 96.48 aConcentration of Cu2+ ion is 100 µg L-1.
Table 2. The analytical performance characteristics of the DLLM-SFO method for copper determination under the optimized conditions
Parameter
Sample consumption / mL 20
Enhancement factor 28
Linear range / (µg L−1) 5-200
Limit of detection (3 S/N) / (µg L−1) 3.4
Conclusions
The presented DLLME-SFO technique combined with flame atomic absorption spectrometry was shown for the separation and preconcentration of low levels of metal ions in real samples. It has also been shown that the copper-oxine complex can be extracted into 1-undecanol. Furthermore, the DLLME-SFO method permited effective separation and preconcentration of copper, and the final determination by FAAS in several categories of tea and human hair samples. The main benefits of the system were the minimum use of toxic organic solvent consumption, rejection of matrix constituent, simplicity, rapidity, low cost, sensitivity, high enrichment factor, reproducible and linear over a wide range.
Acknowledgments
The authors acknowledge the University of Kurdistan for financial support of this research.
References
1. Saracoglu, S.; Saygi, K. O.; Uluozlu, O. D.; Tuzen, M.; Soylak, M.; Food Chem. 2007, 105, 280.
2. Ferreira, H. S.; dos Santos, W. N. L.; Fiuza, R. P.; Nobrega, J. A.; Ferreira, S. L. C.; Microchem. J. 2007,87, 128.
3. Uluozlu, O. D.; Tuzen, M.; Mendil, D.; Soylak, M.; Food Chem. 2007, 104, 835.
4. Ibrahim, M.; Mahani, R.; Osman, O.; Scheytt, T.; Open Spectrosc. J. 2010, 4, 32.
5. Kazi, T. G.; Jalbani, N.; Arain, M. B.; Jamali, M. K.; Afridi, H. I.; Sarfraz, R. A.; Shah, A. Q.; J. Hazard. Mater. 2009, 163, 302. 6. Kazi, T. G.; Kandhro, G. A.; Afridi, H. I.; Baig, J. A.; Shah, A. Q.;
Wadhwa, S. K.; Khan, S.; Kolachi, N. F.; Shaikh, H. R.; Early Hum. Dev. 2010, 86, 649.
7. Kucukbay, F. Z.; Kuyumcu, E.; Turk. J. Chem. 2010, 34, 911. 8. Soylak, M.; Saraçoğlu, S.; Tüzen, M.; Mendil, D.; Food Chem.
2005, 92, 649.
9. Tuzen, M.; Soylak, M.; J. Hazard. Mater. 2006, 129, 266. 10. Zheng, H.; Chang, X.; Lian, N.; Wang, S.; He, Q.; Lai, S.; Anal.
Chim. 2005, 95, 601.
11. Katharine, P.; Trends Pharmacol. Sci. 2001, 22, 501. 12. Cheng, T. O.; Am. J. Cardiol. 2003, 91, 1290.
13. Hirano, R.; Momiyama, Y.; Takahashi, R.; Taniguchi, H.; Kondo, K.; Nakamura, H.; Ohsuzu, F.; Am. J. Cardiol. 2003, 36, 64. 14. Zietz, B. P.; Dieter, H. H.; Lakomek, M., Schneider, H.;
Kesler-Gaedtke, B.; Dunkelberg, H.; Sci. Total Environ. 2003, 302, 127. 15. Carneiro, M. T. W. D.; Silveira, C. L. P.; Miekeley, N.; Quim.
Nova 2002, 25, 37. Table 3. Comparison of the proposed method with other methods for determining the copper
Preconcentration /
determination method Enrichment factor RSD / % Limit of detection / (µg L-1) Linear range / (µg L-1) Ref.
HF-LPMEa 551 6 4 10-1500 63
D-CPEb 22 2.7 0.5 5-300 64
SPEc 33 2.1 1.9 10-340 65
DLLME-FAAS - 5.1 3 10-2000 66
SI-DLLME-FAASd 560 2.1 0.04 0.16-12 67
LL-DLLME-FAASe - 1.4 0.5 0.6-1.0 68
SFODME FI-FAASf 324 0.9 0.4 1-25 69
USAE-SFODMEg 12.5 2.65 0.76 20-600 70
IL-DLLME-FAAS 136.6 3.3 0.45 2-50 71
DLLME-UV-VIS - 1.3-54 5 20-90 72
DLLME-SFOh 28i 0.7 3.4 5-200 this study
aHollow fiber-liquid-phase microextraction; bdisplacement-cloud point extraction; csolid phase extraction; dsequential injection-dispersive liquid-liquid microextraction-flame atomic absorption spectrometry; eligandless-dispersive liquid-liquid microextraction-flame atomic absorption spectrometry; fsolidified floating organic drop microextraction flow injection-flame atomic absorption spectrometry; gultrasound-assisted emulsification-solidified floating organic drop microextraction; hdispersive liquid-liquid microextraction-solidified floating organic drop; ienhancement factor.
Table 4. Determination of the copper (II) ion in different samples
Sample Conc. / (µg g (n = 3) -1) ± RSD / % Added / (µg g -1) Found / (µg g-1) ± RSD / %
(n = 3) Relative Recovery / %
Human hair (male) 0.31 ± 0.05 2 2.15 ± 0.07 92.0
Human hair (female) 0.67 ± 0.08 2 2.51 ± 0.11 92.0
Black tea 17.48 ± 1.09 10 26.77 ± 0.92 92.9
16. Duran, A.; Tuzen, M.; Soylak, M.; Food Chem. Toxicol. 2010, 48, 2833.
17. Kabadayi, F.; Cesur, H.; Environ. Monit. Assess. 2010, 168, 241.
18. Koyuncu, I.; Akcin, N.; Akcin, G.; Mutlu, K.; Rev. Anal. Chem. 2010, 29, 93.
19. Tuzen, M.; Melek, M.; Soylak, M.; J. Hazard. Mater. 2008, 159, 335.
20. Kandhro, G. A.; Kazi, T. G.; Baig, J. A.; Afridi, H. I.; Shah, A. Q.; Sheikh, H. R.; Kolachi, N. F.; Wadhwa, S. K.; J. AOAC Int. 2010, 93, 1589.
21. Abulhassani, J.; Manzoori, J. L.; Amjadi, M.; J. Hazard. Mater. 2010, 176, 481.
22. He, Q.; Hu, Z.; Jiang, Y.; Chang, X.; Tu, Z. Zhang, L.; J. Hazard. Mater. 2010, 175, 710.
23. Lemos, V. A.; Santos, L. N.; Bezerra, M. A.; J. Food Compos. Anal. 2010, 23, 277.
24. Zhang, L.; Chang, X.; Li, Z.; He, Q.; J. Mol. Struct. 2010, 964, 58.
25. Ghaedi, M.; Shokrollahi, A.; Ahmadi, F.; Rajabi, H. R.; Soylak, M.; J. Hazard. Mater. 2008, 150, 533.
26. Gholivand, M. B.; Ahmadi, F.; Rafiee, E.; Sep. Sci. Technol. 2007, 42, 897.
27. Faghihian, H.; Hajishabani, A.; Dadfarnia, S.; Zamani, H.; Int. J. Environ. Anal. Chem. 2009, 89, 223.
28. Burham, N.; Desalination 2009, 249, 1199.
29. Jiang, X.; Wen, S.; Xiang, G.; J. Hazard. Mater. 2010, 175, 146. 30. Ince, M.; Kaya, G.; Yaman, M.; Environ. Chem. Lett. 2010, 8,
288.
31. Kiptoo, J. K.; Ngila, J. C.; Silavwe, N. D.; J. Hazard. Mater. 2009, 172, 1163.
32. Dadfarnia, S.; Haji-Shabani, A. M.; Anal. Chim. Acta 2010, 658, 107.
33. Oliva, A.; Microchim. Acta 2003, 142, 129.
34. Reddy, B. R.; Priya, D. N.; J. Power Sources 2006, 161, 1428. 35. Safavi, A.; Iranpoor, N.; Saghir, N.; Momeni, S.; Anal. Chim.
Acta 2006, 569, 139.
36. Ersoz, A.; Say, R.; Denizli, A.; Anal. Chim. Acta 2004, 502, 91. 37. Safavi, A.; Abdollahi, H.; Nezhad, M. R. H.; Kamali, R.;
Spectrochim. Acta, Part A 2004, 60, 2897.
38. Manzoori, J. L.; Bavili-Tabrizi, A.; Microchim. Acta 2003, 141, 201.
39. Arthur, C. L.; Pawliszyn, J.; Anal. Chem. 1990, 62, 2145. 40. Zhang, Z.; Yang, M. J.; Pawliszyn, J.; Anal. Chem. 1994, 66,
844A.
41. Lucy, C. A.; Cantwell, F. F.; Anal. Chem. 1989, 61, 101. 42. Lucy, C. A.; Yeung, K. K. C.; Anal. Chem. 1994, 66, 2220. 43. Psillakis, E.; Kalogerakis, N.; J. Chromatogr., A 2001, 907, 211. 44. Tankeviciute, A.; Kazlauskas, R.; Vickackaite, V.; Analyst 2001,
126, 1674.
46. He, Y.; Lee, H. K.; Anal. Chem. 1997, 69, 4634.
47. Wang, Y.; Kwok, Y. C.; He, Y.; Lee, H. K.; Anal. Chem. 1998, 70, 4610.
48. Pedersen-Bjergaard, S.; Rasmussen, K. E.; Anal. Chem. 1999, 71, 2650.
49. Rezaee, M.; Assadi, Y.; Milani Hosseini, M. R.; Aghaee, E.; Ahmadi, F.; Berijani, S.; J. Chromatogr., A 2006, 1116, 1. 50. Chen, H.; Chen, H.; Ying, J.; Huang, J.; Liao, L.; Anal. Chim.
Acta 2009, 632, 80.
51. Hu, J.; Fu, L.; Zhao, X.; Liu, X.; Wang, H.; Wang, X.; Dai, L.; Anal. Chim. Acta 2009, 640, 100.
52. Khalili Zanjani, M. R.; Yamini, Y.; Shariati, S.; Jonsson, J. A.; Anal. Chim. Acta 2007, 585, 286.
53. Dadfarnia, S.; Haji-Shabani, A. M.; Kamranzadeh, E.; Talanta 2009, 79, 1061.
54. Leong, M. I.; Huang, S.D.; J. Chromatogr. A 2008, 1211, 8. 55. Leong, M. I.; Huang, S. D.; J. Chromatogr., A 2009, 1216, 7645. 56. Xu, H.; Ding, Z.; Lv, L.; Song, D.; Feng, Y. Q.; Anal. Chim.
Acta 2009, 636, 28.
57. Yamini, Y.; Rezaee, M.; Khanchi, A.; Faraji, M.; Saleh, A.; J. Chromatogr., A 2010, 1217, 2358.
58. Asadollahi, T.; Dadfarnia, S.; Haji Shabani, A. M.;Talanta 2010,82, 208.
59. Lambropoulou, D. A.; Albanis, T. A.; J. Chromatogr., A 2004, 1049, 17.
60. Bagheri, H.; Saber, A.; Mousavi, S. R.; J. Chromatogr., A 2004, 1046, 27.
61. Berijani, S.; Assadi, Y.; Anbia, M.; Hosseini, M. R. M.; Aghaee, E.; J. Chromatogr., A 2006, 1123, 1.
62. Ichinoki, S.; Yamazaki, M.; Anal. Chem. 1985, 57, 2219. 63. Eshaghi, Z.; Azmoodeh, R.; Arab. J. Chem. 2010, 3, 21. 64. Gao, Y.; Wu, P.; Li, W.; Xuan, Y.; Hou, X.; Talanta 2010, 81, 586. 65. Ghaedi, M.; Niknam, K.; Taheri, K.; Hossainian, H.; Soylak,
M.; Food Chem. Toxicol. 2010, 48, 891.
66. Farajzadeh, M. A.; Bahram, M.; Ghorbani Mehr, B.; Jönsson, J. Å.; Talanta 2008, 75, 832.
67. Anthemidis, A. N.; Ioannou, K. I. G.; Talanta 2009, 79, 86. 68. Mohammadi, S. Z.; Afzali, D.; Baghelani, Y. M.; Anal. Chim.
Acta 2009,653, 173.
69. Sahin, C. A.; Tokgoz, I.; Anal. Chim. Acta 2010, 667, 83. 70. Chang, Q.; Zhang, J.; Du, X.; Ma, J.; Li, J.; Front. Environ. Sci.
Engin. China 2010, 4, 187.
71. Khani, R.; Shemirani,F.; Majidi,B.; Desalination 2011, 266, 238.
72. Skrlikova, J.; Andruch, V.; Balogh, I. S.; Kocurova, L.; Nagy, L.; Bazeľ, Y.;Microchem. J. 2011, 99, 40.
73. Mat, H. B.; Seng, T. B.; Selective Liquid-Liquid Extraction of Precious Metals from Semiconductor Wastes, University Teknologi: Malaysia, 2006.
Submitted: December 20, 2011