N
ota
T
éc
ni
ca
*e-mail: [email protected]
QUANTITATIVE DETERMINATION OF ACETAMINOPHEN, PHENYLEPHRINE AND CARBINOXAMINE IN TABLETS BY HIGH-PERFORMANCE LIQUID CHROMATOGRAPHY
Carina de A. Bastos e Marcone A. L. de Oliveira*
Departamento de Química, Universidade Federal de Juiz de Fora , 36036-330 Juiz de Fora - MG, Brasil
Recebido em 30/9/08; aceito em 27/3/09; publicado na web em 10/8/09
An alternative methodology for analysis of acetaminophen (Ace), phenylephrine (Phe) and carbinoxamine (Car) in tablets by ion-pair reversed phase high performance liquid chromatography was validated. The pharmaceutical preparations were analyzed by using a C18 column (5 µm, 300 mm, 3.9 mm) and mobile phase consisting of 60% methanol and 40% potassium monobasic phosphate aqueous solution (62.46 mmol L-1) added with 1 mL phosphoric acid, 0.50 mL triethylamine and 0.25 g sodium lauryl sulfate.
Isocratic analysis was performed under direct UV detection at 220 nm for Phe and Car and at 300 nm for Ace within 5 min. Keywords: acetaminophen; phenylephrine; carbinoxamine.
INTRODUCTION
Common colds are a viral disease caused mainly by rhinovirus and coronavirus, consisting of an acute infection of the upper respiratory system mucosa. Infection occurs mainly through direct contact and rarely through sputter, sneezing and cough. Infected people spread the etiologic agent by respiratory secretion such as nasal mucus, which infects hands and objects. The common cold is normally harmless and generally disappears within one or two weeks unless secondary bacterial infection is diagnosed. Once no speciic treatment can be given, the usual procedure consists of alleviating the symptoms. The symptomatic treatment is based on the prescription of drugs that al-leviate the nasal congestion, dry the mucous membranes and reduce both temperature and pain. This is achieved through drug combination since no single drugs can have all these effects. The pharmaceutical association is often used as they offer a more convenient treatment than single ones.1 Some drugs currently available combine three
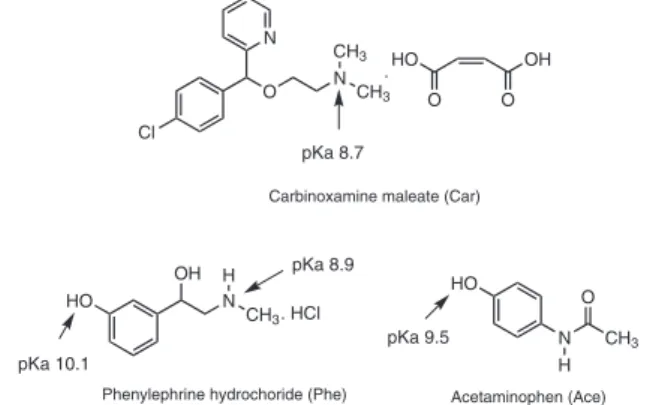
pharmaceuticals: acetaminophen (Ace), an analgesic and antipyre-tic; phenylephrine hydrochloride (Phe), a nasal decongestant; and carbinoxamine maleate (Car), an anti-histamine. Figure 1 shows the chemical structure for the three compounds.
Among the classical analytical methodologies used for analysing these pharmaceuticals are: titrimetry,2 spectrometry UV-Visible,2,3
capillary electrophoresis4-6 and high performance liquid
chromato-graphy (HPLC).7-18
As regards HPLC methodologies, Barbas et al.16 developed a
method for the determination of acetaminophen, phenylephrine hydrochloride and chlorpheniramine maleate using two cyanopropyl columns, a constant proportion of aqueous organic solvent (95:5, v/v) under a gradient of pH from 7.5 to 2.0 with analysis time of 14 min. Shervington et al.18 optimized a method for the determination
of acetaminophen and ive of its substituted derivatives by reversed phase chromatography system in isocratic mode using mobile phase constituted of water and acetonitrile (70:30, v/v). Erk et al.13 proposed
an alternative methodology for determining chorpheniramine maleate and phenylephrine hydrochloride using UV detection at 269 nm and reversed phase in isocratic mode. Lau and Mok14 developed a
me-thod for the determination of eight active ingredients in cough-cold syrups, including phenylephrine hydrochloride, using a cyano column and water, acetonitrile and ethanol (36:60:2) containing 1 mmol L-1
perchloric acid as the mobile phase within 22 min.
To our knowledge, the methods described in the literature do not cover the analysis of the association Ace/ Phe and Car/Ace. Therefore, the main contribution of this work was to develop a single separation method for analyzing two different pharmaceutical associations. This method can also be used as a tool in the quality control process of pharmaceutical industry or as an alternative analytical monitoring procedure, which can be used by the supervisory agencies such as Agência Nacional de Vigilância Sanitária (ANVISA). Within this context, a simple alternative methodology for determination of these drugs in tablets using an isocratic chromatographic mode in analysis time of 5 min was proposed. After parameter validation, the method proved to be successful and was applied to the analysis of commercial products containing these active ingredients.
EXPERIMENTAL
Material
Reagents and chemicals
Methanol was of chromatographic grade and all other chemicals were of analytical grade. Phosphoric acid, potassium phosphate monobasic, methanol, ethanol, triethylamine and sodium lauryl sulfate were purchased from Vetec (Rio de Janeiro, RJ, Brazil). Water was puriied with Milli-Q®, Milipore System. All solvents and
solutions were iltered through a 0.45 µm millipore ilter (Milipore® millex-HV ilter units) (São Paulo, SP, Brazil).
Figure 1. Chemical structure of Ace, Phe and Car
HO N
CH3
OH H
. HCl Cl
O N
CH3
CH3
HO
N H O
CH3
N
HO
O
OH
O .
pKa 9.5 pKa 10.1
pKa 8.9 pKa 8.7
Acetaminophen (Ace) Carbinoxamine maleate (Car)
The following excipients were purchased from Medquímica (Juiz de Fora, MG, Brazil): pregelatinized starch, povidone, stearic acid, microcrystalline cellulose 102, glycolate starch sodium, opadry II 85F19193 translucent, titanium dioxide and 10 yellow dye lacquer (commercial product 1) and pregelatinized starch, povidone, stearic acid, microcrystalline cellulose 102, opadry II 85F19193 translucent, titanium dioxide and yellow dye lacquer 06 (commercial product 2).
Phenylephrine hydrochloride (Phe) (99.9%) and carbinoxamine maleate (Car) (100.0%) were purchased from American Pharmaco-poeia (Rockville, MD, USA). Acetaminophen (Ace) (99.8%) was purchased from Brazilian Pharmacopoeia (Rio de Janeiro, RJ, Brazil). Samples
Twenty tablets of commercial product 1 (CP1) (20.0 mg Phe and 400.0 mg Ace) and commercial product 2 (CP2) (4.0 mg Car and 400.0 mg Ace) were purchased from local pharmacies (Juiz de Fora, MG, Brazil).
Instrumentation
HPLC system: The experiments were performed in a high perfor-mance liquid chromatography model Waters 1525 (Milford, (MA), USA) equipped with a photo diode array detector model 2996, a temperature control device maintained at 27 °C and data acquisition and treatment software (Empower Build 1154).
Column: The analytical column was a reversed phase Luna Phenomenex C18 (5 µm, 300 mm x 3.9 mm) (Torrance, CA, USA). Methods
Sample preparations
Twenty tablets of CP1 and CP2 purchased from local pharmacies were separately weighed and ground to homogeneously ine powders. The powder corresponding to CP1 (20.0 mg Phe and 400.0 mg Ace) and CP2 (4.0 mg Car and 400.0 mg Ace) were weighed and dissolved with 100.0 mL of mobile phase in a separate volumetric lask. Five mL of these solutions were diluted again with mobile phase in another 50 mL volumetric lask and iltered through a 0.45 µm millipore ilter in order to obtain clear solutions.
Chromatographic conditions
All analyses were performed at room temperature (about 25 °C) under isocratic conditions. A mobile phase consisted of 60% methanol and 40% potassium monobasic phosphate aqueous solution (62.46 mmol L-1) added with 1.0 mL phosphoric acid, 0.50 mL triethylamine
and 0.25 g sodium lauryl sulfate (pH of the whole mixture equal 4.10). Flow rate was 1.0 mL min-1 and volume injection was 50 µL.
The UV detection was set at 220 for Car and Phe and at 300 nm for Ace. At the beginning of the day, mobile phase was pumped through the HPLC system during 30 min until achieving baseline stability. Wavelength selection
The wavelength selection was based on UV-Visible spectra ob-tained for each compound by means of diode array detector in HPLC system. The wavelengths were selected at 220 for Phe and Car and at 300 nm for Ace (Ace at 220 nm present offset peak signal saturated), as the three compounds presented acceptable peak signal for sample analysis in these wavelengths.
Standard solution preparation
Accurately weighed amounts of standards of Car and Phe equiva-lent to 40.0 and 50.0 mg were transferred to separate volumetric lasks containing volume of 100.0 (solution 1) and 50.0 (solution 2) mL, respectively; 40.0 mg of Ace accurately weighed were transferred to
volumetric lask of 100.0 mL containing 1.0 mL of the solution 1 and 2.0 mL of the solution 2, forming the standard solution. All volumes were completed with mobile phase. Final concentrations were 4.0, 20.0 and 400.0 mg L-1 for Car, Phe and Ace, respectively. Standard
solution was iltered through a 0.45 µm millipore ilter and diluted with mobile phase in order to obtain clear solutions.
Calibration curves
The following concentrations levels for: Car (3.2, 3.6, 4.0, 4.4 and 4.8 mg L-1); Phe (16.0, 18.0, 20.0, 22.0, 24.0 mg L-1)and Ace
(320.0, 360.0, 400.0, 440.0, 480.0 mg L-1) were obtained from each
standard solution, conveniently diluted with mobile phase in presence of the excipients. Each solution was injected in the chromatographic system (n=3) and mean values of peak areas were plotted against concentration. The curves were itted by linear regression with least mean square method.
RESULTS AND DISCUSSION
Preliminary study
In order to investigate the method for drug analysis in pharmaceu-tical formulations, preliminary tests were performed to select optimal conditions. Parameters such as detection wavelength, ideal mobile phase and their proportions, optimum pH and standard solution concentration were exhaustively studied. Several binary or ternary eluents were tested using different proportions of solvent, such as acetonitrile, methanol and water. However, satisfactory results were achieved through the ion-pair reversed phase liquid chromatography (IRPLC) using sodium lauryl sulfate as ionic pair reagent. IRPLC was investigated as an alternative, based on the work described in the American Pharmacopeia for chlorpheniramine maleate analysis associated with phenylpropanolamine hydrochloride.7 In the present
case, potassium phosphate monobasic and phosphoric acid were used for pH adjustment (≈ 4.10) and to promote ionic pair formation of
the basic solutes with the counter ion. Methanol was used as an or-ganic modiier and triethylamine was employed to reduce the tailing factor of the basic solutes, caused by the interaction between these compounds and the free silanol groups in the C18 surface column.
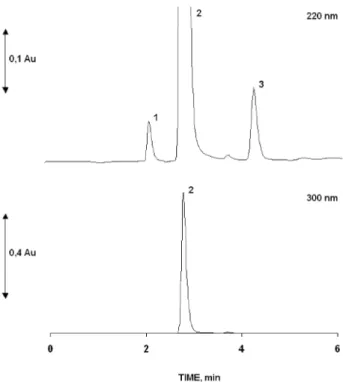
Figure 2 shows the chromatogram for standard mixture obtained through the optimized variables in accordance with the features des-cribed above. The baseline separation of standard mixture through isocratic mode within 5 min was achieved. The sample loop size was set at 50 µL in order to optimize the Car signal, which was in a concentration much smaller than Ace in the sample. Mobile phase low was adjusted at 1.0 mL min-1 in order to maintain pressure within
the acceptable limit of the chromatographic system.
Table 1 shows analytical parameters such as resolution (R), efi-ciency (N), asymmetry (A/B), and relative retention (α) obtained for
the optimal conditions. Validation procedures
After adjusting the chromatography conditions, some validation parameters for CP1 and CP2, such as selectivity, linearity, precision, limit of detection (LOD), limit of quantiication (LOQ), accuracy and robustness, were determined, as Resolution ANVISA RE no 899, of
29/05/2003.19
Selectivity and linearity
using diode array detector. The analyte chromatographic peak was not found to be attributable to more than one component.19,20
Linearity was evaluated taking into account the correlation coe-ficient (r). The correlation coecoe-ficient equal to or higher than 0.99 is considered evidence of ideal data itting to line regression performed through least-square treatment.19 In order to evaluate lack of it of
the regression, Shapiro-Wilk Normality Test was performed for the residues.21 As the p-value calculated was higher than 0.05, the residue
distribution is considered normal and the model is linear within the range evaluated (Table 2).
Precision, limit of detection (LOD) and limit of quantiication (LOQ)
Precision can be determined through the estimate of the relative standard deviation (RSD).19 The precision in the validation of this
optimized method was performed at two levels: repeatability and intermediate precision.
Repeatability (n=6) in sample area was carried out for 100.0% of the test concentration. In the present case, concentrations at 4.0, 20.0 and 400.0 mg L-1 for Car, Phe and Ace, respectively were used.
Intermediate precision (n=6) was performed on different days. All results presented acceptable precision values (not exceeding 5.00%)19
as shown in Table 3.
LOD and LOQ were calculated by means of the standard devia-tion ratio of the intercept of three calibradevia-tion curves obtained from linearity by means of the slopes of the respective curves multiplied by 3 and 10, respectively.19 LOD and LOQ obtained presented
acceptable values for sample analysis as presented in Table 3.
Accuracy
Accuracy, in the present case, was calculated as the percentage of recovery by the assay of the known added amount of analyte in the sample.19,20 Thus, recovery tests were performed by adding known
amounts of standard in the sample at ive levels of concentrations for each drug, as shown in Table 5. For accuracy test, mean recovery percentage (R%) was 100.0 ± 2.0% and single R% concentration was 100.0 ± 5.0% (Table 4). The results obtained show that the method presents acceptable accuracy.
Robustness
The robustness was evaluated by intentional minor modiications in the chromatographic conditions in the proposed methodology.19
Within this context, the parameters selected to evaluate robustness
Figure 2. Chromatograms for standard mixture of (1) Car, 4.0 mg L-1; (2) Ace,
400.0 mg L-1; and (3) Phe, 20.0 mg L-1 using photo diode array detector set at
220 and 300 nm. Operational conditions as indicated in the experimental part
Table 1. Analytical parameters such as resolution (R), eficiency (N), asymmetry (A/B), and relative retention (α) obtained for the
developed method
Acea Phea Aceb Carb
Rc 7.0* 3.5*
7.0** 3.5**
αc 3.2* 3.1*
3.2** 3.1**
A/Bc
1.4* 1.2* 1.3* 1.4*
1.4** 1.3** 1.3** 1.4**
Nc 2965* 4550* 3006* 2644*
2911** 4325** 2992** 2673**
aCommercial product 1, acommercial product 2, cMean (n=6),
*Stan-dards; **standards + pharmaceutical excipients
Table 2. Statistical results obtained from linearity calculation (stan-dards + pharmaceutical excipients)
Slope Intercept r p-valuec
Acea 10269
(±74.76)
202535
(±29897) 0.999 0.100
Phea 79256
(±736.05)
24714
(±15009) 0.999 0.365
Aceb 10647
(±136.33)
22813
(±54791) 0.999 0.294
Carb 74177
(±2818.00)
23050
(±11480) 0.998 0.937
aCommercial product 1, bcommercial product 2, cShapiro-Wilk
Normality Test
Table 3. RSD (%) in concentration found for samples obtained from repeatability and intermediate precision. LOD and LOQ values (mg L-1)
Acea Phea Aceb Carb
Repeatabilityc 0.56* 0.64* 0.04* 0.24*
0.07** 0.14** 0.07** 0.31**
Intermediate precisionc
2.31* 0.83* 0.49* 1.10*
1.72** 1.37** 0.52** 0.24**
LOD 12.50** 0.36** 20.95** 0.99**
LOQ 41.69** 1.18** 69.86** 3.10**
aCommercial product 1, bcommercial product 2, cMean (n=6),
were: mobile phase, low rate and pH. Table 6 shows the experiments performed for robustness evaluation. It is important to remember that for commercial product1 the maximum low rate was set at 1.0 ml min-1 in order to maintain pressure lower than 3000 psi. All parameters
were performed in six replicates. For the robustness test, the recovery achieved remained within the interval of 100.0 ± 5.0% as shown in Table 5. Therefore, little variations in the chromatographic parameters
Table 5. Robustness results for commercial product 1 and 2 calculated as the percentage of recovery
Experiments 1 2 3 Acea Phea Aceb Carb
Ac - 0 0 100.2 103.1 100.6 102.5
Bc + 0 0 101.3 101.6 99.8 102.9
Cc 0 - 0 100.0 101.0 98.7 95.9
Dc 0 + 0 99.4 101.2 98.2 99.9
Ec 0 0 - 101.6 98.4 100.3 100.3
Fc 0 0 + 100.7 97.0 100.7 102.1
Gc 0 0 0 101.4 102.8 100.0 98.5
1- Mobile phase (%MeOH): (-) 55; (0) 60; (+) 65; 2- Flow (mL min-1): (-) 0.7; (0) 1.0; (+) 0.4a/ 1.3b ; 3- pH: (-) 3.1; (0) 4.1; (+) 5.1. a
Com-mercial product 1, bcommercial product 2, cMean (n=6)
Table 4. Recovery data of standard solutions added to the samples analyzed using the proposed HPLC method
Added amount (mg) Found amount c Recovery (%)
Acea
317.57 321.29 ± 0.82 101
357.27 367.27 ± 0.17 103
396.97 396.02 ± 0.99 100
436.66 438.62 ± 0.47 100
476.36 469.31 ± 0.07 99
101d
Phea
15.91 16.13 ± 0.45 101
17.90 17.80 ± 0.31 99
19.89 20.04 ± 0.15 101
21.88 22.46 ± 0.31 103
23.87 23.94 ± 1.10 100
101d
Aceb
318.34 316.68 ± 0.10 99
358.14 360.83 ± 0.11 101
397.93 398.73 ± 0.03 100
437.72 434.61 ± 0.04 99
477.52 470.45 ± 0.06 99
100d
Carb
3.23 3.37 ± 0.49 104
3.63 3.63 ± 0,76 100
4.03 3.94 ± 0.20 98
4.44 4.28 ± 0.93 96
4.84 4.66 ± 0.85 96
99d aCommercial product 1, bcommercial product 2, cMean (n=3); dmean of recovery range
such as mobile phase, low rate and pH were found to be acceptable values in relation to the reference value.
Quantitative determination in pharmaceutical preparations purchased from local pharmacies
After evaluating some validation parameters, the optimized method was applied to the sample analysis obtaining 19.9 mg (± 7.1 x10⁻²%) of Phe and 396,1 mg (± 4.0 x10⁻³%) of Ace for CP1 and
3,9 mg (± 1.8 x 10⁻¹%) of Car and 402,4 mg (± 9.0 x 10⁻²%) of Ace
for CP2 as results. Figure 3 shows the chromatograms obtained to samples analyzed.
CONCLUSIONS
The simultaneous separation of Ace, Phe and Car by isocratic ion-pair reversed phase liquid chromatography has been achieved. All validation parameters of the method optimized have obeyed the variation limits permitted. Therefore, the validated method can be useful for quality assurance in the pharmaceutical industry of these preparations, presenting a simple mobile phase system, short analysis
time, and simple step of sample preparation as advantages in com-parison with the methods described in the literature.
ACKNOWLEDGMENTS
The authors wish to acknowledge the Medquímica Indústria Farmacêutica Ltda, Coordenação de Aperfeiçoamento de Pessoal de Nível Superior (CAPES), Conselho Nacional de Desenvolvimento Cientíico e Tecnológico (CNPq - 476386/2007-1 and 300593/2008-2) and Fundação de Amparo à Pesquisa do Estado de Minas Gerais of Brazil (FAPEMIG – CEX-APQ 1906-5.02-07 and CEX-APQ 01837/08) for fellowships and inancial support.
REFERENCES
1. Korolkovas, A.: França, F. F. A. C.; Dicionário Terapêutico Guanabara, 15th ed., Guanabara Koogan S.A.: Rio de Janeiro, 2008.
2. Brazilian Pharmacopeia, 3rd ed., Andrei: São Paulo, 1977.
3. Brazilian Pharmacopeia, 4th ed., Atheneu: São Paulo, 1988.
4. Marin, A.; Barbas, C.; J. Pharm. Biomed. Anal. 2004, 35, 769. 5. Marchesini, A. F.; Williner, M. R.; Mantovani, V. E.; Robles, J. C.;
Goicoechea, H. C.; J. Pharm. Biomed. Anal. 2003, 31, 39.
6. Okamoto, H.; Nakajima, T.; Ito, Y.; Aketo, T.; Shimada, K.; Yamato, S.; J. Pharm. Biomed. Anal. 2005, 37, 517.
7. United States Pharmacopeia, 29th ed., United States Pharmacopeial
Convention: Rockville, 2005.
8. Marín, A.; García, E.; García, A.; Barbas, C.; J. Pharm. Biomed. Anal. 2002, 29, 701.
9. Ravisankar, S.; Vasudevan, M.; Gandhimathi, M.; Suresh B.; Talanta 1998, 46, 1577.
10. Marín, A.; Espada, A.; Vidal, P.; Barbas, C.; Anal. Chem. 2005, 77, 471. 11. Gil-Agustí, M.; Garcia-Alvarez-Coque, M. C.; Esteve-Romero, J.; Anal.
Chim. Acta 2000, 421, 45.
12. Qi, M.; Wang, P.; Chen, J.; Chromatographia 2004, 60, 105. 13. Erk, N.; Kartal, M.; l Fármaco 1998, 53, 617.
14. Lau, O.; Mok, C.; J. Chromatogr., A 1995, 693, 45.
15. García, A.; Rupérez, F. J.; Marín, A.; Maza, A. D. L.; Barbas, C.; J. Chromatogr., B 2003, 785, 237.
16. Olmo, B.; García, A.; Marín, A.; Barbas, C.; J. Chromatogr., B 2005, 817, 159.
17. Gumbhir, K.; Mason, W. D.; J. Pharm. Biomed. Anal. 1996, 14, 623. 18. Shervington, L. A.; Sakhnini, N.; J. Pharm. Biomed. Anal. 2000, 24, 43. 19. Agência Nacional de Vigilância Sanitária (ANVISA); Resolução RE no
899, de 29/05/2003.
20. International Conference Harmonisation (ICH); Validation of Analytical Procedures: Methodology, Q2B (CPMP/ICH/281/95), 1995.
21. Montgomery, D. C.; Design and Analysis of Experiments, 6th ed., Wiley,