*Correspondence: T. M. Pedroso. Universidade Estadual Paulista. Rodo-via Araraquara-Jaú, km 1, 14801-902 – Araraquara - SP, Brasil. Phone: 55-16-33016967, Fax 55-16-33016900. E-mail: [email protected]
http://dx.doi.org/10.1590/S1984-82502011000100022
Validation of analytical methodology for quantification of cefazolin
sodium pharmaceutical dosage form by high performance liquid
chromatography to be applied for quality control in pharmaceutical
industry
Tahisa Marcela Pedroso
*, Hérida Regina Nunes Salgado
Department of Drugs and Pharmaceuticals, School of Pharmaceutical Sciences, University of the State of São Paulo “Júlio de Mesquita Filho”, Araraquara, SP, Brazil
A reversed-phase high performance liquid chromatography method was validated for the determination of cefazolin sodium in lyophilized powder for solution for injection to be applied for quality control in pharmaceutical industry. The liquid chromatography method was conducted on a Zorbax Eclipse Plus C18
column (250 x 4.6 mm, 5 μm), maintained at room temperature. The mobile phase consisted of puriied water: acetonitrile (60: 40 v/v), adjusted to pH 8 with triethylamine. The low rate was of 0.5 mL min-1
and efluents were monitored at 270 nm. The retention time for cefazolin sodium was 3.6 min. The
method proved to be linear (r2=0.9999) over the concentration range of 30-80 µg mL-1. The selectivity of the method was proven through degradation studies. The method demonstrated satisfactory results for precision, accuracy, limits of detection and quantitation. The robustness of this method was evaluated using the Plackett–Burman fractional factorial experimental design with a matrix of 15 experiments and the statistical treatment proposed by Youden and Steiner. Finally, the proposed method could be also an advantageous option for the analysis of cefazolin sodium, contributing to improve the quality control
and to assure the therapeutic eficacy.
Uniterms: Cefazolin sodium/determination. High performance liquid chromatography/reverse-phase/
quantitative analysis. Pharmaceutical industry/quality control. Cefalosporine/quality control. Medicines/ quality control.
Um método cromatográico em fase reversa foi validado para a determinação de cefazolina sódica em pó lioilizado, a ser aplicado no controle de qualidade em indústrias farmacêuticas. O método por cromatograia líquida foi conduzido em coluna Zorbax Eclipse Plus C18 (250 × 4,6 mm, 5 µm) mantida à temperatura ambiente. A fase móvel consistiu de água puriicada: acetonitrila (60 : 40 v/v), com o pH ajustado para 8 com trietilamina. A vazão usada foi de 0,5 mL min-1 e os analitos de interesse foram
monitorizados a 270 nm. O tempo de retenção da cefazolina sódica foi de 3,6 min. As áreas dos picos de cefazolina sódica foram lineares na faixa de concentração de 30-80 µg mL-1 (r2 = 0,9999). A seletividade do
método foi demonstrada através de estudos de degradação. O método demonstrou resultados satisfatórios para precisão, exatidão, limites de detecção e de quantiicação. A robustez do método foi avaliada
utilizando o esquema fatorial de Plackett-Burman com uma matriz de 15 experimentos simultâneos,
e analisados por tratamento estatístico proposto por Youden e Steiner. Finalmente, o método proposto pode ser também uma opção de êxito para a análise de cefazolina sódica, contribuindo para o controle de qualidade e para garantir a eicácia terapêutica.
Unitermos: Cefazolina sódica/determinação. Cromatograia líquida de alta eiciência/fase reversa/ análise quantitativa. Indústria farmacêutica/controle de qualidade. Cefalosporina/controle de qualidade.
INTRODUCTION
S i n c e t h e i r d i s c o v e r y b y B r o t z u i n 1 9 4 8 , cephalosporins maintain themselves as a class of antimicrobials that stands out for their high therapeutic importance and frequency of use, because of their safety and very effective use against a large variety of microbial agents (Brunton et al., 2012). Cefazolin
sodium (CFZ) is a β-lactam semi synthetic antibiotic classiied as a irst-generation cephalosporin; it has been commercially available since 1970, only in the form of pharmaceutical powder for injectable solution, not having oral absorption (Bolós et al., 1987). Its use in
clinical practice is distinguished for being used worldwide and keeping more than 40 years as a drug of choice for preoperative prophylaxis of various surgical procedures (Kusaba, 2009). Considering that it can be administered less frequently because of its longer half-life, a single dose of cefazolin immediately before surgery is the most widely used prophylaxis (Brunton et al., 2012),
and reduces the incidence of infections that may pose serious complications in patients undergoing surgery (Wang et al., 2004).Although the antibacterial spectrum of cefazolin sodium is the typical of other irst-generation cephalosporins, it prevails by demonstrating activity against Enterobacter, which makes it favorite among cephalosporins from this group (Kusaba, 2009; Brunton
et al., 2012).
High performance liquid chromatography is a very common separation technique and broadly used for antibiotic quantiication. That a large number of methods using high performance liquid chromatography is available in the literature stems from the numerous advantages that the method provides (Salgado et al., 2005; Tozo, Salgado,
2006; Moreno, Salgado, 2008; Lopes, Salgado, 2009; Bonilio et al., 2009; Cazedey et al., 2011; Corrêa et al., 2012; Silva, Salgado, 2012). Many methods described for CFZ up to the moment are directed to its quantiication in biological matrices (Wold, 1977; Bayoumi et al., 1986;
Nahata, 1990; Liang et al., 1994; Bompadre et al., 1998;
Al-Rawithi et al, 2000; Samer, et al., 2000; Tsai, Chen,
2000; Arayne et al., 2007; Farthing et al., 2008), requiring
pretreatment of the sample, among other slow procedures, requiring sophisticated equipment and high costs and using large amounts of organic solvents which are toxic for the operators and for the environment. Few studies were validated for quantiication of CFZ in pharmaceutical form (Moore et al., 1991; Pinto et al., 1995; Farag, 1998;
Shinde et al., 1998; Lalith et al., 2010), for the control
of drug quality post-production, to be performed by the industry providing security for the user.
Studies focused on the development and reinement of analytical methodologies are crucial for optimization of laboratory tests carried out in the pharmaceutical industry, for adjusting the dosage and thus avoiding toxicity and development of resistant microorganisms, to thereby ensure the efficacy and safety of the consumer. In this context different chromatographic systems were tested in order to find favorable conditions to develop a new analytical method, for the quantiication of CFZ injectable solution, capable of ensuring therapeutic eficacy of the marketed drug globally.
The validated HPLC method is simple, fast and versatile, therefore, it can be employed in routine quality control analyses of the pharmaceutical industry, reducing the analysis time, reducing the use of solvents due to low retention time, reducing residue generated and consequently presenting lower costs is which justiies the strategy adopted in this study.
MATERIAL AND METHODS
Chemicals
CFZ reference substance (purity 98.2 %) and CFZ lyophilized injectable form containing 1000 mg of the active component, were kindly donated by the Laboratory ABL Antibióticos do Brasil Ltda (Cosmopolis-SP, Brazil). The vials did not present excipients.
All solutions and mobile phases used in this assay were prepared from ultrapure water obtained from a Milli-Q Plus (Millipore, USA). HPLC grade acetonitrile used in the preparation of the mobile phase was purchased from J.T. Baker (Mexico). All other Chemicals were of analytical grade.
Apparatus
The HPLC method was performed on a Waters LC system (Waters Corporation, Milford, MA) equipped with a Waters 1525 binary pump, a Rheodyne Breeze 7725i manual injector and a Waters 2487 UV detector. The peak areas were integrated automatically by a computer using the Empower software program.
The chromatographic separation was carried out under isocratic reversed phase conditions on an Agilent™ Zorbax Eclipse Plus C18 (250 x 4.6 mm, 5 µm particle size) column.
HPLC Method
temperature. The mobile phase consisted of purified water and acetonitrile with 60:40 v/v, pH adjusted to 8, with drops of triethylamine (Merck). The volume of the injection was 10 µL at a low rate of 0.5 mL min-1, using
UV detection at 270 nm. The solutions were filtered through a 0.45 µm filter (Pall Corporation, Michigan, USA) before being injected, and the mobile phase was degassed by ultrasound bath before being used.
Preparation of standard and sample solutions
A quantity of 10 mg of CFZ were accurately weighted and transferred to the 50 mL volumetric lask, and the volume was completed with mobile phase in order to obtain a stock solution of 200 µg mL-1. Aliquots of this
solution were transferred to 10 mL volumetric flasks, whose volumes were completed with mobile phase, in order to obtain the working solutions of 30.0, 40.0, 50.0, 60.0 and 80.0 µg mL-1, which were used in the assay.
Method validation
The method was validated following the International Conference Harmonization (ICH, 2005) guidelines for validation of analytical methods.
System Suitability
The system suitability test was conducted to evaluate the resolution and reproducibility of the system to ensure that the complete testing system was suitable for the intended application. In order to obtain the required data, six solutions of CFZ reference standard at a concentration of 60.0 µg mL-1 were prepared and analyzed by HPLC.
The parameters such as peak area, retention time (tR), plate number (N), tailing factor (TF), and asymmetry factor (AS)
and their respective relative standard deviation (RSD) were analyzed.
Linearity
Linearity was determined by the construction of three independent analytical curves. For this, aliquots of the
stock solution were transferred to other volumetric lasks with the same solvent, to obtain six inal concentrations: 30-80 μg mL-1. The results were subjected to regression
analysis by a least-squares method to calculate the calibration equation in which the determination coeficient and validity of the statistical parameters were evaluated.
Precision
Precision was assessed at different levels: Repeat-ability (intra-assay), by testing six evaluations of the same concentration sample of CFZ of 60.0 µg mL-1, all on the
same day and under the same experimental conditions and intermediate precision (inter-assay) by conducting the analysis on three different standard solution concentrations (high, intermediate and low), on three different days under the same experimental conditions (inter-days), and also by different analysts performing the analysis in the same laboratory (between analysts). Precision was evaluated by % RSD.
Detection and quantification limits
The LOD and LOQ of CFZ by the proposed method were determined using calibration standards. LOD and LOQ were calculated as 3 and 10 σ/S, respectively, where S is the slope of the calibration curve and σ is the standard deviation of y-intercept of regression equation.
Accuracy
Accuracy was attained via the recovery assay, in which known quantities of CFZ reference standard were added to a known quantity of the sample (ICH, 2005). The accuracy of the method was evaluated in triplicate at three concentration levels (R1 = 80, R2 = 100 and R3 = 120%), and the percentage recoveries were calculated. Standard addition and recovery experiments were conducted to determine the accuracy of the method for the quantiication of CFZ in the drug product. This test was carried out by adding known amounts of CFZ-RS (0.90, 1.50 and 2.10 µg mL-1) to the samples. The
study was carried out in triplicate. Samples were prepared according to Table I.
TABLE I - Determination of the accuracy of the analytical method for the analysis of CFZ by HPLC
CFZ sample (100 µg mL-1) (mL)
CFZ RS (100 µg mL-1)(mL)
Theoretical concentration (µg/mL)a
R1 1.5 0.9 48
R2 1.5 1.5 60
R3 1.5 2.1 72
The percentage of recovered cefazolin sodium was calculated by equation 1.
(1)
where: CA= concentration of the sample solution found added to RS (µg mL-1); C
S= concentration found in the
sample (µg mL-1); C
T= theoretical concentration of the
solution added RS (µg mL-1).
Selectivity and study of forced degradation
The selectivity of the method was determined by subjecting a CFZ sample solution (200 µg mL-1) to
accelerated degradation by acidic, basic, neutral and photolytic conditions. The samples were evaluated at a concentration of 60 µg mL-1. The sample was
degraded in solutions of 0.001 mol L-1 HCl, 0.1 mol L-1
NaOH, and in puriied water by acid, basic and neutral hydrolysis respectively, all maintained at 60 °C for 48 h. Photodegradation was induced by exposing the samples in
a photostability chamber to 200 W h/m2 of near UV light
for 48 h. After the procedures, the samples were diluted with the mobile phase and were injected in the HPLC at a concentration of 60 µg mL-1.
Robustness
The robustness of the method was demonstrated by the Plackett–Burman design, to evaluate the reliability of the analysis concerning small variations in its working parameters. Table II shows the factorial combination used in the Plackett-Burman test, where the letters A-G represent the parameters selected; 1-15 is the factors changed, where the level (0) is the optimal values of the procedure, whereas levels (1) and (−1) are respectively upper and lower values with regard to the selected one (0).
The choice of variables (factors) and levels that must be tested is very important to obtain a reliable test of robustness. The variables must be consistent with reality and practice levels should relect the variation that can be generally observed. The factors and varying levels tested are shown in Table III.
TABLE III - Selected Factors and levels of variability
Factors Unit Limit Condition varied
(-1)
Condition Normal (0)
Condition varied (1)
A. Column brand --- --- Waters Agilent Waters
B. Mobile phase low rate mL/min ± 2 0.48 0.5 0.52
C. Acetonitrile brand --- --- Tedia J. T. Baker Tedia
D. Proportion of FM % ± 2 58:42 v/v 60:40 v/v 62:38 v/v
E. Volume of injection µL ± 2 8 10 12
F. Wavelength λ ± 2 268 nm 270 nm 272 nm
G. Room temperature °C ± 2 23 25 27
-1= Lower level; 0= Normal Level and +1 Upper Level.
TABLE II - Robustness test using the experimental model of Plackett-Burman
Parameter analytical
Combination factorial
1 2 3 4 5 6 7 8 9 10 11 12 13 14 15
A 1 1 1 0 1 0 0 0 -1 -1 -1 0 -1 0 0
B 0 1 1 1 0 1 0 0 0 -1 -1 -1 0 -1 0
C 0 0 1 1 1 0 1 0 0 0 -1 -1 -1 0 -1
D 1 0 0 1 1 1 0 0 -1 0 0 -1 -1 -1 0
E 0 1 0 0 1 1 1 0 0 -1 0 0 -1 -1 -1
F 1 0 1 0 0 1 1 0 -1 0 -1 0 0 -1 -1
G 1 1 0 1 0 0 1 0 -1 -1 0 -1 0 0 -1
The robustness was determined in triplicate from injections of standard solutions containing 60 µg mL-1
CFZ, under the same established experimental conditions. To determine the influence of changes in each parameter on the final result, the average of dosage performed in triplicate assay corresponding to normal ranges was compared to the average of dosage corresponding to the modiied levels.
The average effect of each variable is the average difference among the observations made at the modiied levels and those made at the optimum level. The deviation of each factor was calculated using the methodology Youden and Steiner.
Equation 2 illustrates the effect evaluation of the changing parameter A-brand column, likewise the other parameters were also evaluated (Berzas et al., 2004).
(2)
where:
Since the deviation of each factor changed (DA, DB, DC etc) should be less than the value resulting from √2S to infer that the effects obtained with the variations of the parameters were not signiicant and therefore the method is robust for all selected factors.
RESULTS AND DISCUSSION
Preliminary tests were carried out in order to obtain a reliable method so as to avoid damage to the chromatographic column and try to decrease formation of residue. Many mobile phase systems were tested in different chromatographic columns. Still to establish the best working conditions, the distribution coefficient (log D) was determined using ACD/Labs 6.0 software, considering that the distribution coefficient is the evaluation of the partition coefficient (log P) at different pHs. The results indicate that the pH where the drug solubility is more stable is between 7 and 11 (Figure 1). However this chromatographic column can be used over a pH range of 2-9. Therefore, the pH range from 7 to 9 is indicating to perform the analysis. The mobile phase was adjusted to pH 8 using drops of triethylamine.
The CFZ chromatogram obtained by the proposed method showed good resolution and peak symmetry. The retention time observed (3.6 min) allows a rapid determination of the CFZ, which is desirable for a routine analysis (Figure 2).
FIGURE 1 - CFZ distribution coeficient determined by ACD/
Labs 6.0 software.
System suitability
The results of system suitability indicate that the selected chromatographic parameters are able to identify and quantify the drug analyzed. The results are consistent with the literature (FDA, 2004). The system suitability
was checked by injecting six replicate solutions of CFZ RS in with concentration of 60 µg mL-1. The parameters
measured in system suitability were peak area, retention time, resolution, peak purity, tailing factor, capacity factor and theoretical plate. In all measurements the peak area FIGURE 2 - Chromatogram of CFZ (60 µg mL-1). Chromatogram
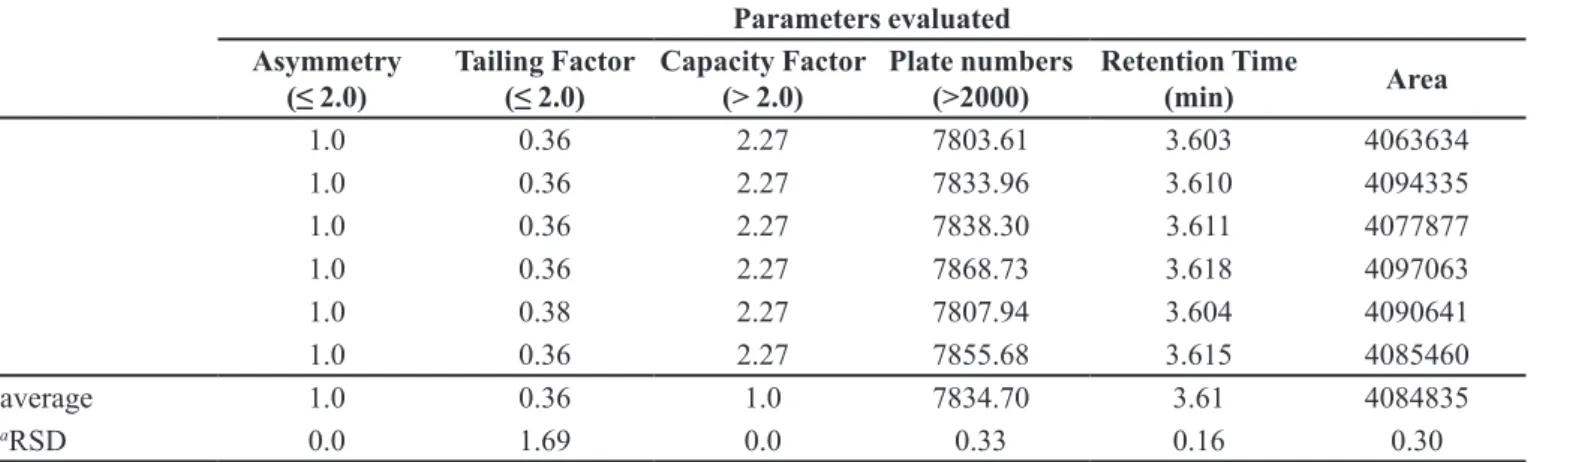
varied less than 2.0%, the average retention time was 3.6 minutes (Relative Standard Deviation = 0.16%), the retention factor was more than 2, plate number was more than 7803 and tailing factor was less than 2, for the CFZ peak. The proposed method offers good detectivity and CFZ can be detected accurately. The results obtained for the parameters of System Suitability are presented in Table IV.
Linearity
Table V shows the values of areas obtained by the different concentrations of CFZ RS.
Residue analysis indicated that the regression model used is appropriate. Each average value of absolute areas obtained in determining the analytical curve was plotted in relation to its concentration, observing linearity in the range of 30-80 µg mL-1, as shown in Figure 3.
The results for linearity were statistically analyzed using tests of variance (ANOVA); according to ANOVA there is no deviation from linearity in calibration curve and the regression model is appropriate. The ANOVA calculated for the data from the analytical curve of CFZ is presented in Table VI.
Precision
The precision of the method was determined by repeatability (intraday), expressing the results based on the RSD. Seven solutions of CFZ were prepared in a concentration of 60 µg mL-1 andwere submitted to
successive analyses and the date obtained on the same day under the same experimental conditions, by the same analyst and at the same laboratory, providing a RSD of 0.84%. For the determination of interday precision, analyzes were performed using three samples, on three consecutive days, yielding experimental values of contents of 100.29% 100.11% to 100.79%, with an average content
of 100.39% and RSD was 0.35%. For precision between analysts, two samples were evaluated by two analysts, obtaining experimental values of 98.49% and 100.12%, with an average of 99.31% and RSD of 1.17, as shown in Table VII.
The precision showed RSD values lower than TABLE IV - Parameters evaluated in system suitability test
Parameters evaluated Asymmetry
(≤ 2.0) Tailing Factor (≤ 2.0) Capacity Factor (> 2.0) Plate numbers (>2000) Retention Time (min) Area
1.0 0.36 2.27 7803.61 3.603 4063634
1.0 0.36 2.27 7833.96 3.610 4094335
1.0 0.36 2.27 7838.30 3.611 4077877
1.0 0.36 2.27 7868.73 3.618 4097063
1.0 0.38 2.27 7807.94 3.604 4090641
1.0 0.36 2.27 7855.68 3.615 4085460
average 1.0 0.36 1.0 7834.70 3.61 4084835
aRSD 0.0 1.69 0.0 0.33 0.16 0.30
aRSD= Relative standard deviation
TABLE V - Values of the peak areas for the CFZ RS to the analytical curve
Concentration (µg mL-1)
Areasa
(AU)
Average Area
RSDb
(%)
30 2152162
2107217 2110833 1.87
2073120
40 2764639
2756486 2752218 0.55
2735528
50 3349823
3380328 3372399 0.58
3387046
60 3971999
3912803 3969727 1.40
4024378
70 4572851
4513790 4589643 1.86
4682288
80 5154763
5136111 5183200 1.27
5258725
a Average value of three determinations / bRSD = Relative
FIGURE 3- Residue analysis and analytical curve for CFZ RS obtained by chromatographic method, using puriied water: acetonitrile
(60:40 v/v) pH 8 adjusted with TEA, as mobile phase. Stationary Phase: Agilent Zorbax Eclipse Plus C18 (250 x 4.6 mm, 5 µm).
TABLE VI - Analysis of variance (ANOVA) for linearity
Source of variation Degree of
freedom Sum of squares Variability F calculated F critical
Between concentration 5 19760858787504.8 3952171757500.9 1396.43* 3.11
Linear regression 1 19760858787504.8 19760858787504.8 6982.14* 4.75
Deviation of linearity 4 0.00003 0.0000075 0.00 3.26
Residue 12 33962392533.3 2830199377.7 -
-Total 17 19794821180038.2 - -
-* Signiicant at p <0.05 %
TABLE VII - Results for cefazolin sodium method precision
Interday precision Between-analysts precision
Day Contenta
(%)
Average Content (%)
RSDb
(%)
Analist Contenta
(%)
Average Content (%)
RSDb
(%)
1 100.29 100.39 0.35 A 100.12 99.31 1.17
2 100.11 B 98.49
3 100.79
aaverage of three determinations; bRSD= relative standard deviation
recommended in the literature (ICH, 2005; FDA, 2004). The results obtained in interday precision and precision between-analyst were also statistically evaluated by
analysis of variance and according to ANOVA there was no signiicant deviation, as shown in Table VIII and Table IX.
TABLE VIII - Analysis of variance (ANOVA) for interday precision
Source of variation DF Sum of squares Average squares F calculated P-value F critical
Between groups 2 269208531.8 134604265.9 0.10 0.89 3.55
Within groups 18 22465779885 1248098882
Total 20 22734988417
Accuracy
The accuracy showed good recovery between the true value and the value found. The accuracy of the method was determined by analysis of three concentrations in the pre-established range and experimental results corresponding to the average percentage of 100.37% are shown in Table X.
Limits of detection and quantification
The sensitivity of the method was determined by chromatographic detection (LOD) and quantitation (LOQ) limits. The value calculated for the lowest concentration detected by analytical procedure was 3.10 µg mL-1. In turn, the calculated LQ was 9.41 µg mL-1.
The calculated values for the LOD and LOQ indicated the ability of the method to detect and quantify reliably CFZ.
Selectivity
Selectivity of the method was evaluated by forced degradation observing the chromatograms of the cefazolin sodium standard containing possible degradation products. The chromatograms depicted in Figure 4 show that the degradation products had negligible effect on to the cefazolin sodium peak. However in degradations in neutral or photolytic conditions showed no additional peaks, but showed a significant decrease of 62% and 68%, respectively, compared to the peak of drug at the time of preparation. Moreover, the resolution among cefazolin sodium and potential degradation products was higher than 1.5 indicating adequate separation of cefazolin sodium from other peaks (Snyder et al., 2010).
This separation confirmed the method selectivity for degradation products.
Robustness
The robustness was evaluated by the Plackett-Burman factorial matrix, in which 15 experiments were performed with simultaneous changes, previously presented in Table II and Table III. The effects resulting from the changed parameters have been evaluated in comparison to the values obtained as reference for the test +1 1.47 and 1.54 for the test -1 (Equation 2). No effect showed signiicant results, indicating that the proposed method is robust. The robustness was conirmed by the Plackett-Burman model. The results indicated that the validity of the method is maintained even with small variations in its working conditions. Concentrations found in normal conditions and changed for each factor are shown in Table XI.
The results of method validation for the analysis of CFZ showed that the developed high performance liquid chromatography method is appropriate to quantify this cephalosporin in powder for injection.
CONCLUSION
The present study involves development of HPLC method using simple mobile phase which contains no buffer in its constitution, which is sensitive and rapid, as well as subsequent validation of developed method according to ICH guidelines. Prioritizing shorter analysis can reduce the consumption of organic solvents making the method inancially advantageous for quantiication TABLE IX - Analysis of variance (ANOVA) for between-analyst precision
Source of variation DF Sum of squares Average squares F calculated P-value F critical
Between groups 1 718684.57 718684.57 0.00026 0.98 4.74
Within groups 12 32952861485 2746071790
Total 13 32953580170
* p > 0.05%
TABLE X- Results for cefazolin sodium method accuracy
CFZ RS added (µg mL-1)
CFZ RS founda
(µg mL-1)
Recuperation (%)
Average recuperation
(%) RSD
b
(%)
R1 18 18.21 101.16 100.37
R2 30 30.16 100.52 0.86
R3 42 41.76 99.44
of CFZ in pharmaceutical powder in the pharmaceutical industry. The method proved to be able to quantify the cefazolin sodium in its pharmaceutical form, fulilling the necessary criteria such as system suitability and validation of system, as linearity, precision, accuracy and robustness. The method is inancially advantageous for the pharmaceutical industry, because the analysis is fast, and it generates a smaller amount of organic solvent waste. Thus this method is indicated for be used
in routine quality control analyses of the pharmaceutical industry.
ACKNOWLEDGEMENTS
The authors wish to thank the pharmaceutical company ABL - Antibióticos Brazil Ltda (Brazil) for the supply of the samples and thank the FAPESP, CNPq and PADC – UNESP for inancial support.
TABLE XI - Results for cefazolin sodium method robustness
Factor (+1) Content (%)a,b (-1) Content (%)a,b
Column brand A= Waters™ 100.38–101.46= -1.08 A= Waters™ 100.83 – 101.63 = -0.80
Mobile phase low rate (µg mL-1) B= 0.52 101.21–100.63= 0.58 B= 0.48 101.30 – 101.15 = 0.15
Acetonitrile brand C= Tedia 100.89–100.95= -0.06 C= Tedia 100.71 – 101.75 = -1.04
Proportion of FM (%) D= 62:38 101.00–100.83= 0.17 D= 58:42 101.19 – 101.27 = -0.08
Volume of injection (mL) E= 12 100.92–100.92= 0.00 E= 8 100.85 – 101.60 = -0.75
Wavelength (nm) F= 272 100.71–101.13= -0.42 F= 268 101.52 – 100.94 = 0.58
Room temperature (°C) G= 27 101.70–101.14= -0.56 G= 23 101.25 – 101.20 = 0.05
aAverage contents obtained in normal conditions - Average contents obtained in the altered conditions; bReference criteria calculated:
1.47 (Test +1) and 1.54 (Test-1)
FIGURE 4 - CFZ Chromatogram of 60 µg mL-1 before degradation (a)and after 48 hours under degradation (b). In Basic (0.1 mol L-1
NaOH) at 60 °C (A); acid (0.001 mol L-1 HCl) at 60 °C (B) neutral (puriied water) at 60 °C (C); and photolytic (UV) at room
REFERENCES
AL-RAWITHI, S.; HUSSEIN, R.; RAINES, D.A.; ALSHOWAIER, I.; KURDI, W. Sensitive assay for the determination of cefazolin or ceftriaxone in plasma utilizing LC. J. Pharm. Biomed. Anal., v.22, p.281-286, 2000.
ARAYNE, M.S.; SULTANA, N.; BI-BI, Z. Simultaneous determination of cefazolin or ceftizoxime in presence of ascorbic acid from pharmaceutical formulation and human serum by RP-HPLC. Pak. J. Pharm. Sci., v.20, n.1, p.56-61, 2007.
BAYOUMI, S.M.; VALLNER, J.T.; DIPIRO, J.T. Quantitation of cefazolin sodium in plasma and tissues by
high-performance liquid chromatography. Int. J. Pharm., v.30,
p.57-61, 1986.
BERZAS, J.J.; GUIBERTEAU, C.; VILLASEÑOR, M.J.; RODRÍGUEZ, V. Development of a capillary gas chromatographic procedure for determining selective serotonin reuptake inhibitors: validation study and experimental design to evaluate the robustness of method.
Anal. Chim. Acta., v.519, p.219-230, 2004.
BOMPADRE, S.; LEONE, L.; FERRANTE, L.; ALO, F.; IOANNIDIS, G. Determination of cefazolin in human serum by high performance liquid chromatography with
on-line solid phase extraction. J. Liq. Chrom. Rel. Technol.,
v.21, p.417-426, 1998.
BONFILIO, R.; TARLEY, C.R.T.; PEREIRA, G.R.; SALGADO, H.R.N.; ARAÚJO, M.B. Multivariate optimization and validation of an analytical methodology by RP-HPLC for the determination of losartan potassium in capsules.
Talanta, v.80, p.236-241, 2009.
BROTZU, G. Ricerche su di un nuovo antibiotico. In: ____ Labori dezz ‘Istituto d’lgiene di Cagliari. Cagliari: Tip. C. E. L., 1948. p.1-11.
BRUNTON, L.L.; CHABNER, B.A.; KNOLLMANN,
B.B. Goodman & Gilman As bases farmacológicas da
terapêutica de. 12.ed. São Paulo: AMGH, 2012. 2079 p.
CAZEDEY, E.C.L.; OTHMAN, A.; GARG, S.; SALGADO, H.R.N. A validated stability-indicating LC method for orbiloxacin in the presence of degradation products. Curr. Pharm. Anal., v.7, p.1-6, 2011.
FARAG, S.A. Simultaneous liquid chromatographic analysis of the β-lactam antibiotics cefazolin, cefadroxil, cephalexin,
ampicillin, and cephradine in solution. J. AOAC Int., v.81,
p.381-385, 1998.
FARTHING, C.; FARTHING, D.; BROPHY, D.F.; TERRI LARUS, T.; MAYNOR, L.; FAKHRY, I; GEHR, T.W.B. High-Performance liquid chromatographic determination of cefepime and cefazolin in human plasma and dialysate.
Chromatographia, v.67, p.365-368, 2008.
FDA. FOOD AND DRUG ADMINISTRATION Validation of chromatographic methods. Washington: Center of Drug Evaluation and Research, 2004.
ICH Q2 – International Conference on Harmonization of technical requirements for registration of pharmaceuticals for human use. Validation of Analytical Procedure: Text and Methodology (R1). ICH Steering Committee, Switzerland, 2005. Available at: http://www.bioforum.org.il/Uploads/ Editor/karen/q2_r1_step4.pdf. Accessed on: 23 May 2013.
KUSABA, T. Safety and efficacy of cefazolin sodium in the management of bacterial infection and in surgical
prophylaxis. Clin. Med. Ther., v.1, p.1607-1615, 2009.
LIANG, D.; CHOW, D.; WHITE, C. High-performance liquid chromatographic assay of cefazolin in rat tissues.
J. Chromatogr. B Biomed. Appl., v.656, p.460-465, 1994.
LOPES, C.C.G.O.; SALGADO, H.R.N. Development of a validated stability-indicating LC assay and stress
degradation studies of linezolid in tablets. Chromatographia
Suppl., v.69, p.S129-S135, 2009.
MOORE, C.M.; SATO, K.; KATSUMATA, Y. High-performance liquid chromatographic determination of cephalosporin
antibiotics using 0.3 mm I.D. columns. J. Chromatogr.,
v.539, p.215-220, 1991.
MORENO, A.H.; SALGADO, H.R.N. Development of a new high-performance liquid cromatographic method for
determination of ceftazidime. J. AOAC Int., v.91,
p.739-743, 2008.
PINTO, C.G.; PAV´ON, J.L.P.; CORDERO, B.M. Micellar liquid chromatography of zwitterions: retention mechanism
of cephalosporins. Analyst, v.120, p.53-62, 1995.
SALGADO, H.R.N.; MORENO, P.R.H.; BRAGA, A.L.; SCHAPOVAL, E.E.S. Photodegradation of sparloxacin and isolation of its degradation products by preparative HPLC. Rev. Ciênc. Farm. Básica Apl., v.26, p.47-54, 2005.
SAMER, A.R.; RAJAA, H.; DALE, A.R.; IBRAHIM, A.; WESAM, K. Sensitive assay for the determination of cefazolin or ceftriaxone in plasma utilizing LC. J. Pharm. Biomed. Anal., v.22, p.281-286, 2000.
SHINDE, V.M.; SHABADI, C.V. Simultaneous determination of cefazolin and cefotaxime in injections by reverse phase HPLC. Indian J. Pharm. Sci., v.60, p.313-315, 1998.
SILVA, L.M.; SALGADO, H.R.N. Validation of a stability-indicating RP-LC method for the determination of
tigecycline in lyophilized powder. J. Chromatogr. Sci., v.51,
p.192-199, 2012.
SNYDER, I.R.; KIRKLAND, J.J.; DOLAN, J.W. Introduction to modern liquid chromatography. 3.ed. New York: John Wiley & Sons, Inc. 2010. 912 p.
TOZO, G.C.G.; SALGADO, H.R.N. Determination of l o m e f l o x a c i n i n t a b l e t p r e p a r a t i o n s b y l i q u i d
chromatography. J. AOAC Int., v.89, p.1305-1308, 2006.
TSAI, T.H.; CHEN Y.F. Simultaneous determination of cefazolin in rat blood and brain by microdialysis and microbore liquid
chromatography. Biomed. Chromatogr., v.14, p.274-278,
2000.
WANG, G.; LIU, S.J.; UENG, S.W.N.; CHAN, E.C. The release of cefazolin and gentamicin from biodegradable PLA/PGA
beads. Int. J. Pharm., v.273, p.203-204, 2004.
WOLD, J.S. Rapid analysis of cefazolin in serum by
high-pressure liquid chromatography. Antimicrob. Agents
Chemother., v.11, p.105-109, 1977.
YOUDEN, W.J.; STEINER, E.H. Statistical Manual of AOAC - Association of Oficial Analytical Chemistry. Washington: AOAC, 1975. 88 p.