Article
J. Braz. Chem. Soc., Vol. 26, No. 8, 1617-1624, 2015. Printed in Brazil - ©2015 Sociedade Brasileira de Química 0103 - 5053 $6.00+0.00
A
*e-mail: [email protected]
Chromatographic and Calculation Methods for Analysis of the Lipophilicity of Newly
Synthesized Thiosemicarbazides and their Cyclic Analogues 1,2,4-Triazol-3-thiones
Anna M. Hawrył,*,a Łukasz P. Popiołek,b Mirosław A. Hawrył,a Ryszard S. Świebodaa and
Milena A. Niejedlia
aDepartment of Inorganic Chemistry and bDepartment of Organic Chemistry, Medical University of
Lublin, 4a Chodźki Street, 20-093 Lublin, Poland
This paper describes the evaluation of the lipophilicity of newly synthesized thiosemicarbazides and their cyclic analogues 1,2,4-triazol-3-thiones obtained using experimental and calculated methods. Previous studies have shown these compounds have antibacterial activity. The chromatographic behavior of analyzed compounds was studied by reversed phase high performance liquid chromatography (RP-HPLC) and reversed phase thin layer chromatography (RP-TLC). The aqueous mobile phases containing methanol were used in order to determine retention parameter (RM) and capacity factors (log k) of analyzed compounds. The lipophilicity parameters were
obtained by linear extrapolation and they were compared with the calculated log P obtained using several software packages. The results indicate that both experimental chromatographic methods yielded similar results, and these methods are appropriate for determining the lipophilicity of analyzed compounds. High values of correlation coefficients between the log P values calculated using known algorithms (milogP, ALOGPs, AClogP, AlogP, MLOGP, KOWWIN, XLOGP2, XLOGP3) and the experimental data were obtained. Eight standard solutes with known log POW
were analyzed under the same conditions as the tested substances in order to determine the log PHPLC and log PTLC parameters. A good correlation was obtained between log kw (or RMW) and
the slope. All tested compounds were in agreement with the rule of five claims by Lipiński. The calculated log P values were experimentally confirmed (log PHPLC and log PTLC).
Keywords: lipophilicity, RP-HPLC, RP-TLC, log POW
Introduction
Synthesis and confirmation of identity of studied thiosemicarbazide derivatives and their cyclic analogues 1,2,4-triazole-3-thiones were described early.1 In the cited
work, the antibacterial activity of several compounds is presented.
It is well known that the biological activity of some substances is related to their lipophilicity. This parameter determines the bioavailability of the chemical compound and it has been important, in prediction of crossing biological barriers of drug molecules and its interactions with receptors. Lipophilicity is a chemical affinity for the lipid and aqueous phases, and the measure is the ratio of the equilibrium concentration (activity) of the solute in the two-phase system consisting of two immiscible solvents non-polar and polar ones.2-4 For a long time, the distribution
coefficient between n-octanol and water was used as
an experimental lipophilicity index of the compound. However, due to some limitations and technical barriers, the other methods for determination of the lipophilicity were applied. The chromatographic techniques have proved to be an important alternative method for determination of the lipophilicity. The chromatographic techniques such as reversed phase thin layer chromatography (RP-TLC),5-10 reversed phase high performance liquid
chromatography (RP-HPLC),11-14 microemulsion
electrokinetic chromatography,15 immobilized artificial
membrane (IAM) chromatography,16-18 biopartitioning
micellar chromatography (BMC),16,19 immobilized
liposome chromatography (ILC) are commonly used.16
The logarithm of n-octanol-water partition coefficient log POW is the most frequently used parameter for measuring
of lipophilicity and it has been shown that this system is a good model for many biological processes.20 This
parameter is also used as one of the standard properties identified by Moreno et al.20 and Lipiński et al.21 in the
The classical shake flask method for determining lipophilicity has many disadvantages, i.e., it is time consuming, the quantitative analysis must be used, the log POW value is limited to the range from 2 to 4.
22 Therefore,
many chromatographic methods have successfully been used to determine the lipophilicity of potential drugs. Both HPLC and TLC methods are easy, fast, reproducible and accurate for showing the behavior of molecules in polar/non-polar system.20-27 Moreover, many calculated
methods were used in order to predict the log POW value. 24,28,29
Chromatographic parameter of lipophilicity, log kw,
obtained by extrapolation to pure water is calculated using the linear equation:30
log k = log kw – Sϕ (1)
where log kw is the retention coefficient for pure water, S
is the slope of the regression line, ϕ is the concentration expressed as molar fraction of organic solvent and water.
The RM parameter determined in TLC is an analogous
with log k value and can be combined with modifier concentration:
RM = RMW – Sϕ (2)
where the definition of RMW, S and ϕ are the same as in
equation 1.
The aim of this work is the comparison the log POW of
thiosemicarbazide derivatives and their cyclic analogues 1,2,4-triazole-3-thiones, which can be used as potential drugs, determined by RP-HPLC and RP-TLC methods with the calibration curve technique with the log P values calculated using known algorithms (milogP, ALOGPs, AClogP, AlogP, MLOGP, KOWWIN, XLOGP2, XLOGP3).24,25,31 According to the Organisation for
Economic Co-operation and Development (OECD) guidelines, in the chromatographic method selecting the appropriate reference compounds were required.31 The
influence of the structure of analyzed derivatives on the retention is also discussed. The different chromatographic behavior of both groups of compounds (linear and cyclic derivatives) were compared.
Experimental
Materials
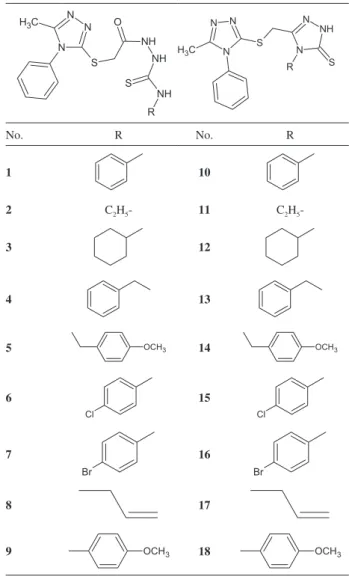
Thiosemicarbazide derivatives and their cyclic analogues 1,2,4-triazole-3-thiones (Table 1) were synthesized in the laboratory at the Department of Organic Chemistry, Medical University of Lublin.1 Methanol
LiChrosolv (Merck, Darmstadt, Germany) for liquid chromatography grade and bidistilled water were used as mobile phase components.
High performance liquid chromatography
All HPLC experiments were performed using a chromatograph equipped with Elite LaChrom L-2130 gradient pump (Hitachi-Merck, Darmstadt, Germany), SPD-10AVP UV-VIS detector (Shimadzu, Kyoto, Japan) and Rheodyne 7725i valve with 20 µL loop.
20 µL of each sample (0.1% solution) was applied into the chromatographic column (RP-18 Waters Symmetry, 15 cm length, 4.6 mm i.d., 5 µm particle size) using a Hamilton syringe (Hamilton, Bonaduz, Switzerland). Mobile phases were degassed by use of built-in membrane degasser. Chromatograms were developed at flow rate of 1.0 mL min−1 in isocratic mode using various concentrations
of modifier in binary polar mobile phases: methanol ranges
Table 1. List of compounds investigated
R N
N N C
H3
S O
NH NH S
NH
R N
N NH N
N N
C
H3 S
S
No. R No. R
1 10
2 C2H5- 11 C2H5
-3 12
4 13
5 OCH3 14 OCH3
6
Cl
15
Cl
7
Br
16
Br
8 17
were 40-65% (v/v) changed by 5% per step (Table 2).
Chromatograms were detected at 254 nm. All experiments
were repeated in triplicate and the final results were their arithmetic mean.
Dead time was measured by use of uracil (Calbiochem-Merck, Darmstadt, Germany). All the experiments were performed at ambient temperature.
Thin layer chromatography
Thin layer chromatography was performed on 10 × 10 cm TLC plates coated with RP-18254 using
methanol-water mixtures as mobile phases (Table 2). 0.1% of the methanolic solutions were applied on the plates and they were developed to a distance of 9 cm at room temperature in horizontal chambers (Chromdes, Lublin, Poland). The plates were not evaporated before the development. After drying in air, the chromatograms were visualized at a wavelength of 254 nm. Each experiment was performed three times.
Standard solutes
According to the OECD guideline, in order to correlate the measured capacity factor log k of a standard compound with its log POW, a calibration graph using at
least six points has to be established. It is preferable that the appropriate reference compounds should be structurally related to the test substances. Eight compounds were selected as standard solutes with optimal range of log POW
units (0.9 to 4.9). The following standard substances were selected (the log POW values in brackets): aniline
(0.9), 2-hydroxyquinoline (1.26), bromobenzene (3.0), naphthalene (3.6), propylbenzene (3.7), biphenyl (4.0), butylbenzene (4.6), pentylbenzene (4.9).
The standard compounds with known log POW were
analyzed under the same chromatographic conditions as the tested substances (RP-HPLC and RP-TLC) in order to determine the lipophilicity parameter (log PHPLC and
log PTLC).
All experiments were repeated in triplicate and the final results were their arithmetic mean.
log P calculation
The log P values of 1,2,4-triazole-3-thione derivatives were calculated using the two computer programs.32-34
Results and Discussion
The structures of analyzed compounds are presented in Table 1 and they were divided into two groups. The linear thiosemicarbazide derivatives (first nine compounds) and their cyclic analogues (remaining compounds) have the same substituents and they differ the lack of one molecule of water for cyclic analogues 1,2,4-triazole-3-thiones. The retention parameters were determined using the RP-HPLC and RP-TLC chromatographic systems. Mobile phases compositions for both chromatographic methods are presented in Table 2. Both the log k and the RM
values decreased linearly with the increasing of methanol concentration in the mobile phase. The parameters of the linear equation for HPLC and TLC methods are presented in Table 3. The high correlation coefficients (r > 0.98) and small values of the standard errors of estimate (< 0.1) were indicated that all equations obtained were highly significant. The chromatographic lipophilicity parameters (log kW, RMW) were obtained from equations 1 and 2 by
extrapolation to pure water. In all cases, the value of log kW is always higher than RMW (Table 3). Probably, the
differences in the log kW and RMW values are associated
with “thin-layer effect” and the presence of apparent effluent front.
The correlation chart between the log kW and the RMW
values was prepared and this relationship is described by the following equation:
RMW = (1.1098 ± 0.064) log kw – (0.8757 ± 0.222)
r2 = 0.9488, n = 18, F = 296.7, s
e = 0.158 (3)
High value of correlation coefficient confirms the similarity of both experimental methods (RP-HPLC and RP-TLC).
The differences between the chromatographic lipophilicity parameters, log kW obtained for second (cyclic
analogues) and first (linear derivatives) groups (∆log kWB-A)
were calculated (Table 4) and they are in the range from 0.021 to 0.508 (average value = 0.272). In the case of the TLC method, these differences are in the range from 0.045 to 0.597 (average value = 0.272). Negative values of were obtained for p-chlorophenyl and p-bromophenyl in HPLC and TLC methods. High value of chromatographic lipophilicity parameters log kW and RMW for compounds 3
and 12 (with cyclohexyl substituent) were observed
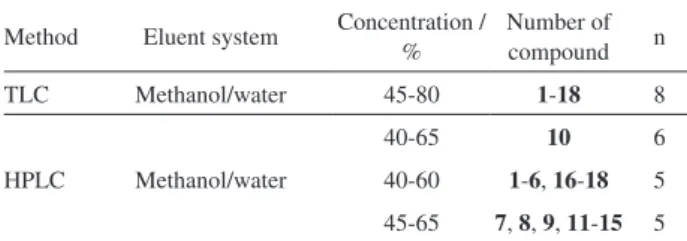
Table 2. The concentrations of used eluents, n-number of points
Method Eluent system Concentration / %
Number of compound n
TLC Methanol/water 45-80 1-18 8
HPLC Methanol/water
40-65 10 6
(Table 3). Low differences between the values of RMW for 3 and 12 were noted (Table 4).
The structure of the first group is different from the second group of the lack of water molecule. The elimination of water from a molecule reduces its lipophilicity as well as absolute values of the specific hydrophobic surface, and the ratio of the intercept (log kW) to the slope (–S) of the
compound is constant in both groups.35 These results are
in accordance with the fragmental method used for log P calculations.36
The lowest value of log kW and RMW was obtained for
compounds 2, 8, 11 and 17. There are substances containing the ethyl group (2, 11) and but-1-ene group (8, 17) in their structure. Compounds 5 and 9 differ in chain length (one methylene group), similarly the substances 14 and 18. This small difference in structure slightly affects the value of the parameters of lipophilicity, which are higher for compounds with longer carbon chain (Table 3).
A significant influence of the structural differences was observed for substances 1, 10 and 3, 12, which contain the phenyl and the cyclohexyl groups, respectively. Higher value of lipophilicity parameters (Table 3) was obtained for compounds 3 and 12 (the average of differ for log kW is 0.8861 and for RMW is 1.2462). Moreover,
the change of halogen group for compounds 6, 7, 15
and 16 did not significantly affect the change in value of lipophilicity.
Comparing the log kW and RMW values of two groups
of analyzed compounds (the linear thiosemicarbazide derivatives and their cyclic analogues), some differences have been observed. Generally, the slightly higher values of these factors were obtained for second group of compounds (10-18) in most of the cases (Table 3). The increase of the lipophilicity is probably due to the presence of the additional triazole ring, which changes the position of the whole molecule in space. The exceptions are the substances 6 and 7, for which the log kW and RMW
values are slightly higher than for compounds 15 and
16. The p-chlorophenyl substituent is presented in the structure of compounds 6 and 15 and the p-bromophenyl substituent is presented in the structure of compounds 7
and 16. The presence of halogen substituents affects the chromatographic behavior of the whole molecule. The proximity of chlorine and bromine (free electron pairs) can cause changes in stereochemistry and different interactions of the molecule with the stationary and mobile phases. A linear relationship between the intercept and slope from equations 1 and 2 for the used mobile phase, is one of the basis features of chromatographic determination of the lipophilicity of closely related compounds.37 In this study, the
Table 3. Parameters of the equations 1 and 2 for methanol-water system
Compound
HPLC TLC
log kW –S r n
se of
estimation F RMW –S r n
se of estimation F
1 3.0352 5.3645 0.9983 5 0.03 858.39 2.3411 3.6543 0.9907 8 0.07 319.45
2 2.4426 4.7697 0.9969 5 0.03 481.84 1.7865 3.0208 0.9916 8 0.05 354.31
3 3.9497 5.9981 0.9966 5 0.05 443.35 3.6405 4.9825 0.9942 8 0.07 509.90
4 3.5468 5.7178 0.9990 6 0.03 1994.1 3.0721 4.4441 0.9943 8 0.06 520.93
5 3.5811 5.9281 0.9984 6 0.06 1272.8 3.0796 4.4790 0.9920 8 0.08 370.27
6 4.1295 6.2585 0.9965 5 0.05 428.12 3.6564 5.0826 0.9941 8 0.07 503.42
7 3.9801 6.1719 0.9978 5 0.04 672.51 3.4743 4.9134 0.9929 8 0.08 420.95
8 2.3304 4.2846 0.9980 5 0.02 745.62 1.9951 3.2856 0.9912 8 0.06 335.40
9 2.8211 4.9485 0.9975 5 0.03 586.04 2.4412 3.7471 0.9876 8 0.08 238.30
10 3.1132 5.5839 0.9980 5 0.03 746.02 2.3861 3.6727 0.9909 8 0.07 325.44
11 2.6314 5.0563 0.9989 5 0.02 1414.1 1.9261 3.0708 0.9928 8 0.05 411.24
12 3.9708 5.9570 0.9968 5 0.04 471.74 3.5791 4.8016 0.9974 8 0.05 1135.2
13 3.7650 5.7924 0.9907 5 0.07 158.52 3.5827 4.9120 0.9940 8 0.07 491.85
14 3.9828 6.1814 0.9967 5 0.05 459.76 3.6769 5.0297 0.9959 8 0.06 724.80
15 3.9537 6.0530 0.9971 5 0.04 520.93 3.4559 4.7799 0.9959 8 0.06 734.59
16 3.8291 5.9848 0.9970 5 0.04 493.84 3.2870 4.6106 0.9940 8 0.07 492.75
17 2.8379 5.1475 0.9994 5 0.02 2362.2 2.2655 3.5013 0.9911 8 0.06 33.17
18 3.3071 5.7647 0.9982 5 0.03 833.35 2.5212 3.6790 0.9859 8 0.08 208.81
good correlation obtained between the intercept (log kW, RMW) and slope (S) confirms the suitability of these systems for estimation of the lipophilicity of thiosemicarbazide derivatives and their cyclic analogues. The linear correlation is described by the following equations:
log kw = (0.9043 ± 0.063)S – (2.5341 ± 0.217)
r2 = 0.9282, n = 18, F = 206.8, s
e = 0.155 (4)
RMW = (1.0775 ± 0.024)S – (1.08679 ± 0.071)
r2 = 0.9922, n = 18, F = 2047.6, s
e = 0.067 (5)
The rule of 5” developed by Lipiński et al.38 predicts that
poor absorption or permeation is more likely when there are molecules (drug-like) that have more than 5 H-bond donors, 10 H-bond acceptors in their structure, the molecular weight (MWT) is greater than 500 and the calculated log P (C log P) is greater than 5 (or M log P > 4.15).38 In our work, newly
synthesized thiosemicarbazides and their cyclic analogues 1,2,4-triazol-3-thiones were in agreement with the rule of five claimed by Lipiński et al.38 (Table 5).
Reversed phase high performance liquid chromatography and reversed phase thin layer chromatography were also used in order to determine experimentally octanol-water partition coefficients (log PHPLC and log PTLC parameters).
The measurements were conducted according with the OECD guidelines.31 Similar studies were carried out in many
works.24-27 In this study, eight compounds have been selected
(see Experimental section) as reference compounds from the Recommended Reference Compounds list published by the OECD.31 The determination of log P
OW by HPLC and
TLC methods is based on the linear relationship between the chromatographic retention parameters (log k and RM)
and the octanol-water partition coefficient determined by shake-flask method for selected standard solutes.
In the case of RP-HPLC method, the best selectivity was obtained with methanol-water (60:40, v/v) and this mobile phase was chosen for the determination of log POW. Linear
calibration equation (Figure 1) between log k values and their literature log POW for standard compounds looks as follows:
y = (2.3137 ± 0.07)x + (2.2013 ± 0.09)
r = 0.9946 ± 0.04, n = 8, F = 552.5, se = 0.16 (6)
Next, the log k values of the studied substances were substituted into equation 6 to calculate the partition coefficient obtained for HPLC method (log PHPLC). Table 4. The lipophilicity differences between the
3H-1,2,4-triazol-3-thiones and the corresponding semicarbazides (∆log kWB-A , ∆RMWB-A)
obtained by two chromatographic systems
∆log kWB–A ∆RMWB–A
1A (10B) 0.078 0.045
2A (11B) 0.189 0.140
3A (12B) 0.021 −0.061
4A (13B) 0.218 0.511
5A (14B) 0.402 0.597
6A (15B) −0.176 −0.201
7A (16B) −0.151 −0.187
8A (17B) 0.508 0.270
9A (18B) 0.486 0.080
Table 5. Data applied for the rule of 5” for tested compounds
Compound Molecular weight
H bond acceptors
H bond
donors log PHPLC log PTLC
1 398.517 7 3 1.89 0.85
2 350.473 7 3 1.37 0.55
3 404.565 7 3 3.04 1.86
4 412.544 7 3 2.48 1.39
5 442.57 8 3 2.37 1.29
6 432.962 7 3 3.08 1.76
7 477.413 7 3 2.88 1.50
8 362.484 7 3 1.74 0.61
9 428.543 8 3 1.95 1.02
10 380.502 6 1 1.77 0.91
11 332.458 6 1 1.37 0.85
12 386.55 6 1 3.15 2.13
13 394.529 6 1 2.9 1.86
14 424.555 7 1 2.86 1.86
15 428.974 6 1 2.97 1.76
16 473.425 6 1 2.79 1.55
17 344.469 6 1 1.72 0.96
18 410.528 7 1 1.96 1.39
log POW= 2.3137 × log k + 2.2013
log P
OW
Con dence interval 0.95
-0.8 -0.6 -0.4 -0.2 0.0 0.2 0.4 0.6 0.8 1.0 1.2 1.4
log k 0.5
1.0 1.5 2.0 2.5 3.0 3.5 4.0 4.5 5.0 5.5
Similar procedures were carried out for RP-TLC method. In this case, the mobile phase containing 70% methanol in water (%, v/v) was proved to be the best selectivity system. Linear relationships between the RM and the log POW was obtained (Figure 2):
y = (2.8458 ± 0.12)x + (1.6296 ± 0.09)
r = 0.9950 ± 0.04, n = 8, F = 599.9, se = 0.16 (7)
The determination of linear relationships between experimental lipophilicity parameters (log PHPLC and
log PTLC) and calculated log P values is a necessary step
for QSAR analysis.25 In our work, these correlations
were performed separately for two groups of tested compounds and the extrapolated log kW and RMW values
and experimentally established log PHPLC and log PTLC values were compared with calculated log P (log Pcalc).
Generally, in the case of the RP-HPLC method, high values of correlation coefficient were obtained for first group of analyzed compounds (thiosemicarbazide derivatives) (0.8244 < r < 0.9808) in comparison with their cyclic analogues (0.6615 < r < 0.9456). The weaker correlations were obtained for RP-TLC method, where for the first group of compounds, the partition coefficient was in the range: 0.7770 < r < 0.9795 and for second group: 0.6183 < r < 0.9030. The best results for correlations between the experimental and calculated partition coefficients were obtained for relationships between extrapolated (log kW and RMW), experimental (log PHPLC and
log PTLC) parameters and calculated partition coefficient.
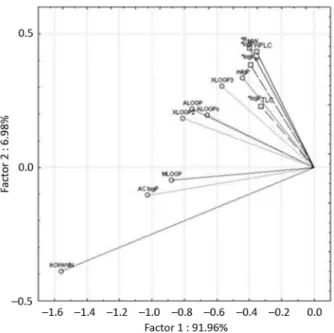
In order to better illustrate these correlations, the unscaled principal component analysis (PCA) with loadings interpretation was used. The experimental data (log kW,
RMW, log PHPLC and log PTLC) from Tables 3 and 5 and the
calculated log P parameters (from Table 6) were grouped as data matrix and they were analyzed using PCA, based on covariance matrix (unscaled PCA) using the Statistica 8 (StatSoft Inc. 2007) and results are presented in Figure 3. The experimental data was used as supplementary data
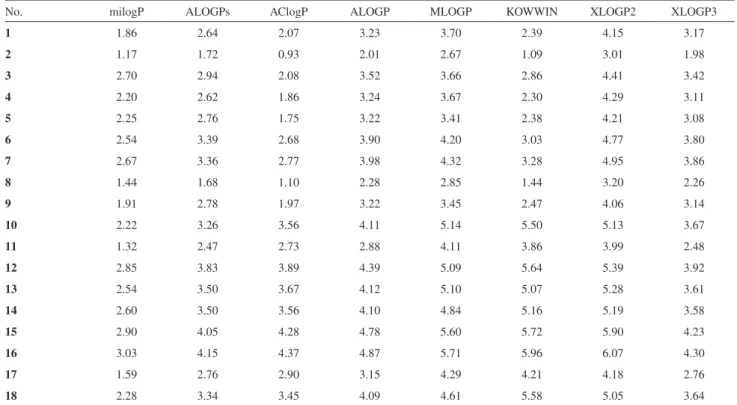
Table 6. Values of log Pcalc parameter calculated by computer programs. The values of log PHPLC and log PTLC are presented in Table 5
No. milogP ALOGPs AClogP ALOGP MLOGP KOWWIN XLOGP2 XLOGP3
1 1.86 2.64 2.07 3.23 3.70 2.39 4.15 3.17
2 1.17 1.72 0.93 2.01 2.67 1.09 3.01 1.98
3 2.70 2.94 2.08 3.52 3.66 2.86 4.41 3.42
4 2.20 2.62 1.86 3.24 3.67 2.30 4.29 3.11
5 2.25 2.76 1.75 3.22 3.41 2.38 4.21 3.08
6 2.54 3.39 2.68 3.90 4.20 3.03 4.77 3.80
7 2.67 3.36 2.77 3.98 4.32 3.28 4.95 3.86
8 1.44 1.68 1.10 2.28 2.85 1.44 3.20 2.26
9 1.91 2.78 1.97 3.22 3.45 2.47 4.06 3.14
10 2.22 3.26 3.56 4.11 5.14 5.50 5.13 3.67
11 1.32 2.47 2.73 2.88 4.11 3.86 3.99 2.48
12 2.85 3.83 3.89 4.39 5.09 5.64 5.39 3.92
13 2.54 3.50 3.67 4.12 5.10 5.07 5.28 3.61
14 2.60 3.50 3.56 4.10 4.84 5.16 5.19 3.58
15 2.90 4.05 4.28 4.78 5.60 5.72 5.90 4.23
16 3.03 4.15 4.37 4.87 5.71 5.96 6.07 4.30
17 1.59 2.76 2.90 3.15 4.29 4.21 4.18 2.76
18 2.28 3.34 3.45 4.09 4.61 5.58 5.05 3.64
log P = 2.8458 × R + 1.6296
OW M
Con dence interval 0.95
-0.4 -0.2 0.0 0.2 0.4 0.6 0.8 1.0 1.2 1.4
RM 0.5
1.0 1.5 2.0 2.5 3.0 3.5 4.0 4.5 5.0 5.5
log P
OW
(in Figure 3 they are marked with squares). The strongest correlations between the experimental log P factors and
parameters were confirmed.
Obtained results confirm that the chromatographic methods used to measure the lipophilicity of the thiosemicarbazides and their cyclic analogues 1,2,4-triazol-3-thiones are valid and suitable.
Conclusions
Values of the relative lipophilicity parameters log kW and
RMW were converted into log PHPLC and log PTLC values by
use of the a calibration graph obtained by use of ten standard solutes. This study shows that aniline, 2-hydroxyquinoline, bromobenzene, naphthalene, propylbenzene, biphenyl, butylbenzene and pentylbenzene are useful as reference substances for the determination of partition coefficient octanol-water using HPLC and TLC methods.
The influence of the structure of the thiosemicarbazides and their cyclic analogues 1,2,4-triazol-3-thiones on the value of lipophilicity was observed.
Moreover, the good correlation between the intercept (log kW, RMW) and slope (S) confirms the suitability
of these systems for estimation of the lipophilicity of thiosemicarbazide derivatives and their cyclic analogues.
The best correlations between the experimental (or extrapolated) partition coefficients and milogP parameters were obtained. Generally, higher values of partition coefficient for these relationships were obtained for RP-HPLC method.
References
1. Popiołek, Ł.; Kosikowska, U.; Dobosz, M.; Malm, A.; J. Enzyme Inhib. 2013, 28, 479.
2. Leo, A.; Hansch, C.; Elkins, D.; Chem. Rev. 1971, 71, 525. 3. Boyce, C. B. C.; Milborrow, B. V.; Nature 1965, 6, 537. 4. Fujita, T.; Iwasa, J.; Hansch, C.; J. Am. Chem. Soc. 1964, 86,
5175.
5. Komsta, Ł.; Skibiński, R.; Berecka, A.; Gumieniczek, A.; Radkiewicz, B.; Radoń, M.; J. Pharm. Biomed. Anal. 2010,
53, 911.
6. Rabtti, El H. M. A.; Natic, M. M.; Milojkovic-Opsenica, D. M.; Trifkovic, J. D.; Vuckovic, I. M.; Vajs, V. E.; Tesic, Z. L.; J. Braz. Chem. Soc. 2012, 23, 522.
7. Margabandu, R.; Subramani, K.; Int. J. ChemTech Res. 2010,
2, 150.
8. Casoni, D.; Sârbu, C.; Chromatographia 2009, 70, 1277. 9. Kepczyńska, E.; Obłoza, E.; Stasiewicz-Urban, A.; Bojarski, J.;
Pyka, A.; Acta Pol. Pharm. 2007, 64, 295.
10. Kowalska, A.; Pluta, K.; J. Liq. Chromatogr. Relat. Technol.
2012, 35, 1686.
11. Pignatello, R.; Puglisi, G.; Pharm. Acta Helv. 2000, 74, 405.
12. Hong, H.; Wang, L.; Zou, G.; J. Liq. Chromatogr. Relat. Technol.
1997, 20, 3029.
13. Musioł, R.; Jampilek, J.; Podeszwa, B.; Finster, J.; Tabak, D.; Dohnal, J.; Polanski, J.; Cent. Eur. J. Chem. 2009, 7, 586. 14. Ilijaš, M.; Malnar, I.; Marković, V. G.; Stepanić, V.; J. Pharm.
Biomed. Anal. 2013, 76, 104.
15. Foteeva, L. S.; Trofimov, D. A.; Kuznetsova, O. V.; Kowol, C. R.; Arion, V. B.; Keppler, B. K.; Timerbaev, A. R.; J. Pharm. Biomed. Anal. 2011, 55, 409.
16. Dąbrowska, M.; Starek, M.; Skucinński, J.; Talanta 2011, 86, 35.
17. Barbato, F.; Cirocco, V.; Grumetto, L.; La Rotonda, M. I.; Eur. J. Pharm. Sci. 2007, 31, 288.
18. Darrouzain, F.; Dallet, P.; Dubost, J. P.; Ismaili, L.; Pehourcq, F.; Bannwarth, B.; Matoga, M.; Guillaume, Y. C.; J. Pharm. Biomed. Anal. 2006, 41, 228.
19. Stępnik, K. E.; Malinowska, I.; J. Chromatogr. A 2013, 1286, 127.
20. Moreno, E.; Gabano, E.; Torres, E.; Platts, J. A.; Ravera, M.; Aldana, I.; Monge, A.; Pérez-Silanes, S.; Molecules 2011, 16,
7893.
21. Lipinski, C. A.; Lombardo, F.; Dominy, B. W.; Feeney, P. J.;
Adv. Drug Delivery Rev. 1997, 23, 4.
22. Organization for Economic Cooperation and Development (OECD), Guideline for the Testing of Chemicals, Partition Coefficient (n-Octanol/Water): Shake Flask Method, Guideline 107, 1995.
23. Czyrski, A.; Kupczyk, B.; J. Chem.2013, 2013, ID 419194.
24. Leśniewska, M. A.; Gdaniec, Z.; Muszalska, I.; Drug Dev. Ind. Pharm. 2015, 41, 663.
25. Rabtti, El H. M. A.; Natic, M. M.; Milojkovic-Opsenica, D. M.; Trifkovic, J. Ð.; Vuckovic, I. M.; Vajs, V. E.; Tešic, Ž. L.; J. Braz. Chem. Soc.2012, 23, 522.
26. Sochacka, J.; Kowalska, A.; J. Planar Chromatogr.--Mod. TLC
2006, 19, 307.
27. Krauth, F.; Dahse, H. M.; Rüttinger, H. H.; Frohberg, P.; Bioorg. Med. Chem. 2010, 18, 1816.
28. Główka, F.; Romański, M.; Siemiątkowska, A.; J. Chromatogr. B: Anal. Technol. Biomed. Life Sci. 2013, 923, 92.
29. Bakht, M. A.; Alajm, M. F.; Alam, P.; Alam, A.; Alam, P.; Ajarba, T. M.; Asian Pac. J. Trop. Biomed. 2014, 4, 329.
30. Snyder, L. R.; Dolan, J. W.; Gant, J. R.; J. Chromatogr. 1979,
165, 3.
31. Organization for Economic Cooperation and Development (OECD), Guideline for the Testing of Chemicals, Partition Coefficient (n-Octanol/Water): High Performance Liquid
Chromatography [HPLC] Method, Guideline 117, 2004.
32. www. molinspiration.com accessed in May 2013.
33. Viswanadhan, V. N.; Ghose, A. K.; Revankar, G. R.; Robins, R. K.; J. Chem. Inf. Comput. Sci. 1989, 29, 163.
34. www.vcclab.org accessed in May 2013.
35. Pitucha, M.; Matysiak, J.; Senczyna, B.; Monatsh. Chem. 2012, 143, 657.
36. Ghose, A. K.; Crippen, G. M.; J. Chem. Inf. Comput. Sci. 1987, 27, 21.
37. Biagi, G. L.; Barabaro, A. M.; Sapone, A.; J. Chromatogr. A
1994, 662, 341.
38. Lipinski, C. A.; Lombardo, F.; Dominy, B. W.; Feeney, P. J.; Adv. Drug Delivery Rev. 2001, 46, 3.
Submitted on: April 16, 2015