Printed in Brazil - ©2007 Sociedade Brasileira de Química 0103 - 5053 $6.00+0.00
A
r
ti
c
le
*e-mail: [email protected]
Analysis of
ortho
-Cresol in Urine by Solid Phase Microextraction-Capillary Gas Chromatography
Maria José N. de Paiva,a Isarita Martins b and Maria Elisa P. B. de Siqueira*,b
a
Departamento de Análises Clínicas e Toxicológicas, Universidade de São Paulo, Av. Lineu Prestes, 580, 5508-900 São Paulo-SP, Brazil
b
Laboratório de Análises Toxicológicas, Universidade Federal de Alfenas, Rua Gabriel Monteiro da Silva, 714, 37130-000 Alfenas-MG, Brazil
Neste trabalho foi desenvolvido um método usando a microextração em fase sólida (SPME) para análise cromatográfica em fase gasosa capilar com detector de ionização por chama (CG/ IC) de orto-cresol urinário, metabólito do tolueno. Após otimização das variáveis da SPME e da validação do método, foram analisadas amostras de urina de 27 trabalhadores expostos a solventes em oficinas de reparo automotivo. As melhores condições de extração foram obtidas com a hidrólise ácida da urina, extração em fibra de carbowax/divinilbenzeno (CW/DVB) 70 µm
por 20 min em pH neutro, com adição de 3 g de Na2SO4, sob agitação. O método mostrou linearidade entre 0,1 e 1,5 mg L-1 de o-cresol em urina, LOQ de 0,1 mg L-1, repetibilidade entre
6,8 e 7,8%. O valor médio de o-cresol em urina dos trabalhadores foi de 0,35 ± 0,23 mg L-1. O
método SPME/CG/DIC mostrou ser rápido, simples e aplicável para fins de biomonitorização de trabalhadores expostos.
The object of the present study was the development of method for the determination of urinary ortho-cresol using solid-phase microextraction (SPME), followed by capillary gas chromatography-flame ionization detection (GC/FID). After optimization of the SPME variables and validation of the method, it was applied to analysis of o-cresol in urine collected from 27 workers exposed to solvents in automotive repair shops. The maximum extraction efficiency was obtained using fiber of carbowax-divinylbenzene (CW/DVB), 70 µm, immerged 20 min in acid hydrolysed urine added with 3 g Na2SO4 at pH 7.0 and under magnetic stirring. The method
showed linearity between 0.1 to 1.5 mg L-1, LOQ of 0.1 mg L-1, precision between 6.8 to 7.8%
CV. Mean o-cresol in urine from exposed workers was 0.35 ± 0.23 mg L-1. The SPME-GC/FID
method is fast, simple and can be applied to the occupational toluene biomonitoring.
Keywords: urinary ortho-cresol, SPME, biomonitoring, toluene
Introduction
Organic solvents are extensively used in paints, thinners, varnishes, lacquers and glues, among others.1,2 In automotive repair and repainting shops workers use solvent-containing paints and diluents. The composition of the solvent varies according to the purpose of the product; however, toluene continues to be the most prevalent and is mixed with other compounds such as ethers, ketones and hexane.3,4
Both acute and chronic occupational exposure to solvents represents a health risk, with the central nervous system being the most affected site.5,6 Program for biological monitoring of the exposed workers has been
recommended in different countries to prevent the occurrence of intoxications.7
additives or drugs than hippuric acid. The para isomer of cresol is excreted in large amounts and is ubiquitous in urine of the general population and it is not used for biomonitoring.14-16
Since only about 1.0% of the absorbed toluene is transformed into cresols,9,17 more sensitive techniques are necessary for their determination such as gas or high-performance liquid chromatography generally coupled to a mass detector.1,18 Irrespective of the identification technique, previous sample preparation is required starting with the hydrolysis of urinary conjugates, followed by liquid-liquid extraction,8,17 C1819 or vapor stream distillation.1
Solid-phase microextraction (SPME) is an extraction technique introduced by C. Arthur and J. Pawliszyn in 1990,20 and is a rapid, simple and sensitive extraction method for the analysis of aqueous samples.21 Extraction is based on the partition of the analyte between the fiber material and the aqueous medium. The distribution of the analyte between the two phases depends on the physicochemical in-teraction between the solute and polymeric phase.20-22 The partition equilibrium is influenced by different factors such as pH, salt addition, stirring, and temperature.23,24 This extraction technique has many advantages such as the fact that no solvents are used, easy handling, relatively short extraction time, direct injection of the analytes into the gas chromatograph, and good linearity for many substances. SPME has been used for the determination of volatile and semi-volatile compounds present in water,22,25 and biological material,18,26-28 among others.29
In the present study, we describe an analytical method for the determination of o-cresol in urine using SPME by direct immersion of the fiber in the biological material, after acid hydrolysis of the conjugates, followed by capillary gas chromatography-flame ionization detection. The method was applied to the determination of urinary o-cresol in workers exposed to solvents in automotive repair shops.
Experimental
Chemicals
Analytical grade o-cresol (99.5%), m-cresol (99%), p-cresol (>99%) (Fluka, Buchs, Switzerland), p -nitroaniline (>98%) (J.T. Baker, Phillipsburg, NJ, USA), sodium sulfate (Merck, Darmstadt, Germany), methanol (99.8%), hydrochloride acid, and sodium hydroxide (Vetec, Duque da Caxias, RJ, Brazil) were used.
Extraction
SPME device was purchased from Supelco (Bellefonte, PA, USA), with the fused silica fiber being coated with 70 µm carbowax/divinylbenzene (CW/DVB), 100 µm polydimethylsiloxane (PDMS) and 75 µm CW/PDMS. Prior to the use the SPME fibers were conditioned according to the supplier, i.e., 250 °C per 60 min for PDMS, 280 °C per 30 min for CW/PDMS and 250 °C per 30 min for CW/DVB. The extractions were performed in 15 mL glass clear vials sealed with PTFE/silicone septa from Supelco (Bellefonte, PA, USA) under agitation with 1 cm magnetic stirring bars.
Gas-cromatograph
A GC-1000 gas chromatograph equipped with a flame ionization detector (Ciola and Gregori, São Paulo, Brazil) was used. Chromatographic separation was performed on a ZB-35® phenylmethylpolysiloxane column (30 m length × 0.53 mm i.d. × 0.50 µm film thickness, Phenomenex) using nitrogen as mobile phase at a flow rate of 8.0 mL min-1 and the injector in the splitless mode at 210 °C. The temperatures of the column oven and detector were set at 190 and 220 °C, respectively.
Optimization of SPME conditions
The following factors influencing the extraction performance were evaluated: type of fiber coating, pH (2.0, 4.0, 6.0, 7.0 and 8.0), time of adsorption (10, 20, 30 and 40 min) and desorption of the analytes from the fiber (1, 2, 3, and 4 min), effect of salt addition (0.5, 1, 2, 3 and 4 g Na2SO4), and effect of stirring of the medium, the five last variables only for the CW/DVB fiber.
Sample preparation
Validation of the procedure
Linearity
The linearity of the method was evaluated by the addition of standard o-cresol solutions to samples of a urine pool (a mixture of urine from six volunteers non exposed to solvents) in order to obtain the following concentrations: 0.1, 0.2, 0.5, 0.8, 1.0 and 1.5 mg L-1. These samples and a blank of the urine pool treated as the samples were analyzed in sextuplicate.
Repeatibility
Urine samples spiked with 0.1, 0.5 and 1.5 mg L-1 o-cresol were analyzed in sextuplicate on the same day to determine within-run precision. Day-by-day precision was determined using o-cresol concentrations of 0.5, 1.0 and 1.5 mg L-1 for 10 consecutive days. Results were expressed by the coefficient of variation (%CV).
Detection and quantitation limits
The detection limit (LOD) was defined as the lowest concentration that could be determined with confidence, i.e., the minimum concentration added to the sample that presented a signal-to-noise ratio of 3, which was obtained by successive dilutions of a sample spiked with 0.5 mg L-1 o-cresol. The quantitation limit (LOQ) was defined as the lowest concentration measured with adequate precision and that must be included in calibration curve, which was obtained by successive dilution of a urine sample spiked with 1.0 mg L-1 o-cresol.
Application of the assay to biological monitoring
Urine samples were collected into polyethylene flasks from a single miction at the end of the last day of one week’s work and transported to the laboratory under refrigeration. Specific gravity and creatinine were determined before the samples were frozen at –20 °C for analysis of o-cresol. Samples were collected from 27 individuals exposed to organic solvents in automotive repair and repainting shops and from 25 volunteers not exposed to organic solvents. All volunteers were males, with age ranging from 20 to 59 years. The research protocol was approved by the Ethical Committee on Research of the University.
Results and Discussion
SPME optimization
Among the fiber types evaluated carbowax/divinyl-benzene (CW/DVB), polydimethylsiloxane (PDMS) and
PDMS/DVB, CW/DVB yielded the best extraction efficiency regarding the extraction of o-cresol from urine, although it is less durable than PDMS fiber. In this study each CW/DVB fiber was used circa 60 extractions. Van Doorn et al.,25 testing three fiber types for the determination of aromatic acids in water, obtained the lowest LOD for the CW/DVB fiber. The study of the several variables in SPME extraction were performed only to the fiber selected. The effect of pH on extraction performance was evaluated since some compounds might be protonated, thus reducing performance. A pH adjusted to 7.0 yielded the best analyte adsorption to the fiber coating. On the other hand, neutralization of the medium is necessary to preserve both the fiber and GC column from strong acids. A significant increase in extraction performance was observed when the sample was stirred, with fiber exposure under stirring leading to a 4-fold increase in extraction performance. Arthur et al.21 demonstrated that stirring reduced the time of equilibrium and the detection limit, but no greater retention of the analytes was observed after a certain period of time. Cho et al.30 also demonstrated the efficiency of stirring in the extraction performance of trihalomethanes from water samples, with 2-fold greater peak areas being obtained for stirred samples compared to static samples.
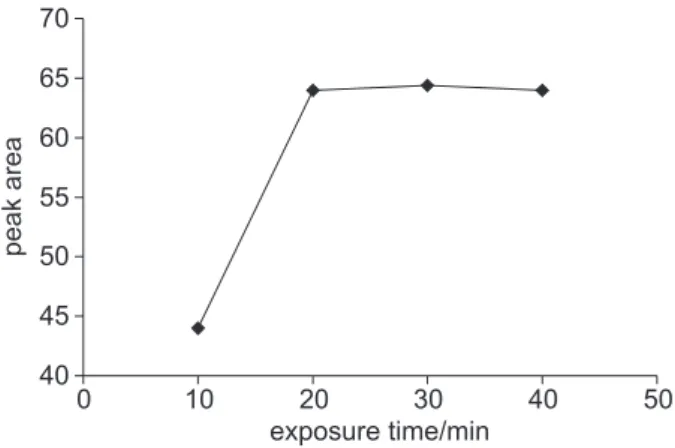
Figure 1 shows the peak area versus extraction time over an interval of 10 to 40 minutes, in samples submitted to agitation. It can be seen that after 20 min there is no improvement on the peak area. An extraction period of 20 min was chosen for subsequent experiments using the CW/DVB fiber. Time to equilibrium is a function of the analyte and conditions used (e.g. fiber chemistry and its thickness) and this is usually measured experimentally for a given set of conditions.
The desorption of the analyte from the 70 µm CW/DVB fiber was complete when the fiber was exposed in the GC injector port for 3 min at 210 °C.
Figure 1. Peak areas versus extraction time obtained with CW/DVB
fi-ber for o-cresol in urine spiked with 2 mg L-1 and stirred.
40 45 50 55 60 65 70
0 10 20 30 40 50
exposure time/min
peak
The addition of salt increases the affinity of the analyte for the CW/DVB fiber phase by reducing matrix affinity. On the basis of this finding, sampling was performed in the presence of 3 g Na2SO4 which led to a 10-fold increase in the peak area of o-cresol compared to sampling without salt addition. However, quantities above 3.0 g did not result in a significant increase of the signal (Figure 2). Salt saturation of the sample was an artifact used by Arthur et al.21 to reduce the detection limit in the analysis of benzene, toluene, n-hexane and xylenes in water. Huang et al.22 observed a 4-fold increase in the concentration of o-cresol in water when using Na2SO4.
Chromatographic separation
Figure 3 shows chromatograms obtained for the analysis of blank urine spiked with o-cresol and an internal standard, p-nitroaniline, and from a sample obtained from a worker exposed to solvents in an automotive repair and repainting shop. With respect to the optimization of the chromatographic conditions, the best resolution was observed for the 35% phenyl/65% PDMS column, among other columns tested as 100% PDMS and 10% phenyl/90% PDMS. p-Nitroaniline was chosen as internal standard taking in account its retention time and resolution in the conditions established to GC run for SPME extracted urine samples; on the other hand, it is highly stable in solution.
Hydrolysis of o-cresol conjugates
o-Cresol is found in urine conjugated to sulfate and glucuronic acid. These conjugates should be hydrolyzed before extraction. In the present study, some acids and bases were tested and acid hydrolysis was chosen. Hydrolysis with sulfuric acid at 100 °C for 1 h has been used by some investigators.7,13,31 However, in view of the different interference peaks observed on the chromatogram when this type of hydrolysis was tested, we prefer to use other acids. Hydrochloride acid was chosen because of its efficiency in hydrolyzing conjugates and because it provides a chromatogram almost free of interference peaks.
Analytical figures of merit
The calibration curve for urinary o-cresol was linear in the range of 0.1 to 1.5 mg L-1 (y = 0.62606x – 0.03016), with a coefficient of correlation of 0.999. Narrower ranges of linearity, regardless of the analyte or type of matrix, are one of the characteristics of SPME. However, considering the low o-cresol concentrations in urine specimen, especially under current working conditions, this fact does not represent a disadvantage of the technique. Samples with higher o-cresol concentrations could be diluted prior to extraction. In the linear range, it is possible to quantify this metabolite in samples containing o-cresol levels below or above the biological limit of exposure of 0.50 mg L-1,12 thus being satisfactory for most situations of occupational exposure to the solvent. When using liquid-liquid extraction, the linear range reported by others researchers were: 0.2 to 10 mg L-1,1 5 to 100 mg L-1,19 and 50 to 500 mg L-1.28
The detection and quantification limits of the proposed method were 0.05 and 0.10 mg L-1, respectively. A lower detection limit of 0.006 mg L-1 has been reported by Fustinoni et al.18 for the determination of o-cresol in urine
Figure 2. Peak areas of ortho-cresol in function of the Na2SO4 mass added
to urine.
270
peak
area
Na SO /g2 4
220 170 120 70 20
0 1 2 3 4 5
Figure 3. Chromatograms of blank urine spiked with o-cresol (A) and
from a sample obtained from a worker exposed to solvents in an automo-tive repair and repainting shop (B), both added with internal standard, p-nitroaniline, and extracted by CW/DVB fiber.
15.00 10.00
5.00 7.50 12.50 2.50
50
50 150
150 100
100 200
200 0.00
0.00 2.00 4.00 6.00 8.00 10.00 12.00 14.00 16.00 18.00 0
0
17.50
time/min
OC
OC
IS
IS
A
using GC with mass spectrometry detection, result expected taking in account the characteristics of this detector. However, this highly expensive system is still not available in routine laboratories offering occupational biomonitoring in Brazil.
The coefficients of variation are shown in Table 1. Higher coefficients of variation in day-by-day study are not surprising since this study was conducted during ten subsequent days with samples kept on refrigeration at 4 °C and taking in account that cresols are semi-volatiles compounds. If we calculate CVs in the three first days, the CVs varied between 7.0 and 9.2. Amorim and Alvarez-Leite8 found values between 2.4 and 5.4% for o-cresol concentrations between 1.0 and 3.0 mg L-1 urine for interassay precision measured during three days by LLE GC/FID method.
Determination of o-cresol in the population studied
Urine samples were collected from workers of automotive repair shops at the end of the last work week’s day. This period is also recommended by the ACGIH.12
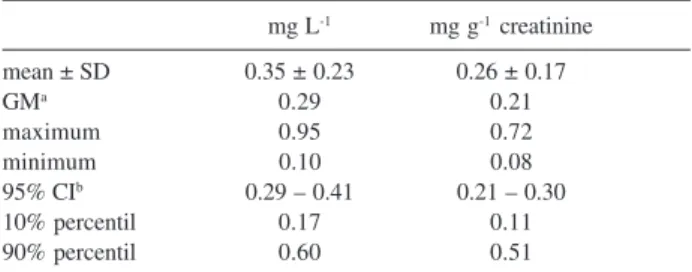
The results of o-cresol in urine from the workers, reported as mg L-1 or mg g-1 creatinine, are shown in Table 2. The maximum permitted concentration of biological indicators determined in urine samples derived from a single miction should be corrected for filtrated urine volume to compensate for fluctuations in metabolite excretion. In most cases, the values are corrected for urinary creatinine excretion, as several bioindicators determined in urine.11,12 Samples from volunteers not exposed to solvents showed not detectable values of o-cresol in urine.
Mean o-cresol concentration and standard deviation in the exposed group was 0.35 ± 0.23 mg L-1 (0.26 ± 0.17 mg g-1 creatinine) with eight subjects (29.6%) showing levels above the Biological Exposure Index (BEI) of 0.5 mg L-1 recommended by the ACGIH. The highest value observed was 0.95 mg L-1. BEI´s are guide values to evaluate the potential risk of a chemical to human health in industrial hygiene practice, but they do not mean a clear
distinction between a dangerous exposure or not.12 Although, protection measures in the wokplace must be introduced to avoid a possible further intoxication.
Conclusions
Optimization of the chromatographic and SPME parameters yielded a method for the determination of urinary o-cresol showing linearity, precision and quantification limit which permitted its application to the analysis of o-cresol in urine from workers exposed to toluene, among others solvents, in automotive repair shops. This method is promising for application to routine biomonitoring analyses of o-cresol in urine since it is simple, reliable and safe for the analyst, and allows the use of a gas chromatograph with flame ionization detector, equipment available in most of the laboratories.
Aknowledgments
The authors wish to thank CNPq and Capes for the financial support to this work.
References
1. Angerer, J.; Krämer, A.; Int. Arch. Occup. Environ. Health 1997, 69, 91.
2. Chen, J.D.; Wang, J.D.; Jang, J.P.; Chen, Y.Y.; Br. J. Ind. Med. 1991, 48, 696.
3. Bergeret, K; Nestler, K.; Sci. Total Environ. 1991, 101, 11. 4. Associação Brasileira da Indústria Química; Anuário da
Indústria Química Brasileira, vol. 29; ABIQUIM: São Paulo, 2002.
5. Greenberg, M.M.; Environ. Res. 1997, 72, 1. 6. Saito, K.; Wada, H.; Environ. Res. 1993, 62, 53.
7. Apostoli, P.; Brugnone, F.; Perbellini, L.; Cocheo, V.; Bellomo, M.L.; Silvestri, R.; Int. Arch. Occup. Environ. Health 1982, 50, 153.
8. Amorim, L.C.A.; Alvarez-Leite, E.M.; J. Toxicol. Environm. Health1997, 50, 401.
Table 2. o-Cresol in urine of the workers (n = 27)
mg L-1 mg g-1 creatinine
mean ± SD 0.35 ± 0.23 0.26 ± 0.17
GMa 0.29 0.21
maximum 0.95 0.72
minimum 0.10 0.08
95% CIb 0.29 – 0.41 0.21 – 0.30
10% percentil 0.17 0.11
90% percentil 0.60 0.51
ageometric mean; b95% confidence interval.
Table 1. Within-run and day-by-day precision (CV %) of spiked urine
samples in SPME/GC/FID analysis of o-cresol in urine
concentration / (mg L-1) CV%
within-run day-by-daya
0.1 7.8
-0.5 7.1 21.9
1.0 - 16.0
1.5 6.8 14.1
9. Angerer, J.; Int. Arch. Occup. Environ. Health1979, 43, 63. 10. Baelum, J.; Dossing, M.; Hansen, S.H.; Lundqvist,G.R.;
Andersen, N.T.; Int. Arch. Occup. Environ. Health1987, 59, 281.
11. Brasil, Secretaria de Segurança e Saúde no Trabalho; Portaria 24, de 29 de dezembro de 1994; Diário Oficial: Brasília, 1994, p. 21278.
12. American Conference of Governmental Industrial Hygienists (ACGIH); Threshold Limit Values and Biological Exposure Indices for 2003, ACGIH: Cincinnati, 2003.
13. Deutsche Forschungsgeinschaft (DFG), List of MAK and BAT Values 2002, Maximum Concentration and Biological
Tolerance Values at the Workplace; Wiley: Weinheim, 2002. 14. De Rosa, E.; Bartolucci, G.B.; Sigon, M.; Callegaro, R.;
Perbellini, L.; Brugnone, F.; Am. J. Ind. Med.1987, 11, 529. 15. Dossing, M.; Baelum, J.; Hansen, S.H.; Lundqvist, G.R.;
Andersen, N.T.; Br. J. Ind. Med. 1983, 40, 470.
16. Hasegawa, K.; Shiojima, S.; Koizumi, A.; Ikeda, M.; Int. Arch.
Occup. Environ. Health1983, 52, 197.
17. Truchon, G.; Tardif, R.; Brodeur, J.; Appl. Occup. Environ.
Hyg. 1999, 14, 677.
18. Fustinoni, S.; Mercadante, R.; Campo, L.; Scibetta, C.V.; Foá, V.; J. Chromatogr., B 2005, 817, 309.
19. Bieniek, G.; J. Chromatogr., B1996, 682, 167.
20. Arthur, C.L.; Pawliszyn, J.; Anal. Chem. 1990, 62, 2145. 21. Arthur, C.L.; KILLAM, L.M.; Buchholz, K.D.; Pawliszyn, J.;
Anal. Chem. 1992, 64, 1960.
22. Huang, S.; Cheng, C.; Sung, Y.; Anal. Chim. Acta1997, 343, 101.
23. Theodoridis, G.; Koster, E.H.M.; Jong, G.J.; J. Chromatogr. B 2000, 745, 49.
24. Pawliszyn, J.; J. Chromatogr. Sci.2000, 38, 270.
25. Van Doorn, H.; Grabanski, C.B.; Miller, D.J.; Hawthorn, S.B.; J. Chromatogr., A1998, 829, 223.
26. Junting, L., Peng, C., Suzuki, O.; Forens. Sci. Int.1998, 97, 93.
27. Krogh, M.; Johansen, K.; Tonnesen, F.; Ramussen, K.E.; J. Chromatogr., B 1995, 673, 299.
28. Lee, X.; Kumazawa, T.; Kondo, K.; Furuta, S.; Sato, K.; Legal Med. 1999, 1, 231
29. Pini, G.F.; Brito, E.S.; Garcia, N.H.P.; Valente, A.L.P.; Augusto, F.; J. Braz. Chem. Soc. 2004, 15, 267.
30. Cho, D.; Kong, S.; Oh, S.; Water Res. 2003, 37, 402. 31. Nise, G.; Int. Arch. Occup. Environ. Health1992, 63, 377.
Received: August 28, 2006
Web Release Date: August 20, 2007