Article
Printed in Brazil - ©2016 Sociedade Brasileira de Química0103 - 5053 $6.00+0.00*e-mail: [email protected]
Evaluation of QuEChERS Sample Preparation and Gas Chromatography Coupled
to Mass Spectrometry for the Determination of Pesticide Residues in Grapes
Fernanda Volpatto,a Arci D. Wastowski,a Gabrieli Bernardi,b Osmar D. Prestes,b Renato Zanellab and Martha B. Adaime*,b
aDepartamento de Ciências Agronômicas e Ambientais, Centro de Educação Superior Norte do Rio
Grande do Sul (CESNORS), Universidade Federal de Santa Maria, 98400-000 Frederico Westphalen-RS, Brazil
bLaboratório de Análises de Resíduos de Pesticidas (LARP), Departamento de Química, Centro de
Ciências Naturais e Exatas (CCNE), Universidade Federal de Santa Maria, 97105-900 Santa Maria-RS, Brazil
An effective analytical method for pesticides multiresidue determination in grape samples was developed and validated. A modified quick, easy, cheap, effective, robust and safe (QuEChERS) method was used to extract the target compounds. Several sorbent materials were tested for the
clean-up step using dispersive solid phase extraction (d-SPE) and Florisil® was selected. Samples
extracts were evaporated before injection in the gas chromatography with mass spectrometry (GC-MS) system in order to improve detectability. Recoveries from blank samples spiked at 0.04,
0.3 and 1.0 mg kg−1 ranged from 95 to 102% with relative standard deviation (RSD) from 1.3 to
19.7%. Method limits of detection (LODm) and quantification (LOQm) ranged from 0.006 to 0.012 and 0.02 to 0.04 mg kg−1, respectively. The positive matrix effect caused an increase in the peak areas
of all compounds and matrix matched calibration curve linearity (coefficient of determination, r2)
was higher than 0.98 for all target analytes. The validated method was successfully applied for the determination of 19 pesticides in grape samples.
Keywords: QuEChERS, fruits, pesticides, GC-MS
Introduction
Agricultural products such as fruits, vegetables and cereals are the most analyzed matrices in routine laboratories, often presenting pesticide residues of different classes.1 Grape is widely cultivated and consumed
worldwide, as well as its derivate products. Besides the pesticides use by grape growers, contamination may occur from indirect sources, such as other agricultural crops cultivated near to the vineyards.2 Thus, pesticide residues
monitoring becomes essential to ensure food safety for consumers, especially in a situation where regulations are becoming increasingly restrictive in most countries.3
Because of the pesticide concentration are generally low and the analytes show different chemical properties, its determination requires a preliminary stage of sample preparation. Quick, easy, cheap, effective, robust and safe (QuEChERS) method was initially developed for fruits
and vegetables by Anastassiades et al.4 and it is based on
an extraction step with acetonitrile followed by a partition step with salts and dispersive solid phase extraction (d-SPE) clean-up using small quantities of sorbents. Some modifications were proposed to the QuEChERS method, e.g., buffering,5,6 use of others extraction solvents,7 different
sorbents as graphitized carbon black (GCB),8 octadecyl
(C18), Florisil® (magnesium silicate) and alumina,9
and the use of low temperature precipitation for fatty matrices.10 These modifications allowed the extraction of
a large number of pesticides from different classes and matrices. Most part of the modifications was focused in the clean-up step and different sorbents have been used besides primary and secondary amine (PSA) and C18.11
Alumina or aluminum oxide (Al2O3), commonly applied in
chromatographic separation of lipophilic compounds, has been used as d-SPE sorbent for pesticides determination.12
Choi et al.13 used GCB for the determination of pesticides in different matrices. Florisil®, currently used for separation
in sample preparation by QuEChERS and matrix solid phase dispersion (MSPD).14,15 Several publications have
reported the determination of pesticides in grapes, using different extractions methods combined with liquid16,17 or
gas chromatography.18-23 Melo et al.16 use aminopropyl (NH 2)
and C18 d-SPE sorbents combined with single wavelength high-performance liquid chromatography (HPLC) for multiclass determination of fungicides and herbicides in grapes. Limits of quantification (LOQ) values ranged from 43 to 86 µg kg−1 using a pre concentration factor of 2.5.
Banerjee et al.20 optimized for multiresidue method with ethyl acetate extraction and d-SPE clean up using PSA. Gas chromatography with mass spectrometry (GC-MS) using single quadrupole were used for determination, achieving desired sensitivity and selectivity to 47 analytes in compliance with the maximum residue level (MRL) established by the European Commission (EU).24 The most
common GC-MS techniques for the analysis of pesticides involves single quadrupole instrumentation with electron impact (EI) ionization. Ion trap detectors (ITD) are also used, presenting the advantage of higher sensitivity using the full-scan mode, when compared to single quadrupole. Savant et al.18 andGonzález-Rodríguez et al.19 successfully reported the use of GC-ITD for the determination of pesticides in grapes. GC-MS (single quadrupole or ITD) offers certain special benefits in terms of significantly less expensive instrumentation, low maintenance cost and easy operation.20,25
A table grape cultivar known in Brazil as Isabel represents 50% of Brazilian grape production, being the basic raw material for the elaboration of table wine, grape juice and others derivatives.26,27 Results of the Brazilian
pesticides monitoring programs from 2010 to 2012 for several crops showed that grape is one of the cultures with most irregularities regarding to non-authorized pesticides.28
Brazilian legislation establishes MRL for 49 pesticides in grape, ranging from 0.005 to 15 mg kg−1.28 Bearing in
mind these results, grow the concern over pesticides use and the need of methods able to achieve desirable limits for pesticides determination.
Due to the existence of few methods for the determination of pesticide residues in grapes and the occurrence of these compounds, this paper describes the optimization and validation of a modified QuEChERS method for determination of 19 pesticides in grape samples by GC-MS.
Experimental
Chemicals, reagents and samples
Toluene HPLC grade was acquired from Mallinckrodt Pharmaceuticals (Dublin, Ireland); acetonitrile HPLC
grade and anhydrous magnesium sulfate (MgSO4) from
J. T. Baker (Tokyo, Japan). Acetic acid, sodium chloride and anhydrous sodium acetate were purchased from Vetec (Rio de Janeiro, Brazil). Florisil® was acquired from Anidrol
(Diadema, Brazil); alumina and graphitized carbon black
from Sigma-Aldrich (St. Louis, USA); Bondesil® PSA
and Bondesil® C18 were purchased from Agilent (Santa
Clara, USA).
Blank grape samples from cultivar Isabel were obtained from organic controlled production (Frederico Westphalen, Brazil) and were processed and stored at −18 ºC until analysis.
Pesticide analytical standards with purity between 94.0 and 99.5% were acquired from Dr. Ehrenstorfer GmbH (Augsburg, Germany). Quintozene29 and caffeine
(both 99%) were employed as surrogate standard (SS) and internal standard (IS), respectively. Standards were prepared in toluene in a concentration of 1000 mg L−1 and
stored at −18 °C. From the individual stock solutions, a standard mixture containing 5 mg L−1 of each analyte was
prepared in toluene and stored at −18 °C.
Instrumentation
The GC-MS system was a gas chromatograph 3900 GC coupled to an ion trap mass spectrometer detector Saturn 2100T and a CP 8400 autosampler; data was acquired using MS Workstation 6.9.2 software (Varian, Palo Alto, USA). Analytical balance AY220 from Shimadzu (Tokyo, Japan), sample concentrator Tecvap TE-0195 from Tecnal (Piracicaba, Brazil), centrifuges 206 BL from Fanem (Guarulhos, Brazil) and NT 810 from Nova Técnica (Piracicaba, Brazil) were used.
GC-MS conditions of analysis
Chromatographic separation was achieved on a Varian VF-5ms (Palo Alto, USA; 5% fenil-95% polydimethylsiloxane), capillary column (30 m × 0.25 mm
i.d., 0.25 µm of film thickness). Helium with a purity of 99.999% (Linde, Munich, Germany) was used as the carrier gas. Aliquots of 2 µL were injected in splitless mode with the injector temperature set at 300 ºC. The column oven temperature program was initially 80 °C increasing to 200 °C at 25 °C min−1. Then, increasing to 230 °C at 3 °C min−1 and
to 260 °C at 15 °C min−1. Finally, temperature was raised
to 280 °C at 30 °C min−1 remaining for 6.5 min. Total run
mode, MRLs, retention time, and GC-MS quantification and confirmation ions. The manifold, trap and transfer line temperatures were set at 80, 240 and 290 °C, respectively. The emission current of the ionization filament was set at 40 µÅ and the amplitude voltage was 200 V.
Evaluation of sample preparation procedure
The extraction process was evaluated to find the best method to extract the selected pesticides from grape samples. Thus, two versions of the QuEChERS method were evaluated: (i) QuEChERS original and (ii) QuEChERS acetate.4,5 The conditions used are described below.
QuEChERS original extraction4
Ten grams of homogenized grapes were transferred into a polypropylene (PP) centrifuge tube (50 mL); 20 µL of surrogate standard (100 mg L−1) and 10 mL of acetonitrile
were added. The tube was shaken vigorously in vortex (1 min) and after this 4 g MgSO4 and 1 g sodium chloride
were added. The mixture was immediately hand shaken for
1 min and then was centrifuged at 2,420 × g for 20 min.
To the fortification assays a mix containing all the target analytes at a concentration of 0.5 mg kg−1 was added to the
blank grape samples and let in contact with the sample for 1 h before extraction.
QuEChERS acetate extraction5
The same procedure as the QuEChERS original was performed changing only two conditions: use of acetonitrile with 1% (v/v) acetic acid and sodium acetate instead of acetonitrile and sodium chloride, respectively.
Clean-up options evaluated
For the up step, seven approaches of d-SPE clean-up were evaluated. For this purpose, 2 mL of extract was transferred to a PP centrifuge tube (15 mL) containing 300 mg of MgSO4 and the sorbents according to Table 2.
In all cases, tubes were hand shaken (1 min), centrifuged at 2,420 × g for 8 min and 1 mL of the supernatant after
filtration in nylon filter (0.2 µm) was evaporated under
Table 1. Selected compounds, molecular formula, action mode, Brazilian and European Union (EU) maximum residue level (MRL), retention time (tR)
and monitored ions
Compound Molecular formula Action mode MRL / (mg kg
−1)
tR / min
Monitored iona /
(m/z)
Brazil EU
Chlorothalonil C8Cl4N2 fungicide 5 3 8.88 266, 268, 265
Metalaxyl C15H21NO4 fungicide 1 1 10.00 206, 249, 207
Triadimefon C14H16ClN3O2 fungicide 2 2 11.21 208,181, 57, 210
Cyprodinil C14H15N3 fungicide NA 5 11.98 224, 210, 225, 226
Procymidone C13H11Cl2NO2 fungicide 5 0.01 12.59 96, 283, 285
Endosulfan alpha C9H6Cl6O3S insecticide NA 0.05 13.64 339, 207, 341
Myclobutanil C15H17ClN4 fungicide 0.5 1 14.51 179, 181, 180
Buprofezin C16H23N3OS insecticide NA 1 14.57 175, 105, 104
Endosulfan beta C9H6Cl6O3S insecticide NA 0.05 15.92 195, 339, 197
Trifloxystrobin C20H19F3N2O4 fungicide NA 5 16.93 131, 132, 130, 206
Endosulfan sulfate C16H23N3OS insecticide NA 0.05 17.16 387, 272, 389, 385
Tebuconazol C16H22ClN3O fungicide 2 1 17.63 250, 125, 197
Epoxiconazol C17H13ClFN3O fungicide NA 0.05 18.00 192, 138, 194
Bifenthrin C23H22ClF3O2 insecticide 0.1 0.2 18.38 181, 166, 165
Fenpropathrin C22H23NO3 insecticide NA 0.01 18.71 181, 265, 182
Tetradifon C12H6Cl4O2S insecticide NA 0.01 19.00 356, 159, 358
cis-Permethrin C21H20Cl2O3 insecticide 0.05 0.05 20.56 183, 184, 165
trans-Permethrin C21H20Cl2O3 insecticide 0.05 0.05 20.74 183, 184, 165
Etofenprox C25H28O3 insecticide NA 5 22.51 163, 135, 164
Quintozene (SS) C6Cl5NO2 fungicide − − 8.48 295, 265, 297, 293
Caffeine (IS) C8H10N4O2 − − − 9.40 194, 195, 109
nitrogen stream, until 150 µL. The final volume was adjusted to 200 µL with acetonitrile before injection.
Optimized method based on QuEChERS procedure
Ten grams of homogenized grape sample were weighed in a 50 mL PP centrifuge tube and 100 µL of the surrogate standard (10 mg L−1) were added in order to minimize
the source of errors during samples preparation. Then, 10 mL of acetonitrile with 1% (v/v) acetic acid was added and the tubes were shaken in vortex for 1 min. Further, 4 g MgSO4 and 1 g sodium acetate were added and the
tubes were shaken immediately (1 min) in vortex. After, the tubes were centrifuged at 2,420 × g for 20 min. Then,
2 mL of the supernatant were transferred to a 15 mL PP centrifuge tube containing 300 mg of MgSO4 and 400 mg
of Florisil®. The mixture was hand shaken for 1 min and
centrifuged at 2,420 × g for 20 min. The concentration
step was conducted using 1 mL of the filtered supernatant (0.2 µm) evaporating until 200 µL. After, 10 µL of internal standard solution (caffeine, 10 mg L−1) were added before
analysis by GC-MS.
Method validation
The proposed method was validated based on the parameters linearity, matrix effect, method limit of detection (LODm) and quantification (LOQm), and instrumental limit of detection (LODi) and quantification (LODi), accuracy (in terms of recovery) and precision (in terms of repeatability and intermediate precision, in accordance with the international regulation SANCO for pesticide residue analysis by chromatographic analysis).30
The linearity was evaluated through the coefficient of determination (r2) of the analytical curve in the range of
0.02 to 1.0 mg kg−1. Matrix effect was calculated comparing
the slope of curves prepared in acetonitrile and in the matrix blank extract.31 Accuracy was evaluated through
recovery assays at three different concentration levels (0.04, 0.30 and 1.0 mg kg−1). Precision was evaluated regarding
repeatability and intermediate precision by the relative standard deviation (RSD) of the recovery results. Three replicates of each concentration level were extracted and injected once in the GC-MS system. Instrumental LOD and LOQ were estimated using the signal-to-noise (S/N) ratio and the LOD was defined as the lowest concentration at which the analytical signal presented a S/N ratio of 3:1. The method LOQ was established as the lowest spiked level concentration, which produced a S/N ratio ≥ 10:1 with acceptable recovery (70-120%) and precision (RSD ≤ 20%) according to SANCO.30
Results and Discussion
Chromatography determination
The GC oven temperature program was optimized to separate all of the tested compounds with good peak shape, minimum matrix interferences, and increased sensitivity (S/N). For the optimization of the MS conditions, pesticide standards solutions at a concentration of 1000 µg L−1 were
injected individually and mass spectra were acquired in the range between 100 and 500 m/z. This evaluation aimed to identify the retention time and fragmentation of each analyte. Based on the acquired information, a mixture solution at 500 µg L−1 containing all the compounds was analyzed by
GC-MS in the selected ion monitoring (SIM) mode. In this study, m/z values greater than 100 were chosen to avoid low molecular weight interferences from the matrix, except for procymidone that the most intense ion was 96 m/z (Table 1). Figure 1 presents the total ion chromatogram obtained by GC-MS (SIM) for the selected compounds. Separation of the compounds myclobutanil and buprofezin (peaks 7 and 8, respectively) was not achieved but the compounds were still quantified separately due to the ability of mass spectrometer in recognize different m/z fragments.
Extraction and clean-up optimization
Sample preparation is a critical part of multiresidue methods due to the widely different physicochemical properties, such as polarity, water solubility and volatility of pesticides.32 Grapes contain significant amounts of
naturally matrix components,33 which are also co-extracted
with the target pesticides.21 In this work, two sample
preparation strategies based on original and acetate QuEChERS methods with seven different clean-up
Table 2. Clean-up conditions used to optimize the dispersive solid phase extraction (d-SPE) procedure for 2 mL of extracts
Sorbent amount / mg
PSA C18 Florisil® GCB Alumina
50 0 0 20 0
0 200 0 20 0
50 0 0 0 0
0 200 0 0 0
50 200 0 0 0
0 0 400 0 0
0 0 0 0 200
approaches were evaluated based on recoveries of the compounds. These procedures were selected considering that they were previously used for the extraction of a wide range of pesticides from fruits and vegetables.34-36
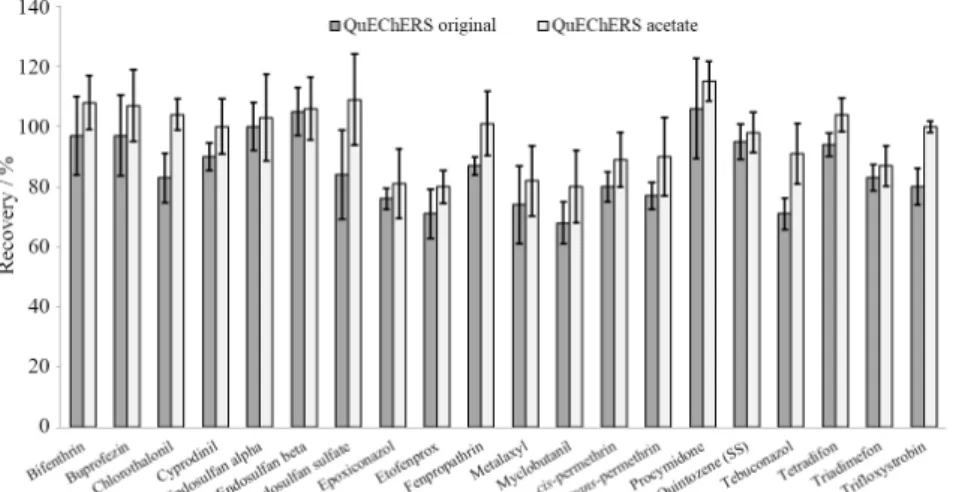
Figure 2 shows that the QuEChERS procedure using the acetate buffered version at pH 4.8 presented higher and more consistent recoveries for most compounds, including the pH dependent pesticides cyprodinil, myclobutanil and tebuconazol.5
Natural pigments does not interfere directly in the chromatographic analysis of pesticides, but can remained in the injector liner and the chromatographic column, shortening the useful life of this devices.37 In the clean-up
step, it was found that GCB provided an adequate clean-up,
resulting in almost colorless extracts. In contrast to GCB, C18 and alumina provided the most colorful extracts, as can be seen in Figure 3.
However, besides the GCB efficiency in color removal, this sorbent caused poor recoveries with both, original and acetate, extractions. This is justified by the fact that GCB has a tendency to adsorb organic compounds including pesticides, especially those with planar structure, such as chlorothalonil and cyprodinil.38 When PSA or C18 were
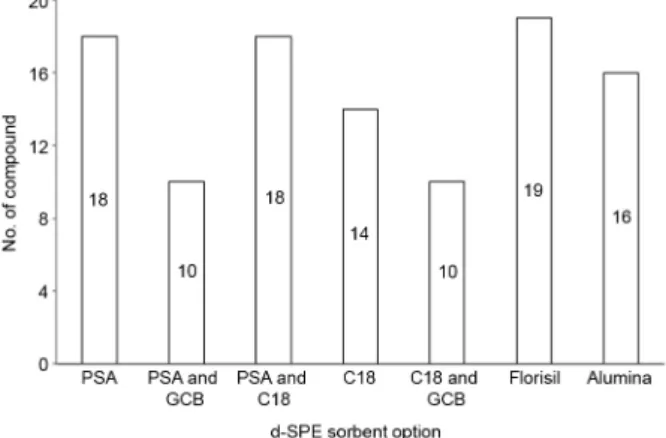
used alone, color removal was not as efficient as using GCB. However, the number of compounds with adequate recovery was higher, especially when QuEChERS acetate method was applied (Figure 4). Using a mixture of PSA and C18, the number of analytes with recovery between 70
Figure 1. Gas chromatography with mass spectrometry (GC-MS) in the selected ion monitoring (SIM) total ion chromatogram of a blank matrix matched
standard solution at 1.0 mg kg−1 containing all the selected pesticides: (1) chlorotalonil, (2) metalaxil, (3) triadimefom, (4) ciprodinil, (5) procimidone, (6)
endosulfan alpha, (7) miclobutanil, (8) buprofenzin, (9) endosulfan beta, (10) trifloxystrobin, (11) endosulfan sulfate, (12) tebuconazol, (13) epoxiconazol, (14) bifenthrin, (15) fenpropatrin, (16) tetradifon, (17) cis-permethrin, (18) trans-permethrin, (19) etofemprox, (SS) quintozene and (IS) caffeine.
Figure 2. Recoveries results obtained with the application of both QuEChERS procedures (original and acetate) to blank grape samples spiked at 0.5 mg kg−1
and 120% was lower than using only PSA, but higher than using only C18. In this case, it is possible to conclude that C18 is retaining some of the compounds, like buprofezin, endosulfan alpha, endosulfan beta, tebuconazol and trifloxystrobin, resulting in low recoveries. Miao et al.15 used only Florisil® (200 mg) as clean-up sorbent applying
d-SPE in lotus seed QuEChERS extract. In the present work, a good color removal, similar to PSA, was obtained using 400 mg of Florisil® and more compounds presented
adequate recovery (Figure 4). Based on these results and on the fact that Florisil® is an inexpensive sorbent, Florisil®
was selected and the amount of sorbent was optimized. For this purpose, 200, 300 and 400 mg of Florisil® were tested.
As expected, 400 mg presented a less color extract and the number of compounds with adequate recovery did not decrease (19 compounds). Therefore, 400 mg of Florisil®
was chosen for method validation.
Method validation
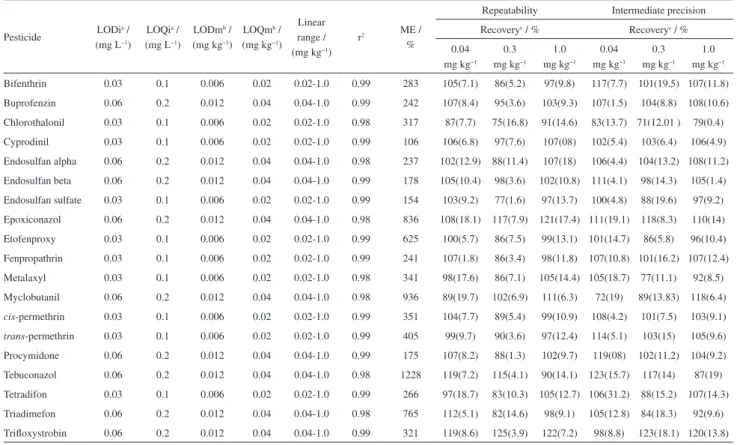
Validation parameters were evaluated and the selectivity was confirmed since no interferences were observed in the blank extract compared with a spiked grape sample. Analytical curves presented good linearity with r2 > 0.99
for all the studied compounds, except for myclobutanil and tebuconazol that presented r2 ≥ 0.98. Results for method
LOD and LOQ, linear range, linearity (r2), matrix effect,
accuracy, evaluated through recovery tests and precision in terms of repeatability and intermediate precision, are shown in Table 3. Recovery values for spiked levels ranged between 70.1 and 120.0%, except for epoxiconazol (108-121%) and trifloxystrobin (119-125%). Good precision was observed for all the substances with RSD in terms of repeatability between 3.9 and 19.7%. Intermediate precision was also evaluated and the recovery values ranged from 71 to 123% with RSD between 0.4 and 19.1%. Method LOQs values ranged between 0.02 and 0.04 mg kg−1 that are below to the
MRL established by Brazilian legislation.28 Matrix effect was
also evaluated and an increase in the chromatographic signal and sensitivity for all analytes was observed (Table 3). These results confirm the need of perform quantifications using a matrix matched calibration curve. Cunha et al.39 evaluated
the matrix effect for different pesticides in grapes, wine and must, observing that the chromatographic signal obtained by GC-MS increase for most studied pesticides when in presence of matrix. Grapes have a high sugar content27
besides others co-extractives that may remain solubilized in the organic extracts being responsible for increase gas chromatographic signal and sensitivity.40
The validation parameters achieved with the proposed method are comparable with those already published. Limits of detection and quantification (0.006-0.02 mg kg−1)
shown to be lower than those found by Alves et al.21 (3.75-9.47 mg kg−1) and You et al.17 (0.5-5.0 mg kg−1),
even using a concentration technique as solid phase extraction (SPE) and ultrasound-assisted dispersive liquid-liquid microextraction based on solidification of floating organic droplet (UA-DLLME-SFO), respectively. Banerjee et al.20 used ethyl acetate extraction followed by d-SEP clean-up with PSA and reported LOQ values from 0.01 to 0.02 mg kg−1, beingvery similar to those reported
in this work, which proves that Florisil® can be used as an
alternative sorbent to PSA.
Application to real samples
The validated method was applied for the analysis of 10 real samples collected from a local market in Frederico Westphalen, RS, Brazil. Residues of cyprodinil were found in two samples at 0.021 and 0.030 mg kg−1. This
compound is non-authorized for grape culture according to Brazilian legislations.28 However, the positive results
for this compound in grape samples are in accordance with a report published by Brazilian Health Surveillance Agency (ANVISA), were this fungicide was also found in grapes from a Brazilian monitoring program.41 Besides,
Cesnik et al.42 also found cyprodinil residues between
Figure 3. Final extract obtained after the application of dispersive solid phase extraction (d-SPE) clean-up with different sorbents. PSA: Primary and secondary amine; GCB: graphitized carbon black.
Figure 4. Number of compounds with recoveries between 70 and 120%
obtained with the application of QuEChERS acetate procedure and different clean-up options applied in blank grape samples spiked at 0.5 mg kg–1 (n = 3). PSA: Primary and secondary amine; GCB: graphitized
0.03 and 0.40 mg kg−1, which confirm the use of this
compound during grape cultivation.
Conclusions
The buffered QuEChERS extraction method using acetonitrile with acetic acid and sodium acetate proved to be effective for the extraction of pesticide residues from different chemical groups in grape samples. The conditions of clean-up were optimized, which revealed that the use of Florisil® was adequate to obtain extracts in conditions to
perform the analysis by GC-MS. The sample preparation procedure established in this work has the advantage of being simple and easy to perform, minimizing errors. In addition, it is cheap and environmentally friend due to the use of few organic solvents. Florisil® is an inexpensive
sorbent when compared to the frequently used sorbents. The combination of the sample preparation step with GC-MS provided a sensitive and selective method for the simultaneous determination of 19 pesticides in grape samples and can be applied in routine analysis. Good recovery and precision as well as low method LOQ were reached, indicating the reliability of the data obtained with
the proposed method. The results obtained with the method application indicate a potential risk to the consumer, since cyprodinil is non-authorized for use in grapes.
Acknowledgments
The authors are grateful to the Brazilian agencies CNPq, CAPES, FAPERGS and FINEP for the financial support and fellowship.
References
1. Lozano, A.; Kiedrowska, B.; Scholten, J.; Kroon, M.; Kok, A.; Fernández-Alba, A. R.; Food Chem. 2016, 192, 668.
2. Hildebrandt, A.; Guillamón, M.; Lacorte, S.; Tauler, R.; Barceló, D.; Water Res.2008, 42, 3315.
3. Li, J.; Zhang, H. F.; Shi, Y. P.; Food Chem. 2011, 127, 784. 4. Anastassiades, M.; Lehotay, S. J.; Stajbaher, D.; Schenck, F. J.;
J.AOAC Int.2003, 86, 412.
5. Lehotay, S. J.; Maštovská, K.; Lightfield, A. R.; J. AOAC Int.
2005, 88, 615.
6. Andrascikovaand, M.; Hrouzkova, S.; Anal. Methods2013, 5,
1374.
Table 3. Limit of detection (LOD) and quantification (LOQ); linear range; coefficient of determination (r2); matrix effect (ME); and recovery and precision
results for repeatability and intermediate precision assay; obtained with spiked blank samples at three different levels
Pesticide LODia / (mg L−1)
LOQia /
(mg L−1)
LODmb /
(mg kg−1)
LOQmb /
(mg kg−1)
Linear range / (mg kg−1)
r2 ME /
%
Repeatability Intermediate precision Recoveryc / % Recoveryc / %
0.04 mg kg−1
0.3 mg kg−1
1.0 mg kg−1
0.04 mg kg−1
0.3 mg kg−1
1.0 mg kg−1
Bifenthrin 0.03 0.1 0.006 0.02 0.02-1.0 0.99 283 105(7.1) 86(5.2) 97(9.8) 117(7.7) 101(19.5) 107(11.8)
Buprofenzin 0.06 0.2 0.012 0.04 0.04-1.0 0.99 242 107(8.4) 95(3.6) 103(9.3) 107(1.5) 104(8.8) 108(10.6) Chlorothalonil 0.03 0.1 0.006 0.02 0.02-1.0 0.98 317 87(7.7) 75(16.8) 91(14.6) 83(13.7) 71(12.01 ) 79(0.4)
Cyprodinil 0.03 0.1 0.006 0.02 0.02-1.0 0.99 106 106(6.8) 97(7.6) 107(08) 102(5.4) 103(6.4) 106(4.9)
Endosulfan alpha 0.06 0.2 0.012 0.04 0.04-1.0 0.98 237 102(12.9) 88(11.4) 107(18) 106(4.4) 104(13.2) 108(11.2) Endosulfan beta 0.06 0.2 0.012 0.04 0.04-1.0 0.99 178 105(10.4) 98(3.6) 102(10.8) 111(4.1) 98(14.3) 105(1.4) Endosulfan sulfate 0.03 0.1 0.006 0.02 0.02-1.0 0.99 154 103(9.2) 77(1.6) 97(13.7) 100(4.8) 88(19.6) 97(9.2) Epoxiconazol 0.06 0.2 0.012 0.04 0.04-1.0 0.98 836 108(18.1) 117(7.9) 121(17.4) 111(19.1) 118(8.3) 110(14)
Etofenproxy 0.03 0.1 0.006 0.02 0.02-1.0 0.99 625 100(5.7) 86(7.5) 99(13.1) 101(14.7) 86(5.8) 96(10.4)
Fenpropathrin 0.03 0.1 0.006 0.02 0.02-1.0 0.99 241 107(1.8) 86(3.4) 98(11.8) 107(10.8) 101(16.2) 107(12.4)
Metalaxyl 0.03 0.1 0.006 0.02 0.02-1.0 0.98 341 98(17.6) 86(7.1) 105(14.4) 105(18.7) 77(11.1) 92(8.5)
Myclobutanil 0.06 0.2 0.012 0.04 0.04-1.0 0.98 936 89(19.7) 102(6.9) 111(6.3) 72(19) 89(13.83) 118(6.4)
cis-permethrin 0.03 0.1 0.006 0.02 0.02-1.0 0.99 351 104(7.7) 89(5.4) 99(10.9) 108(4.2) 101(7.5) 103(9.1) trans-permethrin 0.03 0.1 0.006 0.02 0.02-1.0 0.99 405 99(9.7) 90(3.6) 97(12.4) 114(5.1) 103(15) 105(9.6)
Procymidone 0.06 0.2 0.012 0.04 0.04-1.0 0.99 175 107(8.2) 88(1.3) 102(9.7) 119(08) 102(11.2) 104(9.2)
Tebuconazol 0.06 0.2 0.012 0.04 0.04-1.0 0.98 1228 119(7.2) 115(4.1) 90(14.1) 123(15.7) 117(14) 87(19)
Tetradifon 0.03 0.1 0.006 0.02 0.02-1.0 0.99 266 97(18.7) 83(10.3) 105(12.7) 106(31.2) 88(15.2) 107(14.3)
Triadimefon 0.06 0.2 0.012 0.04 0.04-1.0 0.98 765 112(5.1) 82(14.6) 98(9.1) 105(12.8) 84(18.3) 92(9.6)
Trifloxystrobin 0.06 0.2 0.012 0.04 0.04-1.0 0.99 321 119(8.6) 125(3.9) 122(7.2) 98(8.8) 123(18.1) 120(13.8)
aLODi: instrumental limit of detection and LOQi: quantification;; bLODm: method limit of detection and LOQm: quantification;cvalues in brackets are relative standard deviation
7. Sahoo, S. K. R.; Battu, S.; Singh, B.; Am. J. Anal. Chem.2011,
2, 26.
8. Paz, M.; Correia-Sá, L.; Becker, H.; Longhinotti, E.; Domingues, V. F.; Delerue-Matos, C.; Food Control2015, 54, 374.
9. Cerqueira, M. B. R.; Caldas, S. S.; Primel, E. G.; J. Chromatogr. A
2014, 1336, 10.
10. Sobahnzadeh, E.; Bakar, N. K. A.; Abas, M. R. B.; Nemati, K.;
Environ. Monit. Assess.2012, 184, 5821.
11. Arias, J. L. O.; Rombaldi, C.; Caldas, S. S.; Primel, E. G.; J. Chromatogr. A2014, 1360, 66.
12. Koesukwiwat. U.; Sanguankaew, K.; Leepipatpiboon, N.; Anal. Chim. Acta2008, 626, 10.
13. Choi, S.; Kim, S.; Shin J. Y.; Kim, M.; Kim, J. H.; Food Chem.
2015, 173, 1236.
14. Capriotti, A. L.; Cavaliere, C.; Laganà, A.; Piovesana, S.; Samperi, R.; TrAC, Trends Anal. Chem.2013, 43, 53.
15. Miao, Q.; Kong, W.; Yang, S.; Yang, M.; Chemosphere2013,
91, 955.
16. Melo, L. F. C.; Collins, C. H.; Jardim, I. C. S. F.; J. Chromatogr. A
2004, 1032, 51.
17. You, X.; Jiang, W.; Liu, F.; Liu, C.; Food Anal. Methods2013,
6, 1515.
18. Savant, R. H.; Banerjee, K.; Utture, S. C.; Patil, S. H.; Dasgupta. S.; Ghaste, M. S.; Adsule, P. G.; J. Agric. Food Chem.2010,
58, 1447.
19. González-Rodríguez, R. M.; Cancho-Grande, B.; Simal-Gándara, J.; J. Chromatogr. A2009, 1216, 6033.
20. Banerjee, K.; Mujawar, S.; Utture, S. C.; Dasgupta S.; Adsule P. G.; Food Chem.2013, 138, 600.
21. Alves, A. A. R.; Rodrigues, A. S.; Barros, E. B. P.; Uekane, T. M.; Bizzo, H. R.; Rezende, C. M.; Food Anal. Methods2014,
7, 1834.
22. Hanot, V.; Joly, L.; Bonnechère, A.; van Loco, J.; Food Anal. Methods2015, 8, 524.
23. Dehouck, P.; Grimalta, S.; Dabrio, M.; Cordeiro, F.; Fiamegos, Y.; Robouch, P.; Fernández-Alba, A. R.; Callea, B.; J. Chromatogr. A2015, 1395, 143.
24. European Commission - European Food Safety Authority;
EU Legislation on MRLs, Regulation EC 396/2005 and amendments; European Commission: 2015. Available at http://
ec.europa.eu/food/plant/pesticides/legislation/max_residue_ levels_en.htm, accessed in January 2016.
25. Stan, H.-J. In Comprehensive Analytical Chemistry. Chromatographic-Mass Spectrometric Food Analysis for Trace Determination of Pesticide Residues, Volume XLIII; Barceló, D., ed.; Elsevier: Oxford, 2005, ch. 6.
26. Nixdorf, S. L.; Hermosín-Gutiérrez, I.; Anal. Chim. Acta2010,
659, 208.
27. Rizzon, L. A.; Miele, A.; Meneguzzo, J.; Cienc. Tecnol. Aliment. (Campinas, Braz.)2000, 20, 115.
28. Agencia Nacional de Vigilância Sanitária (ANVISA); Limite Máximo de Resíduos (LMR); ANVISA: Brasília, DF, Brasil,
2008.
29. Orso, D.; Martins, M. L.; Donato, F. F.; Rizzetti, T. M.; Kemmerich, M.; Adaime, M. B.; Zanella, R.; J. Braz. Chem. Soc.2014, 25, 1355.
30. European Commission – Health & Consumer Protection Directorate-General; Guidance Document on Analytical Quality Control and Validation Procedures for Pesticide Residues Analysis in Food and Feed SANCO/12571. European
Commission: 2013.
31. Ferrer, C.; Lozano, A.; Aguera, A.; Giron, A. J.; Fernandez-Alba, A. R.; J. Chromatogr. A2011, 1218, 7634.
32. Presta, M. A.; Bruyneel, B.; Zanella, R.; Kool, J.; Kraabbe, J. G.; Lingeman, H.; Chromatographia2009, 69, 167.
33. Walorczyk, S.; Drozdzynski, D.; Gnusowski, B.; Talanta2011,
85, 1856.
34. Carneiro, R. P.; Oliveira, F. A. S.; Madureira, F. D.; Silva, G.; Souza, W. R.; Lopes, R. P.; Food Control2013, 33, 413. 35. Golge, O.; Kabak, B.; J. Food Compos. Anal. 2015, 41, 86.
36. Rizzetti, T. M.; Kemmerich, M.; Martins, M. L.; Prestes, O. D.; Adaime, M. B.; Zanella, R.; Food Chem. 2016, 196, 25.
37. Sousa, F. A.; Costa, A. I. L. G.; Queiroz, M. E. L. R.; Teófilo, R. F.; Pinho, G. P.; Neves, A. A.; Chromatographia2013, 76,
67.
38. Cabrera, L. C.; Martins, M. L.; Primel, E. G.; Prestes, O. D.; Adaime, M. B.; Zanella, R.; Scientia Chromatographica2012,
4, 227.
39. Cunha, S. C.; Fernandes, J. O.; Alves, A.; Oliveira, M. B. P. P.;
J. Chromatogr. A2009, 1216, 119.
40. Sousa, F. A.; Costa, A. I. L. G.; Queiroz, M. E. L. R.; Teófilo, R. F.; Neves, A. A.; Pinho, G. P.; Food Chem. 2012, 135, 179.
41. Agencia Nacional de Vigilância Sanitária (ANVISA); Programa de Análise de Resíduos de Agrotóxicos em Alimentos(PARA): Relatório de Atividades de 2009; ANVISA: Brasília, DF, Brasil, 2009.
42. Česnik, H. B.; Gregorčič, A.; Čuš, F.; Food Addit. Contam.
2008, 25, 438.
Submitted: October 27, 2015 Published online: February 1, 2016