Artigo
*e-mail: [email protected]
ENZYME KINETIC MODELLING AND ANALYTICAL SOLUTION OF NONLINEAR RATE EQUATION IN THE TRANSFORMATION OF D-METHIONINE INTO L-METHIONINE IN BATCH REACTOR USING THE NEW HOMOTOPY PERTURBATION METHOD
Pavithra Sivasamy, Jansi Rani Palaniyandi Ganapathy, Iswarya Thinakaran and Rajendran Lakshmanan*
Department of Mathematics, Sethu Institute of Technology, Pulloor, Kariapatti – 626115, Virudunagar District – Tamilnadu, India
Recebido em 18/04/2016; aceito em 27/06/2016; publicado na web em 26/08/2016
A mathematical model of biotransformation of D-methionine into L-methionine in the cascade of the enzymes such as, D-amino acid oxidase (D-AAO), L-phenylalanine dehydrogenase (L-PheDH) and formate dehydrogenase (FDH) is discussed. The model is based on a system of coupled nonlinear reaction equations under non steady-state conditions for biochemical reactions occurring in the batch reactor that describes the substrate and product concentration within the catalyst. Simple analytical expressions for the concentration of substrate and product have been derived for all values of reaction parameters using the new homotopy perturbation method (NHPM). Enzyme reaction rate in terms of concentration and kinetic parameters are also reported. The analytical results are also compared with experimental and numerical ones and a good agreement is obtained. The graphical procedure for estimating the kinetic parameters is also reported.
Keywords: mathematical model; non-linear equations; enzyme membrane reactor; L-phenylalnine dehydrogenase; D-aminoacidoxidase; formate dehydrogenase.
INTRODUCTION
The development of cascade conversions (i.e. enzyme membrane catalytic reactions without intermediate recovery steps as taking place in living cells) is considered as one of the important future directions for carrying out sustainable organic syntheses with inherently safer designs.1,2 Hence, the enzyme is very important for the industrial
application in the purification and determination of certain amino acids. Bae et al., developed a multi-enzyme system composed of glutamate race mase, thermo stable D-amino acid amino transferase, glutamate dehydrogenase andformate dehydrogenase for the pro-duction of aromatic D-amino acids, D-phenylalanine and D-tyrosine, from the corresponding α-keto acids, phenylpyruvate and hydroxyl phenylpyruvate, respectively.3
Hummel et al. discussed the biocatiytic membrane reactors using laboratory scale in enzyme systems. Mathematical models for separate reactions steps, as well as for the complete system are developed and validated in the batch reactor experiments.4 Enzymes
are large complex protein molecules, which proceed as a catalyst to speed up chemical reactions in living organisms. In biochemistry, Michaelis-Menten kinetics is one of the simplest and important mo-dels to enzyme kinetics. In this model the rate of enzymatic reactions is a nonlinear function of concentration of a substrate. Also these reactions are essential in biochemistry because most of cell processes need enzymes to find a significant rate.5,6
The mathematical model of mono-enzymatic biosensor involving Michaelis-Menten kinetics is presented.7 The theoretical model for
amperometric enzymes reactions for steady state condition is dis-cussed and the various analytical methods for solving the non-linear reaction diffusion equation in enzyme biosensors has been reviewed recently.8 The approximate expression of steady state current for
amperometric polymer molecular electrodes for the first-order and zero-order kinetics using Danckwert’s expression is derived.9 The
steady state concentration and current occurring at microdisk and the microcylinder enzyme electrodes for amperometric biosensor using
homotopy perturbation method is obtained.10 All the above models
have two enzyme systems.
Mathematical modellings of two enzyme systems are quite common.11,12 But it is not easy in the case of three or more enzyme
systems. Findrik et al. developed a kinetic model of amino acid oxi-dation catalyzed by a new D-amino acid oxidase from Arthrobacter protophormiae. In developing the enzyme-catalyzed reaction for large-scale production, mathematical modeling of the reaction of kinetics plays an important role. Therefore, the subject of this study is focused on the kinetics of the oxidative deamination, a very complex reaction system, which is catalyzed by D-AAO from Arthrobacter protophormiae using its natural substrate D-methionine and the aromatic amino acid 3,4-dihydroxyphenyl-D-alanine (D-DOPA).13-15
Findrik et. al. have developed a mathematical model for biotrans-formation of D-methionine into L-methionine in the cascade of four enzymes systems.1 This model is formulated as a set of non-linear
differential equations describing the mass balance of the concentration of D-methionine, 2-oxo-4-methylthiobutyric acid, L-methionine, ammonium, nicotinamide adenine dinucleotide coenzyme and ni-cotinamide adenine dinucleotide hydrogen. It is observed that even though the results are compared with experimental results, they are only be obtained at discrete points depending on the step size provi-ded. This creates a shortcoming since four cascade enzyme models are represented as a dynamical system using coupled PDE.
However, to the best of our knowledge, till date there is no general analytical result corresponding to the non-steady state concentration for four enzyme system has been reported. The purpose of this com-munication is to derive the analytical expression of concentration of four enzyme systems based on new homotopy perturbation method. This is an effective tool for solve the nonlinear problems in chemi-cal sciences.16 These analytical results are helpful to understand the
NOMENCLATURE
Symbol Meaning
r1 Enzyme reaction rate of D-AAO catalyzed D-methionine
oxidation (mmol dm-3 min-1 mg-1)
r2 Enzyme reaction rate of L-PheDH catalyzed
2-oxo-4-methylthiobutyric acid reductive amination (mmol dm-3
min-1 mg-1)
r3 Enzyme reaction rate of L-PheDH catalyzed L-methionine
oxidation (mmol dm-3 min-1 mg-1)
r4 Enzyme reaction rate of FDH catalyzed NAD+ reduction
(mmol dm-3 min-1 mg-1)
Vm1 Maximum enzyme reaction rate (mmol dm-3 min-1 mg-1)
Vm2 Maximum enzyme reaction rate (mmol dm
-3 min-1 mg-1)
Vm3 Maximum enzyme reaction rate(mmol dm-3 min-1 mg-1)
Vm4 Maximum enzyme reaction rate (mmol dm
-3 min-1 mg-1)
cD–met Concentration of D-methionine (mmol dm-3)
c2–oxo Concentration of 2-oxo-4-methylthiobutyric acid (mmol
dm-3)
cL–met Concentration of L-methionine (mmol dm
-3)
cNH4
+ Concentration of ammonium (mmol dm-3)
cNAD+ Concentration of nicotinamide adenine dinucleotide
coenzyme (mmol dm-3)
cNADH Concentration of nicotinamide adenine dinucleotide
hydrogen (mmol dm-3)
cF Concentration of formate (mmol dm -3)
KmD–met Michaelis-Menten constant of D-methionine (mmol dm-3)
Ki
2–oxo Product inhibition constant of 2-oxo-4-methylthiobutyric
acid (mmol dm-3)
Ki
NADH Product inhibition constant of Nicotinamide adenine
dinucleotide hydrogen (mmol dm-3)
Km
2–oxo Michaelis-Menten constant of 2-oxo-4-methylthiobutyric
acid (mmol dm-3)
Km
NADH Michaelis-Menten constant of Nicotinamide adenine
dinucleotide hydrogen (mmol dm-3)
Km
NH4+ Michaelis-Menten constant of Ammonium (mmol dm-3)
KmL–met Michaelis-Menten constant of L-methionine (mmol dm-3)
Km
NAD+ Michaelis-Menten constant of Nicotinamide adenine
dinucleotide coenzyme (mmol dm-3)
Km
F Michaelis-Menten constant of Formate (mmol dm-3)
a1 to a5 Enzyme reaction rate (mmol dm-3 min-1)
K1 to K10 Michaelis-Menten constant (min -1)
MATHEMATICAL FORMULATION OF THE PROBLEM
The reaction scheme of four enzyme systems D-AAO, L-PheDH, FDH and coupled system of D-methionine into L-methionine are re-presented in Figure 1. The mass balance equations with corresponding
boundary conditions and analytical expressions for the concentrations are shown in the following sections.
D-AAO Kinetics
Mass balances equations for D-methionine and 2-oxo-4-me-thylthibutyric acid, in the batch reactor with the Michaelis-Menten kinetics are formulated as:1
(1)
(2)
The enzyme reaction rate of D-AAO catalyzed by D-methionine oxidation (r1) is
(3)
The initial conditions for above equations (1) and (2) are given below:
(4) where cD–met, c2–oxo are the concentration of D-methionine and
2-oxo-4-methylthibutyric acid (competitive product). Vm1 is the
maximal enzyme reaction rate, Km
D–met is the Michaelis-Menten
constant of D-methionine and Ki2–oxo is the product inhibition
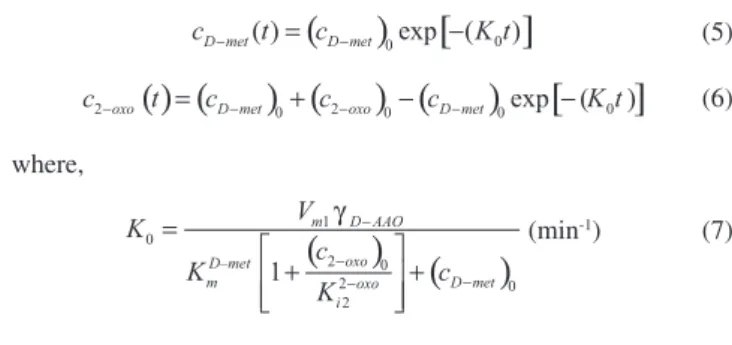
constant of 2-oxo-4-methylthiobutyric acid. Solving the above nonlinear equations (1)-(2) using new homotopy perturbation method (Appendix A), we can obtain the analytical expressions of concentration of D-methionine and 2-oxo- 4-methylthibutyric acid as follows:
(5) (6) where,
(min-1) (7)
Substituting c2–oxo from the Equation 6 in the Equation 1, we can
write the rate Equation 8a as
(8a)
Similarly the rate equation r1 in terms of concentration c2–oxo can
be obtained as follows:
(8b)
Equation 8a represents the new simple expression of the enzyme reaction rate of D-methionine in terms of cD–met, whereas the Equation
8b represents enzyme reaction rate of 2-oxo-4-methylthibutyric acid in terms of c2–oxo.
L–PheDH Kinetics
In this case, the rate equations of concentration of L-methionine, 2-oxo-4-methylthiobutyric acid, ammonium, nicotinamide adenine dinucleotide and nicotinamide adenine dinucleotide hydrogen are given as follows:1
(9)
(10)
(11)
(12)
(13)
The enzyme reaction rate of reductive amination of 2-oxo-4--methylthiobutyric acid (r2 in Equation 14) is described by three
substrate Michaelis-Menten kinetics. The enzyme reaction rate of the reverse reaction, L-methionine oxidation (r3 in Equation 15) is
described by double-substrate Michaelis-Menten equation with the inclusion of the competitive NADH inhibition.
(14)
(15)
The initial conditions for above equations are given below:
(16)
whereVm2 and Vm3 are maximum enzyme reaction rate, , ,
, , are the Michaelis-Menten constant of 2-oxo-4--methylthiobutyric acid, Nicotinamide adenine dinucleotide hydro-gen, Ammonium, Nicotinamide adenine dinucleotide respectively.
is the product inhibition constant of nicotinamide adenine dinucleotide hydrogen. Solving the above non-linear equations 9-13 using new HPM (Appendix A), the analytical expression of concen-tration of L-methionine, 2-oxo-4-methylthiobutyric acid, ammonium, nicotinamide adenine dinucleotide (NAD+) and nicotinamide adenine
dinucleotide hydrogen (NADH) are obtained as follows:
(17)
(18)
(19)
(20)
(21)
where the parameters a1, a2 and K1 to K5 are given in the Appendix B. FDH Kinetics
In this case, the mass balance equation for formate, nicotinamide adenine dinucleotide coenzyme and nicotinamide adenine dinucle-otide hydrogen oxidase enzyme membrane reactor are represented as follows: 1
(22)
(23)
(24)
The enzyme reaction rate of NAD+ reduction by FDH kinetics
(Eqn (25)) is
(25)
The Eqns (22-24) are solved for the following initial conditions: (26) where Vm4 is a maximum enzyme reaction rate and , Km
F are the
Michaelis-Menten constant of Nicotinamide adenine dinucleotide and Formate. is the product inhibition constant of Nicotinamide adenine dinucleotide hydrogen. Solving the above mentioned non--linear equations (22) - (24) using new Homotopy perturbation method (Appendix A), we get the analytical expression of concentrations of formate, nicotinamide adenine dinucleotide (NAD+) and
nicotina-mide adenine dinucleotide hydrogen (NADH) oxidase in enzyme membrane reactor as follows:
(27)
(28)
(29)
where the parameters a3, a4 and K6 to K8 are given in the Appendix B Coupled kinetics
In this case, the rate equation of 2-oxo-4-methylthiobutyric acid and ammonium are given as follows:1
(31)
where the reaction rate is
(32)
The reaction rate r2 and r3 are given in the Equations 14 and
(15). The initial conditions for the above equations are given below: (33) Solving the non-linear Equations 30 and (31) using new Homotopy perturbation method, we can obtain the approximate analytical expression for the concentration of 2-oxo-4-methylthio-butyric acid and ammonium as follows:
(34)
(35)
where the parameters a5 and K9 to K10 are given in the Appendix B. NUMERICAL SIMULATION
The non-linear differential equations 1, 2, 9-13, 22-24, 30 and 31 are also solved using numerical methods. The function pdex4 in Scilab software which is the function of solving the initial value problems for ordinary differential is used to solve this equation. Our theoretical results for the concentration of cD–met using Equation 5 and c2–oxo using
Equation 6 for the D-AAO kinetics are compared with simulation results (Scilab program 4.1) in Tables 1-2. The Scilab program is also given in Appendix C. We run scilab 4.1 on apple imac core i5. The maximum error between our analytical results and simulation results 0.5%. Similarly our analytical results for the concentration of ammonium, nicotinamide adenine dinucleotide coenzyme and nicotinamide adenine dinucleotide hydrogen are compared with
numerical results and available experimental results1 in Figures 2-7.
Satisfactory agreement is found for all values of time t.
RESULTS AND DISCUSSION
D-AAO Kinetics
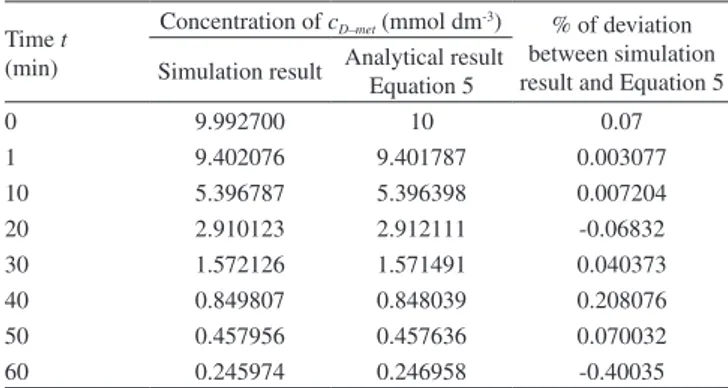
Equations 5 and 6 are the new and simple approximate analytical expression of the concentrations of D-methionine and 2-oxo-4--methylthiobutyric acid. The rate of reaction can be determined from Table 1. Comparison of analytical result with simulation result for the con-centration of cD–met using Equation 5
Time t
(min)
Concentration of cD–met (mmol dm-3) % of deviation between simulation result and Equation 5 Simulation result Analytical result
Equation 5
0 9.992700 10 0.07
1 9.402076 9.401787 0.003077
10 5.396787 5.396398 0.007204 20 2.910123 2.912111 -0.06832 30 1.572126 1.571491 0.040373 40 0.849807 0.848039 0.208076 50 0.457956 0.457636 0.070032 60 0.245974 0.246958 -0.40035
Table 2. Comparison of analytical result with Simulation result for the con-centration of c2–oxo using Equation 6
Time t
(min)
Concentration of c2–oxo (mmol dm-3) % of deviation between simulation result and Equation 6 Simulation result Analytical result
Equation 6
0 0.100200 0.100000 0.20
1 0.697964 0.698213 -0.03572 10 4.703253 4.703602 -0.00742 20 7.189917 7.187889 0.02821 30 8.527914 8.528509 -0.00697 40 9.250233 9.251961 -0.01868 50 9.642084 9.642364 -0.00291 60 9.854066 9.853042 0.010399
Table 3. Experimental Values of Parameter Use in This Work and Findrik et al.1
Parameter Value Parameter Value
D-AAO kinetics FDH kinetics
Vm1 37.93 (U mg-1) or 63.2167 (mmol dm–3 mg–1 min–1) Vm4 0.63 (U mg-1) or 1.05 (mmol dm–3 mg–1 min–1)
0.23 (mmol dm–3) 12.80 (mmol dm–3)
1.26 (mmol dm–3) 0.039 (mmol dm–3)
0.022 (mmol dm–3) 0.289 (mmol dm–3)
0.01 (mg) 0.85 (mg)
L-pheDH kinetics
Vm2 59.211 (U mg-1) or 98.65 (mmol dm–3 mg–1 min–1) Vm3 0.42 (U mg-1) or 0.7 (mmol dm–3 mg–1 min–1)
1.06 (mmol dm–3) 4.02 (mmol dm–3)
0.05 (mmol dm–3) 0.44 (mmol dm–3)
76.99 (mmol dm–3) 0.0027 (mmol dm–3)
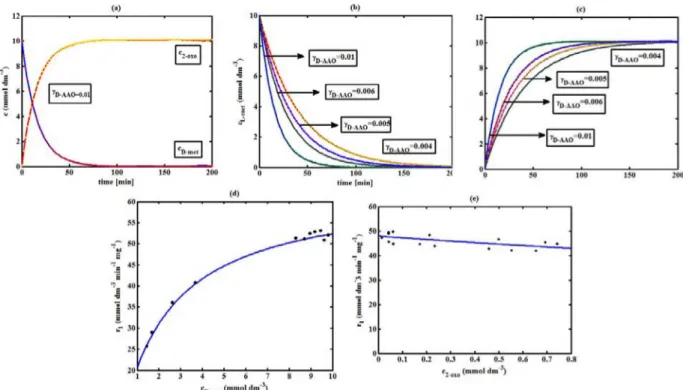
the graphs for a specified time, by measuring the gradient of the graphs using a tangent. Figure 2(a) signifies the comparison of the concentration of 2-oxo-4-methylthiobutyric acid and D-methionine versus time t. From Figure 2(b), it is observed that when concen-tration D-met increases when the parameter γD–AAO decreases. From
Figure 2(c), it is inferred that when concentration 2-oxoincreases when the parameter γD–AAO increases. Our analytical results for the enzyme
reaction rate (r1) versus concentration of D-methionine (Equation 8a)
and concentration of 2-oxo-4-methylthiobutyric acid (Equation 8b) are compared with experimental results for some fixed values of pa-rameters in Figure 2(d) and 2(e) and satisfactory agreement is noted.
L-PheDH Kinetics
Equations 17-21 represent the analytical expressions of the concentrations of L-methionine, 2-oxo-4-methylthiobutyric acid, Ammonium, Nicotinamide adenine dinucleotide and Nicotinamide adenine dinucleotide hydrogen. Figures 3(a)-3(g) signifies the concen-trations of L-methionine, 2-oxo-4-methylthiobutyric acid, Ammonium, Nicotinamide adenine dinucleotide and Nicotinamide adenine dinu-cleotide hydrogen for various values of parameter γL–PheDH and for all
time it remains domain. Figure 3(a), signifies that the comparison of L-methionine, 2-oxo-4-methylthiobutyric acid versus time t. Figure 3(b), represents the comparison of the concentration of ammonium, Nicotinamide adenine dinucleotide and Nicotinamide adenine di-nucleotide hydrogen versus time t. From Figures 3(c) and 3(f), it is noted that the concentrations of L-methionine and Nicotinamide adenine dinucleotide decreases when the parameter γL–PheDH increases.
From Figures 3 (d), (e) and 3(g), it is obvious that the concentration of 2-oxo-4-methylthiobutyric acid, Ammonium and Nicotinamide adenine dinucleotide hydrogen increases when the parameter γL–PheDH
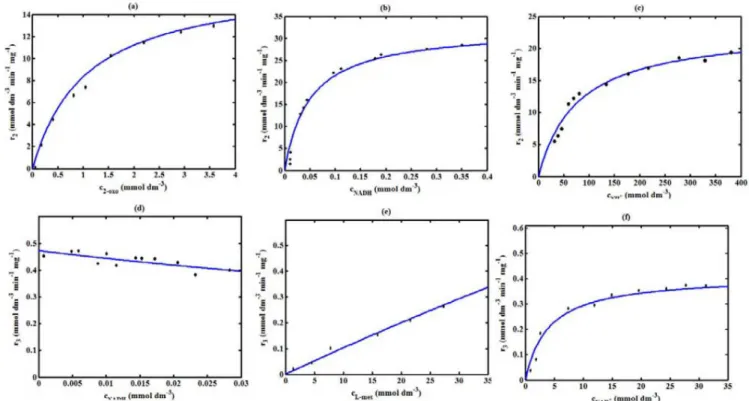
increases. Our analytical results for enzyme reaction rate (r2) versus
the concentrations of 2-oxo-4-methylthiobutyric acid, Nicotinamide adenine dinucleotide hydrogen, Ammonium are compared with experimental results for some fixed values of parameters in Figures
4(a)-4(c). The enzyme reaction rate (r3) versus the concentrations of
L-methionine, Nicotinamide adenine dinucleotide and Nicotinamide adenine dinucleotide are compared with the experimental results for some fixed values of other parameters in Figures 4(d)-4(f).
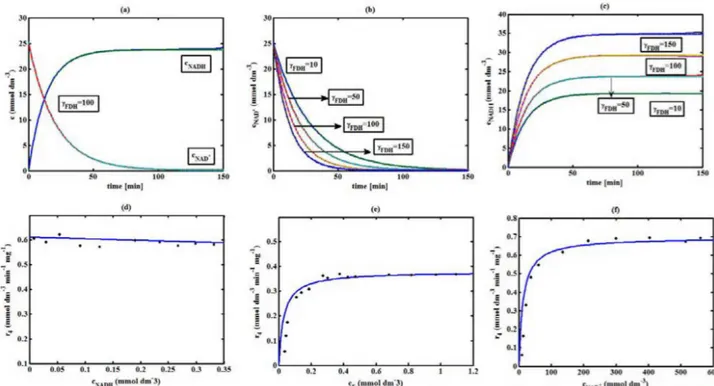
FDH Kinetics
Equations 27-29 identify the analytical expressions of the concentrations of formate, Nicotinamide adenine dinucleotide and Nicotinamide adenine dinucleotide hydrogen. Figure 5(a) represents the comparison of the concentration of Nicotinamide adenine dinucle-otide and Nicotinamide adenine dinucledinucle-otide hydrogen versus time t. From Figure 5(b) it is clear that when the parameter γFDH increases the
concentration of Nicotinamide adenine dinucleotide decreases. From Figure 5(c) it is evident that when the concentration γFDH increases the
concentration of Nicotinamide adenine dinucleotide hydrogen also increases. In our analytical results, enzyme reaction rate (r4) versus
the concentration of formate cF, Nicotinamide adenine dinucleotide
and Nicotinamide adenine dinucleotide coenzyme are compared with the experimental results for some fixed values of other parameters in Figures 5(d)-5(f).
Coupled kinetics
Equations 34 and 35 characterizes the analytical expressions of the concentration of 2-oxo-4-methylthiobutyric acid and Ammonium. From Figure 6(a) and 6(b) show the concentration of 2-oxo-4-methyl-thiobutyric acid and Ammonium versus time t for some fixed values of other parameters. Concentrations of 2-oxo-4-methylthiobutyric acid and Ammonium decreases when the parameter γD–AAO increases.
Influence of the parameter on the concentration is also reported.
Estimation of Kinetic Parameters
To check the validity of the model against the experimental
Figure 2. D-AAO kinetics(a) Comparison between the theoretical results (Equations 5 and (6)) and simulation results. (b) Comparisonbetweentheory (Equa-tion 5) and simula(Equa-tionsresults. (c) Comparison between theory (Equation 6) and simulation results. (d)-(e) Comparison of theoretical results with experimental results1 for the reaction rate r
data, the model equation, which contains three kinetic parameters, is transformed so that a linear plot of the data can be made. The plot has yielded reasonable linearity, and the parameter values can be estimated from the plot. The three parameters in Equation 1 can be evaluated by means of non-linear least-squares fit. Equation 3 can be rewritten as
(36)
As shown in Figure 7, Plot of 1/r1 versus 1/(cD–met) gives the
slope and y-intercept . If
we know the maximum enzyme reaction rate Vm1, we can obtain the
other parameter Michaelis-Menten constant of D-methionine KmD–met
and product inhibition constant of 2-oxo-4-methylthiobutyric acid Ki2–oxo. As Ki tends to infinity the equation reduces to the form of
Michaelis-Menten kinetics10 for which the Lineweaver–Burk plot17
is commonly used to determine the parameter values.
Figure 3. L-pHeDH kinetics(a) Comparison between the theoretical results (Equations 17 and (18)) and simulation results. (b) Comparison between the theoretical results (Equations 19, (20) and (21)) and simulation results. Concentration of (c) L-methionine (Equation 17), (d) 2-oxo-4-methylthiobutyric acid (Equation 18), (e)Ammonium (Equation 19), (f) Nicotinamide adenine dinucleotide (Equation 20), (g) Nicotinamide adenine dinucleotide hydrogen (Equation 21) versus time t. The numerical value of the kinetic parameters used for the above figure is given in Table 1. Key to the graph: (___) represents the (Equations 17-(21)) and (....) represents the numerical results
Figure 4. Comparison of theoretical results with the experimental results1 for the reaction rate r
2 and r3.The numerical value of the kinetic parameters used for
Figure 5. FDH kinetics (a)Comparison between the theoretical results (Equations(28) and (29)) and simulation results. (b) Concentration of Nicotinamide adenine dinucleotide (Equation 28), (c) Nicotinamide adenine dinucleotide hydrogen (Equation 29) versus time t. (d-f)Comparison of theoretical results with the experimental results 1 for the reaction rate r
4.The numerical value of the kinetic parameters used for the above figure is given in Table 3
Figure 6. (a) Variation of the concentration of 2-oxo-4-methylthiobutyric acid (c2–oxo) with time t at different γD–AAO using Equation 34. (b) Variation of the
con-centration of ammonium (cNH4
+) with time t at different γD–AAO using Equation 35
Also the rate equation (1) can be written as
(37) where the constant
(38)
If we know the experimental data i.e (ti, cD–met), we can obtain the
numerical values of the constant b(1) (=0.7721) and b(2) (=1.9645) using the Matlab program (Appendix D). From the numerical values, the kinetic constant KmD–met, Ki2–2oxo, Vm1 and γD–AAO can be obtained.
Estimation of parameter from our analytical result Eqn (5 )
The Equation 5 can be rewritten as,
(39) Using the method of Least chi-square we get,
(40) The parameter K0 can be obtained from the above Equation 40.
From this parameter we can obtain the Vm1, γD–AAO, Km D–met, K
i 2–oxo by
changing the initial concentration of cD–met. Similarly the parameter
for other kinetics scheme can be obtained. The numerical value of the parameter b(1) estimated from the Equation 39 is 0.773 where as the value of the parameter estimated from the Matlab/Scilab program is 0.07721. This validate our analytical model against the experimental data.
CONCLUSIONS
A non-linear time dependent reaction equations in enzyme kine-tics have been solved analytically using new Homotopy perturbation method. In this paper we have presented approximate analytical expression of the concentration of 2-oxo-4-methylthiobutyric acid, L-methionine, Ammonium, Nicotinamide adenine dinucleotide, Nicotinamide adenine dinucleotide hydrogen and Formate. The analytical expressions are compared to the numerical simulation using Scilab software. Good agreement is noted. Theoretical evaluation of the kinetic parameter is also reported.
SUPPLEMENTARY MATERIAL
The supplementarydata associated with this article can be found at http://qumicanova.sbq.org.br in pdf format with free access.
ACKNOWLEDGEMENTS
The author very much grateful to the referees for the valuable suggestions. The authors are thankful to Mr. S. Mohamed Jaleel, The Chairman, Dr. A. Senthilkumar, The Principal, Sethu Institute of Technology, Kariapatti-626115, Tamilnadu, India for their encouragement.
REFERENCES
1. Findrik, Z.; Vasić-Rački, Ð.; Biotechnol. Bioeng. 2007, 98, 956. 2. Bruggink, A.; Schoevaart, R.; Kieboom, T.; Org. Process Res. Dev.
2003, 7, 622.
3. Bae, H. S.; Lee, S. G.; Hong, S. P.; Kwak, M. S.; Esaki. N., Soda, K.; J. Mol. Catal. B: Enzym. 1999, 6, 241.
4. Hummel, W.; Schmidt, E.; Wandrey, C.; Kula, M. R.; Appl Microbiol Biotechnol. 1986, 25, 175.
5. Michaelis, L.; Menten, M. L.; Biochem. Z. 1913, 49, 333.
6. Murray, J. D.; Mathematical Biology, Springer-Verlag: New York, 2002. 7. Kirthiga, O. M.; Rajendran, L.; J. Electroanal. Chem. 2015, 751, 119. 8. Rajendran, L.; Anitha, S.; Electrochim. Acta 2013, 102, 474. 9. Rajendran, L.; Rahamathunissa, G.; J. Math. Chem. 2008, 44, 849. 10. Eswari, A.; Rajendran, L.; J. Electroanal. Chem. 2010, 641, 35. 11. Cho, B. K.; Cho, H. J.; Park, S. H.; Yun, H.; Kim, B. G.; Biotechnol.
Bioeng. 2003, 81, 783.
12. Cho, B. K.; Seo, J. H.; Kang, T. J.; Kim, J.; Park, H. Y.; Biotechnol. Bioeng. 2006, 94, 842.
13. Findrik, Z.; Vasić-Rački, Ð.; Lütz, S.; Daubmann, T.; Andrey, C.; Bio-technol. Lett. 2005, 27, 1087.
14. Findrik, Z.; Vasić-Rački, Ð.; Geueke, B.; Kuzu, M.; Hummel, W.; Eng. Life Sci. 2005, 5, 550.
15. Findrik, Z.; Geueke, B.; Hummel, W.; Vasić-Rački, Ð.; Biochem. Eng. J. 2006, 27, 275.
16. He, H. J.; Electrochim. Acta 2013, 109, 617.