Artigo
*e-mail: [email protected]
#Alternative e-mail: [email protected]
A NEW RHODAMINE B DERIVATIVE RBMAB AS A HIGHLY SELECTIVE AND SENSITIVE CHEMOSENSOR FOR Fe3+ WITH LOW DETECTION LIMIT
Wei Shena,*, Lin Wangb, Min Chena and Hongfei Lub,#
aSchool of Sciences, Nanjing Agricultural University, 1 Tongwei Road, 210095 Nanjing, China
bSchool of Biology and Chemical Engineering, Jiangsu University of Science and Technology, 2 Mengxi Road, 212003 Zhenjiang,
China
Recebido em 11/02/2016; aceito em 22/06/2016; publicado na web em 26/08/2016
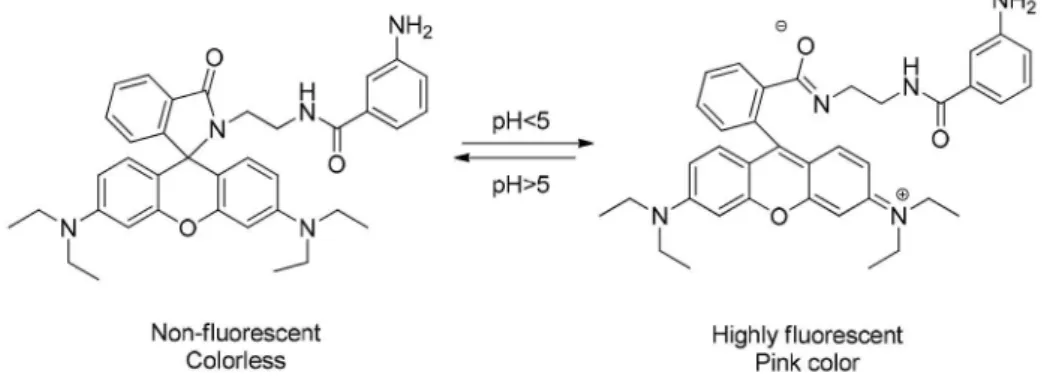
A new Rhodamine B derivative RBMAB, namely 3-amino-N-(2-(3’,6’-bis (diethylamino)-3-oxospiro[isoindoline-1,9’-xanthen]-2-yl) ethyl)benzamide, was designed, synthesized and structurally characterized to develop a chemosensor. The studies show that RBMAB exhibits high selectivity toward Fe3+ among many other metal cations in an ethanol-H
2O (3:2, v/v, PBS buffer, 1.2 mmol L-1, pH 7.2)
solution. It has a low detection limit of 0.021µm. Fluorescence microscopy experiments further demonstrate that RBMAB can be used as a fluorescent probe to detect Fe3+ in living cells.
Keywords: rhodamine B derivative; chemosensor; Fe3+; cell imaging.
INTRODUCTION
Fe3+ is transitional metal ion and it is one of the most important
trace elements in biological systems for Fe3+ provides the
oxygen--carrying capacity of heme, so, iron in small concentrations is es-sential to human health.1 But its deficiency or overload can induce
serious disorders and infectious diseases such as anemia,2
hemo-chromatosis,3 malaria,4 Parkinson,5 Alzheimer.6 Many techniques
for detecting Fe3+ have been reported, including atomic
absorp-tion spectrometry,7,8 voltammetry,9 fluorometric and colorimetric
method.10-13 Many are complicated and not suitable for quick and
online monitoring. Among these methods, fluorometric assay with specific fluorescence chemosensor is currently attracting much attention as a method to reveal the molecular functions of the ions in living systems.
Rhodamine B-based fluorescent sensors have attracted consi-derable interest for their excellent photo-physical properties, high fluorescence quantum yield and visible-wavelength excitation.14
Rhodamine B moiety also owns “off-on” ability, when specific metal ions bind to rhodamine derivatives, it will start ring open process to cause strong fluorescence emission.15 Many of rhodamine derivatives
have been designed and synthesized to display specific detection of Pb2+,Cu2+, Cd2+, Cr3+, Hg2+.16-27 Although rhodamine based sensors
for Fe3+ have been reported a lot. Quite a lot of them haven’t present
the detection limit or have comparative high detection limit which hindered for low concentration detection.28-35
In this paper, we present a new rhodamine B derivative, 3-amino-N-(2-(3’,6’-bis (diethylamino)-3-oxospiro[isoindoline-1,9’-xanthen]-2-yl)ethyl)benzamide. It exhibits high sensitivity toward Fe3+ among many other metal cations in an ethanol-H
2O
(3:2, v/v, PBS buffer, 1.2 mmol L-1, pH 7.2) solution. It has a low
detection limit of 0.021 µm. Cell studies further demonstrate that RBMAB can be a potential probe to detect Fe3+ in human liver
cells (L-02).
EXPERIMENTAL
Materials and instrumentation
All reagents and organic solvents that used were of ACS grade or higher and were used without further purification. Unless otherwise noted, all chemicals were purchased from J&K Scientific Shanghai, China) and used as received. All solvents were of analytical grade, and double-distilled water was used in all experiments. The salts that were used to prepare metal ion stock solutions were AgNO3, AlCl3,
Ba(NO3)2, CaCl2, CdCl2·2.5H2O, CoCl2·6H2O, CrCl3·6H2O, IrCl3,
CuCl, CuCl2·2H2O, FeCl2·4H2O, FeCl3·6H2O, HgCl2, KCl, LiCl·H2O,
MgCl2·6H2O, MnCl2·4H2O, NaCl, NiCl2·6H2O, PbCl2, SnCl2·H2O and
ZnCl2. Thin-layer chromatography was performed on a HAIYANG
silica gel F254 plate, and compounds were visualized under UV light (λ = 254 nm). Column chromatography was performed using HAIYANG silica gel (type: 200–300 mesh ZCX-2).
1H (500 MHz) and 13C NMR (126 MHz) spectra were recorded
on an Avance 500 spectrometer (Bruker; Billerica, MA, USA). The chemical shifts are reported in δ units (ppm) downfield relative to the chemical shift of tetramethylsilane. The abbreviations br, s, d, t and m denote broad, singlet, doublet, triplet and multiplet, respectively. Mass spectra were obtained with a Finnigan TSQ Quantum LC/MS Spectrometer. High-resolution mass spectra (HRMS) were acquired under electron ionization conditions with a double-focusing high--resolution instrument (Autospec; Micromass Inc.). The pH levels of stock solutions were measured using a PHS-25C Precision pH/ mV Meter (Aolilong, Hangzhou, China). UV–Vis and fluorescence spectra were obtained on a UV-1700 UV–VIS-NIR spectrophoto-meter (Shimadzu, Japan) and a Fluoroscopy Max-4 (Horiba, Japan), respectively, at room temperature.
Synthesis of 2-(2-aminoethyl)-3’, 6’-bis (diethylamino) spiro[isoindoline-1,9’- xanthen]-3-one (1)
CH2Cl2, 1:99; v:v) of the crude mixture afforded RBMAB (158 mg)
in 71.8% yield as a brown-yellow solid.1H NMR (500 MHz, CDCl 3) δ 8.15 (s, 1H), 7.95 (dd, J = 5.8, 2.7 Hz, 1H), 7.48 (dd, J = 5.4, 3.2 Hz, 2H), 7.36-7.15 (m, 6H), 7.11 (dd, J = 5.8, 2.6 Hz, 1H), 6.81 (d, J = 7.2 Hz, 1H), 6.48 (d, J = 8.8 Hz, 4H), 6.31 (d, J = 6.8 Hz, 2H), 3.45 (d, J = 4.8 Hz, 2H), 3.35 (h, J = 8.5 Hz, 8H), 3.18 (s, 2H), 1.19 (t, J = 7.0 Hz, 12H).13C NMR (126 MHz, CDCl
3) δ 170.26, 167.18,
153.91, 153.24, 148.83, 146.58, 135.39, 132.82, 130.33, 129.36, 128.41, 128.16, 123.89, 122.87, 117.66, 116.96, 113.99, 108.40, 104.73, 97.90, 77.29, 77.03, 76.78, 65.85, 53.42, 44.43, 41.73, 39.89, 29.68, 12.56. HRMS (M++1) found, 604.3292; calculated for
C34H41N4O5+, 604.3288.
General procedure of UV-Vis and fluorescence-spectral studies
Stock solutions (10-3 mol L-1) of the chloride or nitrate salts of
Ag+, Al3+, Ba2+, Ca2+, Cd2+, Co2+, Cr3+, Cs2+, Cu+, Cu2+, Fe2+, Fe3+,
Hg2+, K+, Li+, Mg2+, Mn2+, Na+, Ni2+, Pb2+ and Zn2+, in deionized
wa-ter were prepared. The stock solution of RBMAB (10 mol L-1) was
prepared in ethanol/PBS (3:2; v/v; 1.2 mmol L-1 , pH 7.2). Working
solutions of RBMAB were freshly prepared by diluting the highly concentrated stock solution to the desired concentration prior to the spectroscopic measurements.
All experiments were performed in an ethanol/PBS (3:2; v/v; 1.2 mmol L-1, pH 7.2) solution. In each titration experiment, a 20 µmol
L-1 solution of the probe RBMAB was placed in a quartz optical cell
with a 1-cm optical path length, and the appropriate amount of ion stock solution was added to the quartz optical cell using a micropipet-te. Spectral data were recorded 120 min after the ion addition. In the selectivity experiments, the test samples were prepared by placing an appropriate amount of the cation stock solution in 3 mL of the probe
concentrations of RBMAB for 48 h. The cell viability was evaluated by incubating with 0.5 mg mL-1
3-[4,5-dimethylthiazol-2-yl]-2,5--diphenyltetrazolium bromide (MTT) for 4 h under 5% CO2/95% air
at 37 °C. The media were replaced with 100uL of DMSO, and the absorbance was read at 570 nm. For fluorescence microscopy ima-ges, one day before imaging, the cells were seeded in 6-well plates. Immediately before the experiments, the cells were incubated with 0.1 mmol L-1 FeCl
3 in 50 mmol L-1 PBS buffer for 120 min at room
temperature, followed by incubation with 20 µmol L-1 RBMAB at
37 °C under 5% CO2 for additional 30 min. The cells were washed
with PBS three times and subsequently imaged. The fluorescence intracellular imaging was observed under an Olympus inverted fluorescence microscope with a 20× objective lens multiplied by 1.6 (excited with green light). The cells that were incubated with the solvent DMSO were taken as a control.
RESULT AND DISCUSSION
Synthesis of RBMAB
The synthesis procedure of RBMAB is illustrated in Scheme 1. Compound 1 was prepared in a 92% yield from commercially availa-ble rhodamine B and ethane-1,2- diamine.36 RBMAB was prepared in
a 71.8% yield by the reaction of 3-aminobenzoic acid with 1.5 equiv of compound 1, 1.5 equiv of DCC, 1.5 equiv of HOBt and 1.5 equiv of triethylamine in DMSO for 12 h. The structure of RBMAB was confirmed by 1H NMR, 13C NMR and HRMS (Supporting materials).
Responses of RBMAB to pH
To investigate the pH response of probe RBMAB, acid-base
titration experiments were performed in EtOH/H2O (3:2, v/v)
solu-tions. The fluorescence intensities of RBMAB at 582 nm at different pH values (1.02, 2.05, 2.94, 4.07, 5.08, 6.02, 7.05, 7.96, 9.03 and 10.06) were recorded. As shown in Figure 1, RBMAB did not emit any distinct and characteristic fluorescence (λex = 562 nm) in the pH
range of 5.0-10.0, the result indicated that the spirolactam form of RBMAB was the predominant species (Scheme 2). When the pH was adjusted to between 1.0 and 5.0, the fluorescence intensity at 582 nm was apparently enhanced due to the ring-opening process of the spirocyclic moiety of Rhodamine B (Scheme 2).19,20 These
results showed that RBMAB was insensitive to pH from 5.0 to 10.0 and may work under approximately physiological conditions with very low background fluorescence. Therefore, further UV-vis and fluorescence studies were carried out in a EtOH/H2O (3:2 v/v, PBS
buffer, 1.2 mmol L-1, pH 7.2) solution.
Response time of RBMAB
The response time of the reaction system was also a very important aspect as a chemical sensor for practical applications. So the response time of the reaction system was also investigated to evaluate the sen-sitivity of RBMAB toward Fe3+. To an optical quartz cell with a 1-cm
path length containing RBMAB (20 µmol L-1) in a EtOH/H 2O (3:2
v/v, PBS buffer, 1.2mmol L-1, pH 7.2) solution, Fe3+ (200µmol L-1, 10
equiv) was added. The change in the fluorescence intensity of RBMAB over a period of 200 min was recorded. As shown in Figure 2, the fluorescence intensity of RBMAB at 582 nm slowly increased in the first 120 min, and then hold steady, which indicates that the reaction system was stable after 120 min. Therefore, a 120-min reaction time
was selected in subsequent experiments to ensure that the metal ions had enough time to sufficiently chelate with the sensor.
UV-vis spectral response of RBMAB
To evaluate the selectivity of RBMAB for Fe3+, the sensing ability
of RBMAB toward different metal cations was studied using UV-Vis spectroscopy. As shown in Figure 3, the UV-vis spectrum of RBMAB (20 µmol L-1) in an ethanol-H
2O (3:2 v/v, PBS buffer, 1.2 mmol L-1,
pH 7.2) solution exhibits notably weak absorbance at 562 nm. The addition of 10 equiv. Fe3+ (200 µmol L-1) into the solution significantly
enhances the absorbance at 562 nm. Under the identical condition, no obvious response was observed at 562 nm after other metal ions Al3+, Ba2+, Ca2+, Cd2+, Co2+, Cr3+, Cs2+, Cu+, Cu2+, Fe2+, Fe3+, Hg2+, K+,
Li+, Mg2+, Mn2+, Na+, Ni2+, Pb2+ and Zn2+ were added, while a relative
small enhancement by addition of Ag+. The results demonstrate that
RBMAB can serve as an excellent selective chemosensor for Fe3+ in
an ethanol-H2O (3:2 v/v, PBS buffer, 1.2 mmol L
-1, pH 7.2) solution.
To determine the binding stoichiometry of the RBMAB- Fe3+
complex, a Job’s plot was generated by continuously varying the mole fraction of Fe3+ from 0 to 1 in a solution of [Fe3+] + [RBMAB] with
a total concentration of 50 µmol L-1. The Job’s plot analysis revealed
an approximate maximum at the 0.5 mole fraction, which indicates a 1:1 stoichiometry for the RBMAB-Fe3+ complex (Figure 4).
Fluorescence spectral response of RBMAB
To further understand the selectivity of RBMAB for Fe3+, the
changes in fluorescence intensity after various metal ions were Scheme2 Mechanism of the response ofRBMAB to pH changes
Figure 1. Effect of pH on the fluorescence of RBMAB (20 µmol L-1) in
ethanol--H2O solutions (3:2 v/v). The excitation and emission wavelengths were 562
nm and 582 nm, respectively
Figure 2. Fluorescence spectra of RBMAB(20 µmol L-1) with Fe3+
(200 µmol L-1, 10 eq.). The excitation and emission wavelengths were 562
added under identical conditions were also investigated. The fluo-rescence spectra of RBMAB (20µmol L-1) in an ethanol-H
2O (3:2
v/v, PBS buffer, 1.2 mmol L-1, pH 7.2) solution exhibits a notably
weak fluorescence at 582 nm (λex = 562 nm) in the absence of metal
ions, which indicates that the predominant form of RBMAB is the spirolactam form. When Fe3+ (200 µmol L-1, 10 eq.) was introduced
to the RBMAB solution, a remarkable fluorescence enhancement was observed (Figure 5), which indicates that the Fe3+ ions induce
the formation of the strongly fluorescent, ring-opened RBMAB-Fe3+
complex (Scheme 2).The fluorescence enhancement of Fe3+ to
RBMAB is as high as 180-fold. Other metal ions showed no obvious fluorescence enhancement under the same conditions. These results further demonstrate that RBMAB can function as a highly sensitive and selective fluorescent chemosensor for Fe3+ over various other
metal ions.
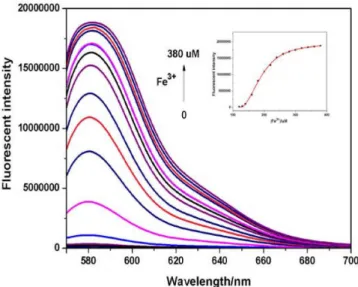
The Fe3+ titration against RBMAB in an ethanol-H
2O (3:2 v/v,
PBS buffer, 1.2 mmol L-1, pH 7.2) solution was monitored using
fluorescence spectra. As shown in Figure 6, when no Fe3+ ion was
added to the RBMAB solutions, free RBMAB (20 µmol L-1) remained
colorless and exhibited notably weak fluorescence (λex = 562 nm) at
582 nm. However, when Fe3+ (0-400 µmol L-1) was added, the
titra-tion of Fe3+ ions with RBMAB significantly increased the emission
intensity at 582 nm, which resulted in a color change from colorless to pink, which can be ascribed to the formation of the ring-opened amide form of RBMAB upon Fe3+ ion binding (Scheme 2). The
emission intensity reached its maximum value after the addition of 16 equivalents of Fe3+. A fluorescence enhancement of over 800-fold
was observed under saturation conditions. The competitive selectivity of RBMAB for Fe3+ in the presence of many other metal ions under
identical conditions was also investigated. As shown in Figure 7 no significant variation in emission of the RBMAB- Fe3+ complex was
observed compared with the results obtained with or without other metal ions. These results indicate that the detection of Fe3+ is not
interfered by other metal ions and that RBMAB can be used as a selective Fe3+ fluorescent chemosensor.
The association constant was calculated using the Benesi-Hildebrand plot: F-F0=[Fe
3+](F
max-F0)/(1/Ka+[Fe
3+]),11 based on a 1:1
stoichiometry, where F is the obtained fluorescence intensity, F0 is the
fluorescence intensity of free RBMAB at the emission wavelength, and Fmax is the saturated fluorescence intensity of the RBMAB-Fe3+
Figure 3. UV-Vis absorbance spectra of RBMAB (20 µmol L-1) in the absence
and presence of 10 equivalents of various metal ions: Ag+, Al3+, Ba2+, Ca2+,
Cd2+, Co2+, Cr3+, Cs2+, Cu+, Cu2+, Fe2+, Fe3+, Hg2+, K+, Li+, Mg2+, Mn2+, Na+,
Ni2+, Pb2+ and Zn2+
Figure 4. Job’s plot of RBMABin an ethanol-H2O (3:2, v/v, PBS buffer, 1.2
µmol L-1, pH 7.2) solution with a total concentration of [RBMAB] +Fe3+ =
50 µmol L-1. The absorption wavelength was 562 nm
Figure 5. Fluorescence spectra of RBMAB (10 µmol L-1) in the absence and
presence of 10 equivalents of various metal ions: Ag+, Al3+, Ba2+, Ca2+, Cd2+,
Co2+, Cr3+, Cs2+, Cu+, Cu2+, Fe2+, Fe3+, Hg2+, K+, Li+, Mg2+, Mn2+, Na+, Ni2+,
Pb2+ and Zn2+
Figure 6. Fluorescence spectra of RBMAB(20 µmol L-1) when different
complex. As shown in Figure 8, a linear relationship was obtained, and the binding constant was calculated to be 2.34 × 10⁴ L mmol-1
in an ethanol-H2O (3:2 v/v, PBS buffer, 1.2 mmol L-1, pH 7.2). The
detection limit of RBMAB for Fe3+ was also calculated based on the
fluorescence titration using the following equation: Detection limit = 3SD/S, where SD is the standard deviation of the blank and S is the slope of the calibration curve. The fluorescence emission spectrum of RBMAB was measured 10 times, and the standard deviation of the blank measurement was calculated. To obtain the slope, the ratio of fluorescence intensity at 582 nm was plotted versus the Fe3+concentration (Figure 9). Thus, the calculated detection limit
was 0.021 µmol L-1 (Supporting Material).
1H NMR study of RBMAB with Fe3+
The 1H NMR spectra of RBMAB in the presence and absence
of Fe3+ were also investigated to further elucidate the nature of the
interaction between Fe3+ and RBMAB. As shown in Figure 10, after
0.2 equivalent of Fe3+ was added to RBMAB in a CD
3OD:D2O (5:1
v/v) solution, the proton signals of He, Hf and Hg displayed apparent
downfield shifts from the peaks, which were centered at 6.421 ppm,
6.371 ppm and 6.327 ppm to two broad peaks, which were centered at 6.756 ppm and 6.569 ppm, respectively. These shifts originate from the Fe3+-induced ring-opening process of the rhodamine B
spi-rocycle. This indicates the coordination of RBMAB and Fe3+, which
was proposed in Scheme 3, where Fe3+ may be coordinated with one
oxygen atom and two nitrogen atoms on the side chain of RBMAB.
Density functional theory (DFT) calculations
To better understand the nature of the coordination of Fe3+
with RBMAB, the energy-optimized structures of RBMAB and RBMAB-Fe3+ (Figure 11) were obtained using DFT calculations
with the B3LYP method, where 6-31+G(d,p) was the basis set. The spatial distributions and orbial energies of the HOMO and LUMO of RBMAB and RBMAB-Fe3+ were also generated using DFT
calcula-tions (Figure 12). The results indicate that RBMAB, the HUMO was spread over the side benze moiety, whereas the HOMO was distri-buted on the spirolactam of rhodamine B moiety. The π electron on
the HOMO of the RBMAB-Fe3+ complex were also mainly located
on the side benze moiety, whereas the LUMO was mostly located on the guest Fe3+ ion. The energy gaps between the HOMO and
LUMO in the probe RBMAB and RBMAB-Fe3+ were calculated to be
91.2 kcal mol-1 and 63.5 kcal mol-1 respectively. The results show that
the binding of Fe3+ to RBMAB decreases the HOMO-LUMO energy
gap of the complex and stabilizes the system.
Cell studies of RBMAB in the presence of Fe3+
Because of its favorable molecular properties, RBMAB should be suitable for fluorescence imaging in living cells. Therefore, we further evaluated the applicability of RBMAB as a fluorescent probe for Fe3+ through in vitro cell studies. The direct detection of Fe3+ in
living cells using the probe RBMAB was examined using cultured human cells (L-02). The cells were incubated with 0.1 mmol L-1
FeCl3 in50 mmol L
-1 PBS buffer for 30 min at room temperature and
subsequently incubated with the probe 20 µmol L-1. RBMAB at 37
°C under 5% CO2 for additional 120 min. Fluorescence microscopic
studies show a lack of fluorescence for human L-02 cells after they were treated with only RBMAB (Figure 13e). After incubation with FeCl3, a bright fluorescence was observed in L-02 cells (Figure 13f).
The phase-contrast images in the bright fields of the cells show that the cells were viable during the experiments, which indicates that Figure 7. Metal-ion selectivity profiles of RBMAB(10 µmol L-1). The black
bars represent the fluorescence intensity (582 nm) of RBMABin the presence of 10 eq. of free ionsin the absence of Fe3+ while the red bars represent after
the addition of Fe3+
Figure 8. Benesi-Hildebrand plot (λem= 582 nm) of 1/(F - F0) vs. 1/[ Fe3+]
based on a 1:1 association stoichiometry between RBMABand Fe3+
Figure 9. Fluorescence intensity at 582 nm of RBMAB (20 µmol L-1) in an
ethanol-H2O (3:2 v/v, PBS buffer, 1.2 mmol L-1, pH 7.2) solution with different
Scheme 3 Proposed complexation mechanism of RBMAB with Fe3+
Figure 10. 1H NMR spectra (500 MHz, 298K, methanol-d4:D
2O (5:1 v/v)) of (a)RBMABand (b) RBMAB+0.2 equivalent Fe3+
Figure11. Energy-minimized structures of (a) RBMAB and (b) RBMAB-Fe3+
RBMAB may be cell-permeable and non-toxic to the cells. To evaluate the cytotoxicity of RBMAB, the cell viability was determined using a
MTT assay in L-02 cells with RBMAB concentrations of 0-20 µmol L-1. When RBMAB was incubated with L-02 cells for 48 h, it
showed no toxicity to the cells (Figure 14). These results suggest that RBMAB may be suitable to be used as a potential probe to detect Fe3+ in biological samples.
CONCLUSIONS
In summary, a new rhodamine B derivative, RBMAB, was de-signed and synthesized as a highly selective chemosensor for Fe3+
ions in an ethanol/PBS (3:2 v/v; 1.2mmol L-1, pH 7.2) solution. The
chemical structure of RBMAB was analyzed using 1H NMR, 13C
NMR and HRMS. The 1:1 coordination mode was proposed based on a Job’s plot. It has a low detection limit of 0.021µm . The Fe3+
binding ability of RBMAB was further demonstrated using DFT calculations, which suggest that the binding of RBMAB decreases the HOMO-LUMO energy gap of the complex. Cell studies further demonstrate that RBMAB can be a potential probe to detect Fe3+ in
human liver cells (L-02).
SUPPLEMENTARY MATERIAL
The detailed characterization data for RBMAB, including 1H
NMR, 13C NMR and HRMS can be found, in the online version, at
http://www.quimicanova.sbq.org.br/ with free access.
ACKNOWLEDGMENTS
Figure 12. HOMO and LUMO orbitals of (A) RBMAB and (B) the
RBMAB-Fe3+
Figure 14. Cytotoxicity of RBMAB in human L-02 hepatocytes. The cells were treated with different concentrations of RBMABfor 48 h, and the cell viability assay was determined using an MTT assay
Figure 13 Fluorescence images of human L-02 hepatocytes incubated with RBMAB and/or Fe3+. The L-02 cells were incubated with 0.1 mmol L-1 FeCl
3
in 50 mmol L-1PBS buffer for120 min at room temperature, followed by 20
µmol L-1 RBMAB for additional 30 min (e: bright-field image; f: fluorescence
image). The DMSO-treated cells were taken as a control (a: bright-field image;
b: fluorescence image), and only RBMAB-treated cells were also taken as a control (c: bright-field image; d: fluorescence image).
REFERENCES
1. Andrews, N. C.; N. Engl. J. Med. 1999, 341, 1986.
2. Steinmetz, H. T.; Tsamaloukas, A.; Schmitz, S.; Wiegand, J.; Rohrberg, R.; Eggert, J.; Thomas, L; Supportive Care in Cancer 2011, 19, 261. 3. Pietrangelo, A.; N. Engl. J. Med. 2004, 350, 2383.
4. Egan, T. J.; Hunter, R.; Kaschula, C. H.; J. Med. Chem. 2000, 43, 283. 5. Kienzl, E.; Puchinger, L.; Jellinger, K.; Linert, W.; Stachelberger, H.;
Jameson, R. F.; J. Neurol. Sci. 1995, 134, 69.
6. Ong, W. Y.; Farooqui, A. A.; J. Alzheimer’s Dis. 2005, 8, 183. 7. Ghaedi, M.; Shokrollahi, A.; Kianfar, A. H.; Mirsadeghi, A. S.;
Pourfarokhi, A.; Soylak, M.; J. Hazard Mater. 2008, 154, 128. 8. Yaman, M.; Kaya. G.; Anal. Chim. Acta 2005, 540, 77.
9. Scheers, N.; Andlid, T.; Alminger, M.; Sandberg, A. S.; Electroanalysis
2010, 22, 1090.
10. Sahoo, S. K.; Sharma, D.; Bera, R. K.; Crisponi, G.; Callan, J. F.; Chem. Soc. Rev. 2012, 41, 7195.
11. Yang, Y.; Gao, C. Y.; Zhang, N.; Dong, D.; Sens. Actuators, B 2016, 222, 741.
12. Wilson, A. D.; Analyst 1960, 85, 823.
13. Patil, N. B.; Bhide, S. V.; Kale, N. R.; Carbohydr. Res. 1973, 29, 513. 14. Kwon, J. Y.; Jang, Y. J.; Lee, Y. J.; Kim, K. M.; Seo, M. S.; Nam, W.;
Yoon, J.; J. Am. Chem. Soc. 2005, 127, 10107.
15. Ko, S. K.; Yang, Y. K.; Tae, J.; Shin, I.; J. Am. Chem. Soc. 2006, 128, 14150.
16. Tang, M.; Wen, G.; Luo, Y.; Kang, C.; Liang, A.; Jiang, Z.;
Luminescence 2015, 30, 296.
17. Gao, T.; Lee, K. M.; Yang, S. I.; J. Toxicol. Environ. Health Sci. 2009,
1, 159.
18. Ju, H.; Lee, M. H.; Kim, J.; Kim, J. S.; Kim, J.; Talanta, 2011, 83, 1359. 19. Zhou, Y.; Wang, F.; Kim, Y.; Kim, S. J.; Yoon, J.; Org. Lett. 2009, 11,
4442.
20. Zhang, J. F.; Zhou, Y.; Yoon, J.; Kim, Y.; Kim, S. J.; Kim, J. S. ; Org. Lett. 2010, 12, 3852.
21. Yuan, Y.; Sun, S.; Liu, S.; Song, X.; Peng, X.; J. Mater. Chem. B 2015,
3, 5261.
22. Liu, W.; Xu, L.; Sheng, R.; Wang, P.; Li, H.; Wu, S.; Org. Lett. 2007, 9, 3829.
23. Shim, S.; Tae, J.; Bull. Korean Chem. Soc. 2011, 32, 2928.
24. Wan, Y.; Guo, Q.; Wang, X.; Xia, A.; Anal. Chim. Acta 2010, 665, 215. 25. Li, M.; Zhang, D.; Liu, Y.; Ding, P.; Ye, Y.; Zhao, Y.; J. Fluoresc. 2014,
![Figure 8. Benesi-Hildebrand plot ( λ em= 582 nm) of 1/(F - F 0 ) vs. 1/[ Fe 3+ ] based on a 1:1 association stoichiometry between RBMAB and Fe 3+](https://thumb-eu.123doks.com/thumbv2/123dok_br/18986561.459088/5.892.87.448.88.360/figure-benesi-hildebrand-plot-based-association-stoichiometry-rbmab.webp)


