Artigo
*e-mail: [email protected]
ELEMENTAL COMPOSITION OF PM10 AND PM2.5 FOR A SAVANNA (CERRADO) REGION OF SOUTHERN
AMAZONIA
Franciele Bomfiglio Santannaa,*, Edilberto Ojeda de Almeida Filhoa, George Louis Vourlitisb, Paulo Henrique Zanella de
Arrudaa, Rafael da Silva Paláciosa and José de Souza Nogueiraa
aInstituto de Física, Universidade Federal de Mato Grosso, 78060-900 Cuiabá – MT, Brasil
bDepartment of Biological Sciences, California State University San Marcos, 92096 San Marcos – CA, United States of America
Recebido em 07/03/2016; aceito em 15/06/2016; publicado na web em 26/08/2016
Brazil plays an important role with regard to the emission of aerosols into the atmosphere. Ecosystems such as the Amazonian tropical forest and Brazilian Cerrado are undergoing sweeping changes. These human activities promote an increase in the levels of gases and particles emitted into the atmosphere. To determine how these activities have affected the emission of coarse and fine particulate matter (PM10 and PM2.5), atmospheric aerosol samples were collected continuously from June 2004 to April 2005 in the Cuiaba Basin of south-central Mato Grosso, Brazil. Aerosols were sampled using stacked filter units. Filters were analysed for particulate mass, black carbon and for concentrations of seventeen elements by Particle Induced X-Ray Emission. The results revealed that Mg, Al, Si, S, K, Ca, Ti and Fe were the major components detected in PM2.5 and PM10. The high enrichment factors observed in PM2.5 and PM10 suggest that anthropogenic activities were the predominant source for elements such as Cu, Zn and Pb. These data indicate that most of the aerosols measured in the Cuiaba Basin originate from land conversion and biomass burning. These patterns are similar to those observed in other Cerrado and Amazonian forest areas that are undergoing rapid and spatially extensive land-cover change. Keywords:atmospheric aerosols; atmospheric pollution; biomass burning; factor analysis.
INTRODUCTION
Particulate material (PM) from the atmosphere comprises a mix-ture of materials that occur naturally or originate from anthropogenic activities. PM consists of fine (PM2.5; particles measuring < 2.5 µm
in diameter) and coarse (PM10; < 10 µm) particles in both liquid and
solid phases. Particulate material is a mixture that can include smoke, soot, dust, salts, acids and metals. PM10 is an important component in
air pollution and can be associated with health1-2 and environmental
quality problems such as a reduction in visibility3 and changes in
ra-diation and energy balance.4 Recently, in the developed world (Europe
and North America), modern technology has promoted a reduction in PM concentration,5 while in other developing countries such as China
and India, atmospheric PM concentration has been increasing due to intensive energy use – a problem that Brazil may face.
The story of aerosols in the Brazilian Amazon is largely a tale of two seasons. The significant inter-annual variation in aerosol properties is almost entirely a function of the intensity of the biomass burning during the dry season.6-10 Studies investigating the elemental composition of
aerosols in the region have shown that the emission of Black Carbon during the dry season, composed of soot mostly from combustion, is associated with elements known as burning emission tracers such as S, K, Cl, Ca and Zn.11,12 Focus during the wet season has illustrated
the importance of vegetation aerosol emissions, which act as cloud condensation nuclei (CCN), effectively controlling cloud formation and precipitation, and aerosol aging and humidification processes have been examined to improve regional precipitation models.10,13-16
Here we describe the seasonal variations in atmospheric aerosol concentration in the woodland/savannah (Cerrado) region of South-central Mato Grosso, Brazil. Cerrado in this region has been radically changed by human activities such as burning, cattle ranching, and agriculture.17-21 By the early 1990s, an estimated 55-67% of the
Cerrado region had been converted for human use, but more recent
accounts suggest that as much as 80% of the Cerrado has been lost to pasture or cropland expansion.22 Because much of the aerosol
loading in the Amazon Basin is due to human activities, based on the present study findings, the authors conclude that biomass burn-ing in the dry season represents the major source of both PM2.5 and
PM10 in the Cerrado. EXPERIMENTAL
Area of study
Daily samples of PM10 and PM2.5 were collected continuously at
Fazenda Miranda (Farm), located approximately 15 km from Cuiabá, a city of approximately 0.6 million inhabitants and the capital of the state of Mato Grosso. The Fazenda Miranda is located in the Western-Central region of Mato Grosso state, Brazil (15°43’ S and 56°04’ W, altitude of 180.0 m) (Figure 1). The semiarid climate predominates in the Cerrado region (woodland/savanna), having two clearly defined seasons (hot and rainy summer and dry winter with moderate-low temperatures). Precipitation averages 1420 mm/year,23 and >70% of
rainfall occurs between November and March. During our study, the winds were predominantly from the Northwest with a mean velocity of 1.58 m/s, similar to that observed during other years.24 The mean
temperature was 26.7 °C and the mean relative air humidity was 66%, similar to the long-term (30-year) average reported for the region.23
However, during the study period precipitation measured during the wet season – from November to April – was 1125 mm, which is lower than the long-term average.23 The vegetation cover is a mixture of
cattle pasture, grass-dominated Cerrado, upland woodlands, forests, and riparian vegetation near rivers and streams.25
Sampling
installed at a height of 2.8 m above ground level and samples were collected at a flow rate of 16 L min-1. The SFU system used two 47
mm polycarbonate filters with an 8 µm pore size to collect samples of particles with an aerodynamic diameter of between 2.5 and 10 µm, and porosity of 0.4 µm to collect samples of particles with an aerodynamic diameter of less than 2.5 µm.11,28 Particles larger than
10 µm were retained at the filter inlet. Filters were replaced three times per week – with two sampling periods of 48 hours each and one period of 72 hours.
Particulate mass
The mass of the particulate material was determined gravime-trically, by weighing the filters before and after sampling using a Mettler electronic micro-analytical scale accurate to the nearest 1 µg. Before weighing, the filters were kept in 50% relative humidity at a temperature of 20 °C for 24 hours. Electrostatic charges were controlled using a radioactive source. Filter masses were measured twice, both before and after sampling, and the difference in mean filter mass before and after sampling corresponded to the mass of the particulate material deposited during the sampling period. This same process was conducted for unused filters, representing blanks used to determine changes in the mass of clean filters that might have occurred due to the filter weighing and handling process. The concentration of black carbon was determined using a reflectance technique, calibrated with a Monarch soot carbon standard, on a smoke stain reflectometer manufactured by Diffusion Systems.
Analysis of chemical elements
The elemental concentrations were determined by the PIXE (Particle Induced X-ray Emission) method, where an energy beam of 1.7 MeV protons was generated by a particle accelerator at LAMFI (Materials Analysis Laboratory by Ion Beam) of the University of
São Paulo, Institute of Physics, using a Tandem Pelletron (NEC, model 5SDH). The method quantified concentrations for up to 17 trace elements (Mg, Al, Si, P, S, Cl, K, Ca, Ti, Cr, Mn, Fe, Ni, Cu, Zn, Br and Pb). Detection limits are typically 5 ng m-3 for elements
in the range 13 < Z < 22 and 0.4 ng m-3 for elements with Z > 22. Statistical analysis
Factor analysis (FA), using Principal Component Analysis with VARIMAX rotation, was applied to the data of elemental concentrations to identify the main emission sources of atmospheric aerosols measu-red in the region. Factor analysis explains the variance or covariance of an extensive set of data and reduces the original set of variables to a lower number of uncorrelated principal components preserving the information in the original database. These principal components were then used to identify the main emission sources of atmospheric aerosols. Only components with an eigenvector >1.0 were retained.
RESULTS AND DISCUSSION
Aerosol time series
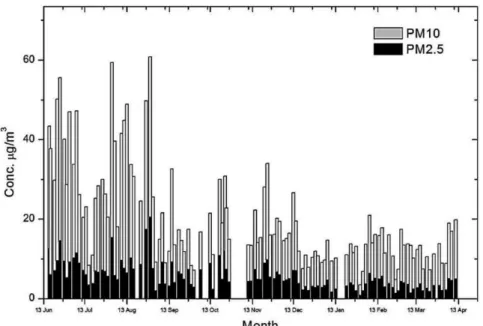
Atmospheric concentrations of particulate matter (PM10 and
PM2.5) proved higher in the dry season (June-October) than during
the rest of the year (Figure 2). Dry season PM10 concentrations ranged
from 9 to 61 µg/m3 while PM
2.5 were from 4 to 20 µg/m3. In contrast,
wet season levels of PM10 and PM2.5 ranged from 4 to 35 µg/m 3 and
2 to 11 µg/m3, respectively. Thus, wet season concentrations of PM
were roughly half the levels observed during the dry season. Wet deposition, a function of precipitation, can help clean the atmos-phere in the wet season,29 but monthly fire records were correlated
with PM concentrations.30 These dynamics indicate that the timing
Aerosol concentration time series of four elements (Zn, Si, Br and P) that represent urban, soil, fire, and biogenic sources respec-tively, had differing dynamics during the study period (Figure 3). Temporal patterns for Zn, which is indicative of an urban pollution source,31,32 show relatively large day-to-day variations that lacked a
consistent seasonal pattern and likely reflect high-frequency (i.e., daily) variations in synoptic weather patterns. By contrast, Si and Br, which are indicative of soil and biomass burning, respectively12,33,
displayed larger variation and magnitude during the dry season. Most of the variation in Si was due to the PM10 fraction, which is likely
indicative of soil dust that is re-suspended as the soil dries and the wind speed increases during the season. In contrast, much of the temporal variation in Br was due to variation in the PM2.5 fraction,
which is presumably indicative of the fine particles released as a result of biomass burning.12,33 For biogenic constituents such as P, temporal
variations in the PM10 fraction were substantially larger than for the
PM2.5 fraction (Figure 3). While seasonal variations for P were not
as large as for Si or Br, atmospheric contributions of P were higher during the wet season when plant productivity is greater.11,34 Figure 2. Time series of the PM10 (sum of fine and coarse particulates; grey-bars) and PM2.5 (black-bars) concentrations for Fazenda Miranda from June 2004
until April 2005. Gaps on the graph represents points without data collection
Seasonal Variations in elemental concentrations of PM2.5 and
PM10 at Fazenda Miranda
The mean concentrations for each of the fractions – PM2.5 and
PM10 – were segregated into black carbon (BC) and 17 trace elements
for the wet and dry season periods (Table 1). Mg, Al, Si, S, K, Ca, Ti and Fe were the main elements detected in PM2.5 and PM10,
represen-ting 97.9% and 98.6%, respectively, of all elements measured during the dry season, and 94.8% and 94.3% during the wet season. High concentrations of Al, Si, Ca and Fe are commonly found in crustal elements, and were detected at the greatest proportions in the PM measurements for the dry season (Table 1). The percentage increase in typical soil elements Al, Si, Ca and Fe was likely due to soil dryness during the dry season and the characteristic rise in mean wind speed which typically occurs during the dry season24 and that increases soil
dust resuspension. Typical crustal elements such as Al, Si, Ca, Ti and Fe predominated in the PM10 aerosol fraction. The PM2.5/PM10 values
(Table 1) were 0.17, 0.16, 0.11, 0.21 and 0.20, respectively, for the dry season, and 0.20, 0.18, 0.14, 0.21 and 0.23, for the wet season. The PM2.5/PM10 ratios for BC, S, and K, which are most closely
as-sociated with biomass burning,12,33 were 0.80, 0.74 and 0.53, for the
dry season; and 0.83, 0.77 and 0.60, for the wet season, respectively.
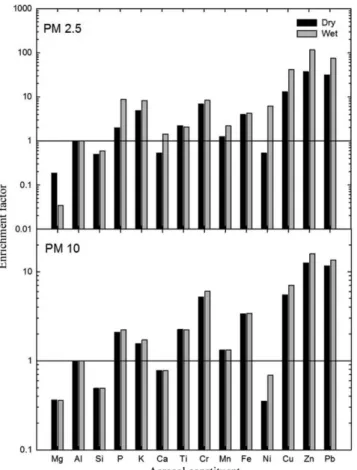
Enrichment factor
In an attempt to understand potential sources of the atmospheric elements measured in the present study, we calculated an enrich-ment factor (EF) quantifying the contribution of each eleenrich-ment in the atmosphere relative to the crust.35,36 The enrichment factor (EF) was
calculated as:
(1)
where (X/Al)aerosol and (X/Al)crust refer to the ratio of the concentration
of X to Al in the atmosphere and X to Al in average crustal ma-terial, respectively. Al is typically used as a reference because it makes up over 8 percent of average crustal material.35,36 Taylor and
McLennan’s37 average upper continental crust composition was used
as the elemental composition of the crust material. Elements with EF close to 1.0 have a strong natural component while elements with high enrichment factors tend to be of artificial origin.31,32
In the PM2.5 fraction, Si, Ca, Ti and Mn had EFs closer to 1.0
during both wet and dry seasons (Figure 4), suggesting they were attributed mainly to soil dust. Cu, Zn and Pb had higher EFs (Figure 4) that might be associated with the influence of urban emissions of aerosols from Cuiabá, which has over 0.6 million inhabitants. P was another element that had a high EF value during the wet season in PM2.5, although previous studies have shown that such enrichment was
derived not from anthropogenic but biogenic natural emissions from plants and regional vegetation.11,34 In general, the EFs of PM
2.5 were
higher than those of PM10, during both wet and dry seasons (Figure 4). Sources of particulate matter
The hierarchical clustering and principal component analyses were applied to the PM2.5 and PM10 fractions to assess the
correla-tions between different elements and identify the main sources of atmospheric aerosol emissions in the region. Nineteen variables (PM, BC, Mg, Al, Si, P, S, Cl, K, Ca, Ti, Cr, Mn, Fe, Ni, Cu, Zn, Br and Pb) were included in this analysis, and analyses were divided into seasons due to the different seasonal trends observed in these constituents.
The main related groups of elements for the dry season PM10
frac-tion were PM, BC, P, Cl, K, Ca, Cu, Zn, Pb; Ti, Mn and Fe; S and Br, where factor analysis identified three factors with eigenvalues > 1 that explained 75% of the cumulative variance in dry season PM10
emis-sions (Table 2). The first group (Factor 1) explained approximately 41% of the variance in the dry season PM10 fraction and included
elements related to emissions from fire and biogenic sources.12,33
However, the presence of BC points clearly to an association with
Table 1. Mean concentrations and standard deviations (SD) associated with PM, BC and 17 elements of PM2.5 and PM10 for dry and wet seasons (PM and BC are expressed as µg m-3, and the elements expressed as ng m-3). N = number of samples
Var.
Dry season Wet season
PM2.5 PM10 PM2.5 PM10
Mean SD N Mean SD N Mean SD N Mean SD N
PM 7.6 3.7 53 20.1 11.5 53 0.4 3.9 1.8 62 9.9 3.8 62 0.4
BC 1.2 0.8 53 1.5 0.9 53 0.8 0.9 0.4 62 1.0 0.5 62 0.8
Mg 16.5 9.1 12 48.7 39.0 44 0.3 8.8 0.2 2 26.4 13.8 61 0.3
Al 116.6 127.2 52 700.4 644.0 53 0.2 44.2 42.2 62 226.2 191.4 62 0.2
Si 200.9 196.6 53 1296.1 1216.6 53 0.2 90.3 66.7 61 505.6 406.3 62 0.2
P 4.2 2.5 31 15.01 11.5 50 0.3 4.0 1.5 59 20.3 8.2 62 0.2
S 166.2 97.6 53 224.8 156.9 53 0.7 161.0 99.1 62 208.7 113.3 62 0.8
Cl 4.2 2.2 53 14.3 10.6 53 0.3 2.9 1.6 59 17.2 8.8 62 0.2
K 198.8 140.9 53 376.0 283.0 53 0.5 127.9 78.0 62 211.5 101.9 62 0.6
Ca 22.2 20.4 53 205.5 192.0 53 0.1 22.7 13.3 62 167.4 110.7 62 0.1
Ti 9.8 9.3 53 47.7 48.7 53 0.2 3.8 2.4 60 17.6 14.7 62 0.2
Cr 1.3 1.2 18 2.4 2.1 44 0.6 0.7 0.5 21 1.0 0.6 59 0.7
Mn 1.5 1.1 48 7.5 5.9 53 0.2 0.9 0.5 62 4.3 2.0 62 0.2
Fe 189.4 214.6 53 939.5 989.9 53 0.2 75.9 81.7 62 326.7 317.7 62 0.2
Ni 0.4 0.2 18 0.4 0.3 33 1.1 0.4 0.3 50 0.4 0.24 61 1.0
Cu 0.6 0.6 51 1.5 1.3 53 0.4 0.7 0.5 62 1.3 0.7 62 0.5
Zn 4.4 3.2 53 9.0 6.6 53 0.5 5.0 3.0 62 8.3 5.0 62 0.6
Br 1.7 1.0 53 2.1 1.2 53 0.8 0.9 0.5 58 1.0 0.6 59 0.9
biomass burning.11 The second group (Factor 2) explained an
addi-tional 21% of the variance and contained elements associated with soil dust, while the third factor explained approximately 13% of the variance and comprised S and Br, again associated with biomass burning (Table 2).
For the PM2.5 fraction, factor analysis identified four main factors
with eigenvalues > 1 that explained 77% of the cumulative variance (Table 2). The first group (Factor 1) explained approximately 25% of the variance in PM2.5 emission and contained Al, Si, Ti and Mn,
which represent the contribution of the crustal material. The second group (Factor 2) explained an additional 24% of the cumulative vari-ance and contained Ca, Fe, Cu, Zn and Pb, primarily associated with anthropogenic emissions from the urban area of Cuiabá. The third group (Factor 3) explained 20% of the cumulative variance and com-prised predominantly PM, BC, Cl, K and Br, associated with biomass burning. Lastly, the fourth group (Factor 4) explained the final 8% of the cumulative variance and consisted primarily of P, suggesting a natural (plant and vegetation) emission (Table 2).
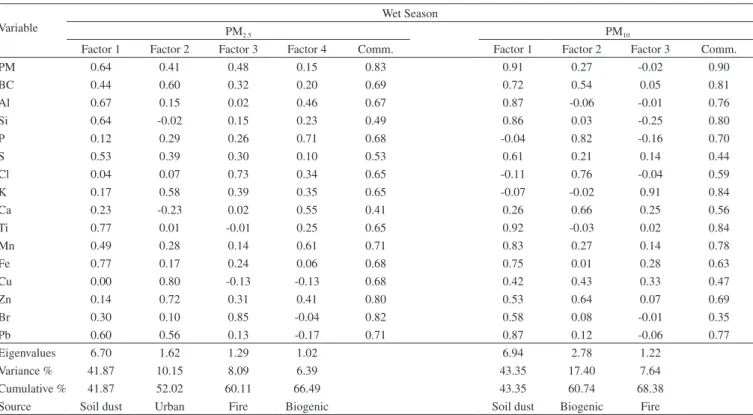
Factor analyses for the wet season identified four principal fac-tors for the PM2.5 fraction with eigenvalues > 1 that explained 67%
of the cumulative variance in PM2.5 emissions (Table 3). The first
factor explained 42% of the variance and was composed of PM, Al, Si, Ti, Fe and Pb, with Al, Si, and Fe associated mainly with soil dust. The second group (Factor 2) explained 10% of the variance in PM2.5 and consisted primarily of Cu and Zn, which are associated
with contributions from urban emissions. The third factor explained 8.1% of the variance, and included Cl and Br, which are associated with biomass burning. Lastly, the fourth group explained only 1% of the variance in wet season PM2.5 emissions and was composed of
P and Mn, suggesting biogenic emissions.
For the PM10 fraction, factor analysis identified four factors with
eigenvalues > 1 that explained approximately 68% of the cumulative
Figure 4. Enrichment factors for the PM2.5 fraction (top panel) and the PM10
fraction (bottom panel). Enrichment factors close to 1 indicate a natural source while enrichment factors > 1 indicate an anthropogenic source
Table 2. Factor loadings and communalities for the Factor Analysis of PM10 and PM2.5 element concentrations for Fazenda Miranda during the dry season. Also shown are the eigenvalues for each factor, the percent of the variation explained by each factor, the cumulative variation explained by the factors combined, and the inferred source of each factor
Variable
Dry Season
PM2.5 PM10
Factor 1 Factor 2 Factor 3 Factor 4 Comm. Factor 1 Factor 2 Factor 3 Comm.
PM 0.46 0.23 0.81 0.03 0.92 0.71 0.51 0.35 0.89
BC 0.49 0.52 0.56 0.12 0.84 0.86 0.20 0.11 0.80
Al 0.87 0.20 0.20 -0.18 0.87 0.54 0.54 0.23 0.64
Si 0.74 0.08 0.23 0.36 0.74 0.54 0.49 0.43 0.71
P 0.21 0.25 0.15 0.85 0.86 0.70 0.23 0.16 0.57
S 0.30 0.34 0.12 -0.41 0.39 0.07 0.19 0.84 0.74
Cl 0.42 0.30 0.70 0.05 0.75 0.75 0.17 0.33 0.70
K 0.28 0.52 0.60 0.08 0.72 0.81 0.12 0.26 0.74
Ca 0.13 0.82 0.27 -0.22 0.81 0.67 0.42 0.27 0.69
Ti 0.87 0.20 0.15 -0.01 0.82 0.05 0.90 0.08 0.82
Mn 0.77 0.43 0.23 0.19 0.86 0.45 0.66 0.41 0.80
Fe 0.45 0.60 0.30 0.25 0.72 0.35 0.79 0.04 0.75
Cu 0.27 0.73 0.07 0.11 0.63 0.75 0.38 0.18 0.73
Zn 0.02 0.79 0.30 0.05 0.72 0.83 0.28 0.32 0.87
Br -0.01 0.12 0.93 0.03 0.89 0.54 0.00 0.61 0.67
Pb 0.43 0.73 0.12 0.33 0.84 0.85 0.29 -0.12 0.82
Eigenvalues 3.97 3.87 3.16 1.35 6.56 3.31 2.05
Variance % 24.82 24.18 19.72 8.45 41.02 20.66 12.80
Cumulative % 24.82 49.00 68.72 77.17 41.02 61.67 74.48
Table 3. Factor loadings and communalities for the Factor Analysis of PM10 and PM2.5 element concentrations for Fazenda Miranda during the wet season. Also shown are the eigenvalues for each factor, the percent of the variation explained by each factor, the cumulative variation explained by the factors combined, and the inferred source of each factor
Variable
Wet Season
PM2.5 PM10
Factor 1 Factor 2 Factor 3 Factor 4 Comm. Factor 1 Factor 2 Factor 3 Comm.
PM 0.64 0.41 0.48 0.15 0.83 0.91 0.27 -0.02 0.90
BC 0.44 0.60 0.32 0.20 0.69 0.72 0.54 0.05 0.81
Al 0.67 0.15 0.02 0.46 0.67 0.87 -0.06 -0.01 0.76
Si 0.64 -0.02 0.15 0.23 0.49 0.86 0.03 -0.25 0.80
P 0.12 0.29 0.26 0.71 0.68 -0.04 0.82 -0.16 0.70
S 0.53 0.39 0.30 0.10 0.53 0.61 0.21 0.14 0.44
Cl 0.04 0.07 0.73 0.34 0.65 -0.11 0.76 -0.04 0.59
K 0.17 0.58 0.39 0.35 0.65 -0.07 -0.02 0.91 0.84
Ca 0.23 -0.23 0.02 0.55 0.41 0.26 0.66 0.25 0.56
Ti 0.77 0.01 -0.01 0.25 0.65 0.92 -0.03 0.02 0.84
Mn 0.49 0.28 0.14 0.61 0.71 0.83 0.27 0.14 0.78
Fe 0.77 0.17 0.24 0.06 0.68 0.75 0.01 0.28 0.63
Cu 0.00 0.80 -0.13 -0.13 0.68 0.42 0.43 0.33 0.47
Zn 0.14 0.72 0.31 0.41 0.80 0.53 0.64 0.07 0.69
Br 0.30 0.10 0.85 -0.04 0.82 0.58 0.08 -0.01 0.35
Pb 0.60 0.56 0.13 -0.17 0.71 0.87 0.12 -0.06 0.77
Eigenvalues 6.70 1.62 1.29 1.02 6.94 2.78 1.22
Variance % 41.87 10.15 8.09 6.39 43.35 17.40 7.64
Cumulative % 41.87 52.02 60.11 66.49 43.35 60.74 68.38
Source Soil dust Urban Fire Biogenic Soil dust Biogenic Fire
variance in wet season PM10 emissions (Table 3). The first group
explained more than half of the cumulative variance (43%) and com-prised PM, BC, Al, Si, Ti, Mn and Pb, indicative of crustal material. The second factor explained a further 17% of the cumulative variance and consisted largely of P, suggesting a biogenic origin.33 The final
factor explained an additional 8% of the cumulative variance, where the ratio of excess K in the fine fraction of aerosols is thought to be an indicator of biomass burning.12,38
CONCLUSIONS
The PM2.5 and PM10 elemental compositions had high seasonal
variations. In general, the mean concentrations of these elements in both fractions was higher during the dry season – when biomass burning intensifies and drier, windier conditions promote an increase in the dispersion of soil and dust. The concentrations of elements associated with biomass burning suggest that considerable biomass burning took place during the wet season.
The study of atmospheric particulate matter (PM10 and PM2.5)
in this Cerrado-Pantanal transition area revealed the presence of a variety of chemical constituents, allowing characterization of diffe-rent aerosol sources for the region. Notably, biomass burning and soil were major sources of atmospheric particular matter during the dry season while biogenic sources appeared to be relatively more common during the wet season. Urban sources were an important source of PM2.5 during both wet and dry seasons. These results are
consistent with those reported for other savannah and tropical forest regions of Brazil with extensive land-cover change, and indicate that human activities generate large atmospheric particulate matter inputs.
ACKNOWLEDGMENTS
The authors extend their thanks to the CNPq (Conselho Nacional
de Desenvolvimento Científico e Tecnológico) for financial support, CNPq/457824/2013-1 approved under call Nº 68/2013 MCTI/CNPq/ FNDCT - Ação Transversal/LBA.
REFERENCES
1. Dockery, D.; Pope, A. In Particles in Our Air: Concentration and Health Effects; Wilson, R., Spengler, J. D., eds.; Harvard University Press: Cambridge, MA, USA, 1996, cap. 6.
2. Villeneuve, P. J.; Burnett, R. T.; Shi, Y.; Krewski, D.; Goldberg, M. S.; Hertzman, C.; Chen, Y.; Brook, J.; J. Exposure Anal. Environ. Epidemiol. 2003, 13, 427.
3. Watson, J. G.; J. Air Waste Manage. Assoc. 2002, 52, 628.
4. Eck, T. F.; Holben, B. N.; Slutsker, I.; Setzer, A.; J. Geophys. Res.: Atmos. 1998, 103, 31865.
5. Mkoma, S. L.; Maenhaut, W.; Chi, X.; Wang, W.; Raes, N.; Atmos. Environ. 2009, 43, 631.
6. Coutinho, L. M.; Miranda, H. S.; Morais, H. C.; Revista do Instituto de Estudos Avançados da USP 2002, 55 pp.
7. Guyon, P.; Graham, B.; Roberts, G. C.; Mayol-Bracero, O. L.; Maenhaut, W.; Artaxo, P.; Andreae, M. O.; Atmos. Environ. 2004, 38, 1039.
8. Freitas, S. R.; Longo, K. M.; Silva Dias, M. A. F.; Silva Dias, P. L.; Chatfield, R.; Prins, E.; Artaxo, P.; Grell, G. A.; Recuero, F. S.; Environ. Fluid Mech. 2005, 5, 135.
9. Artaxo, P.; Oliveira, P. H.; Lara, L. L.; Pauliquevis, T. M.; Rizzo, L. V.; Pires Junior, C.; Paixão, M. A.; Longo, K. M.; Freitas, S.; Correia, A. L.; Revista Brasileira de Meteorologia 2006, 21, 168.
10. Schafer, J.; Eck, T.; Holben, B.; Artaxo, P.; Duarte, A.; J. Geophys. Res.: Atmos. 2008, 113, D04204.
11. Echalar, F.; Artaxo, P.; Martins, J. V.; Yamasoe, M.; Gerab, F.; Maenhaut, W.; Holben, B.; J. Geophys. Res.: Atmos. 1998, 103, 31849.
T. M.; Andreae, M. O.; Guyon, P.; Gatti, L. V.; Leal, A. M. C.; J. Geophys. Res.: Atmos. 2002, 107, LBA 49-1.
13. Silva Dias, M.; Petersen, W.; Silva Dias, P.; Cifelli, R.; Betts, A.; Longo, M.; Gomes, A.; Fisch, G.; Lima, M.; Antonio, M.; J. Geophys. Res.: Atmos. 2002, 107, LBA 46-1.
14. Falkovich, A. H.; Graber, E. R.; Schkolnik, G.; Rudich, Y.; Maenhaut, W.; Artaxo, P.; Atmos. Chem. Phys. 2005, 5, 781.
15. Mircea, M.; Facchini, M.; Decesari, S.; Cavalli, F.; Emblico, L.; Fuzzi, S.; Vestin, A.; Rissler, J.; Swietlicki, E.; Frank, G.; Atmos. Chem. Phys.
2005, 5, 3111.
16. Rissler, J.; Vestin, A.; Swietlicki, E.; Fisch, G.; Zhou, J.; Artaxo, P.; Andreae, M.; Atmos. Chem. Phys. 2006, 6, 471.
17. Pivello, V. R.; Coutinho, L. M.; For. Ecol. Manage. 1996, 87, 127. 18. Ratter, J. A.; Ribeiro, J. F.; Bridgewater, S.; Ann. Bot. 1997, 80, 223. 19. Fearnside, P. M.; Clim. Change 2000, 46, 115.
20. Miranda, H. S.; Bustamante, M. M.; Miranda, A. C.; Oliveira, P.; Mar-quis, R. In The Cerrados of Brazil. Ecology and Natural History of a Neotropical Savanna; Oliveira, P. S., Marquis, R. J., eds.; Columbia University Press: New York, 2002, cap. 4.
21. Brannstrom, C.; Jepson, W.; Filippi, A. M.; Redo, D.; Xu, Z. W.; Ganesh, S.; Land Use Policy 2008, 25, 579.
22. Cavalcanti, R.; Joly, C. In The Cerrado of Brazil. Ecology and natural history of a neotropical Savanna; Oliveira, P. S., Marquis, R. J., Eds.; Columbia University Press: New York, 2002, cap. 18.
23. Vourlitis, G. L.; Rocha, H. R.; Ecosystem function in Savannas : measurement and modeling at landscape to global scales, CRC Press: Boca Raton, 2011, cap. 5.
24. Rodrigues, T. R.; Vourlitis, G. L.; Lobo, F. A.; de Oliveira, R. G.; No-gueira, J. S.; J. Geophys. Res.: Biogeosci. 2014, 119, 1.
25. Vourlitis, G. L.; Lobo, F. D.; Lawrence, S.; de Lucena, I. C.; Pinto, O. B.; Dalmagro, H. J.; Eugenia, C.; Ortiz, R.; Nogueira, J. D.; Soil Sci. Soc. Am. J. 2013, 77, 1370.
26. Maenhaut, W.; Francois, F.; Cafmeyer, J. In Applied Research on Air Pollution Using Nuclear-related Analytical Techniques; NAHRES-19, I. R., Ed. Vienna, 1992; Vol. 4 cap. 3.
27. Hopke, P. K.; Xie, Y.; Raunemaa, T.; Biegalski, S.; Landsberger, S.; Maenhaut, W.; Artaxo, P.; Cohen, D.; Aerosol Sci. Technol. 1997, 27, 726.
28. Arana, A.; Artaxo, P.; Quim. Nova 2014, 37, 268.
29. Grantz, D. A.; Garner, J. H. B.; Johnson, D. W.; Environ. Int. 2003, 29, 213.
30. Palácios, R. S.; Sallo, F. S.; Nogueira, J. S.; Environ. Ecol. Res. 2016, 4, 99.
31. Marcazzan, G. M.; Vaccaro, S.; Valli, G.; Vecchi, R.; Atmos. Environ.
2001, 35, 4639.
32. Braga, C. F.; Teixeira, E. C.; Meira, L.; Wiegand, F.; Yoneama, M. L.; Dias, J. F.; Atmos. Environ. 2005, 39, 1801.
33. Artaxo, P.; Maenhaut, W.; Storms, H.; Van Grieken, R.; J. Geophys. Res.: Atmos. 1990, 95, 16971.