Brazilian Journal of Physics, vol. 39, no. 2A, August, 2009 439
q
-exponential distribution in time correlation function of water hydrogen bonds
M. G. Campo, G. L. Ferri, G. B. Roston Departamento de F´ısica, Universidad Nacional de la Pampa
Uruguay 151,(6300) Santa Rosa, La Pampa, Argentina (Received on 23 December, 2008)
In a series of molecular dynamics simulations we analyzed structural and dynamics properties of water at dif-ferent temperatures (213 K to 360 K), using the Simple Point Charge-Extended (SPC/E) water. We detected a q-exponential behavior in the history-dependent bond correlation function of hydrogen bonds. We found thatq increases withT−1below approximately 300 K and is correlated to the increase of the tetrahedral structure of water and the subdiffusive motion of the molecules.
Keywords: Water hydrogen bonds,q-statistics, Cage effect
1. INTRODUCTION
Water physical properties have been investigated in far greater details, because water is one of the most ubiquitous substances on Earth and most life processes are related with their properties [1–3]. In particular, structural and dynamic properties of the hydrogen bonds have been investigated us-ing different experimental and theoretical techniques, never-theless several issues remain unsolved. X-Ray diffraction, neutron diffraction and proton magnetic shielding tensor mea-surements can be related to the oxygen-oxygen radial distri-bution, hydrogen bonds geometry of water and other struc-tural properties [4–6].
A number of experimental and simulation techniques were used to study the elemental dynamics process of rupturing and forming of hydrogen bonds in water, characterized by an average bond lifetimeτHBand caused by diffusion and libra-tional motions of water molecules on a very fast time scale [7–13]. In molecular dynamics (MD), a “history-dependent” bond correlation functionP(t)is used to obtainτHB[14, 15].
P(t)represents the probability that an hydrogen bond formed at a timet=0 remained continuously unbroken and will be broken at timet.
τHB=
∞ Z
0
tP(t)dt (1)
Both MD simulations and experimental data for depolar-izated light scattering show an Arrhenious behavior ofτHB, whereτHB∝exp(−E∗/RT)andE∗is an activation energy [13–15].E∗can be interpreted as the energy required to break a hydrogen bond (≈10 KJ/mol). However, the functional be-havior of P(t)has not been clearly established to date. In previous works it was found thatP(t)not to verify either an exponential or a power law behavior in the liquid and super-cooled region of water, regardless of the hydrogen bond defi-nition used [14, 15].
In other works the dynamics of liquid and supercooled wa-ter was studied by analyzing the behavior of the mean-square displacement time series (M(t))
M(t) =h[r(t)−r(0)]2i (2) where r(t) is the position of de oxygen atoms of water at timet, r(0)is their initial position and the brackets hi de-note ensemble average. At room temperature the motion of
water molecules at short times is ballistic, whereM(t)∝tα andα≈2 for pure ballistic motion. At later times the water molecules move diffusively (α≈1 according to Einstein rela-tion) and the diffusion coefficientDcan be calculated. How-ever, a plateau emerges inM(t)(0<α<1) at intermediate times in the supercooled region of water (T.273 K) where the movement of the water molecules is called subdiffusive [16, 17]. This phenomenon is attributed to acagingbehavior of water, in which a water molecule is temporarily trapped by its neighbors and then moves in short burst due to nearby cooperative motion.
The diffusion is associated with a non-Gaussian statistics, when the Einstein relation is not satisfied [18–20]. In par-ticular, thecagingbehavior of water is studied by Mazza et. al [17] calculating the non-Gaussian parameterα2(∆t)of the
displacement of water molecules.
Constantino Tsallis and collaborators introduced the q -exponential probability distribution [21]. This can be de-fined through their ”complementary” distribution functions, also called ”survival ” functions:
Pq,κ(X>x) =
1−(1−q)x
κ
1/(1−q)
(3)
Tsallis et al. proposed these distributions to handle statistical-mechanical systems with long-range interactions, necessitating a non-extensive generalization of the ordinary Gibbs-Shannon entropy. Following Jaynes’s procedure [22] of maximizing an entropy subject to constraints on expecta-tion values, they got theq-exponential ditributions, in wich κenforces the constrains, andqmeasures the departure from extensivity, Boltzmann-Gibbs statistics being recovered asq
→1. Sometimes, aq-exponential behavior of dynamic vari-ables has been observed in cases of particles with a subdi-fussive behavior [18, 23, 24]. However, this last behavior has not been considered in water dynamic variables of molecular dynamics simulations.
440 M. G. Campo et al.
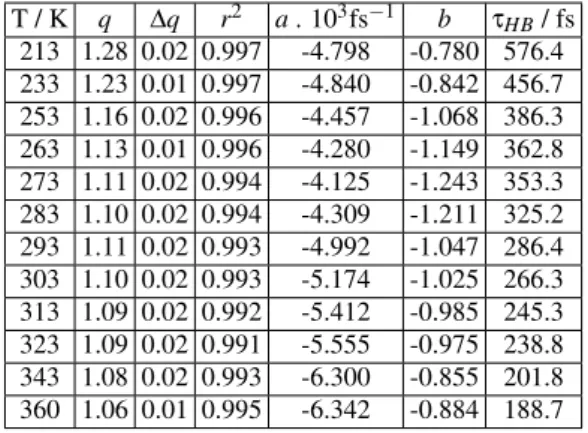
TABLE I: Fitting parameters of the bond correlation function corre-sponding to the different simulated systems.
T / K q ∆q r2 a. 103fs−1 b τHB/ fs
213 1.28 0.02 0.997 -4.798 -0.780 576.4 233 1.23 0.01 0.997 -4.840 -0.842 456.7 253 1.16 0.02 0.996 -4.457 -1.068 386.3 263 1.13 0.01 0.996 -4.280 -1.149 362.8 273 1.11 0.02 0.994 -4.125 -1.243 353.3 283 1.10 0.02 0.994 -4.309 -1.211 325.2 293 1.11 0.02 0.993 -4.992 -1.047 286.4 303 1.10 0.02 0.993 -5.174 -1.025 266.3 313 1.09 0.02 0.992 -5.412 -0.985 245.3 323 1.09 0.02 0.991 -5.555 -0.975 238.8 343 1.08 0.02 0.993 -6.300 -0.855 201.8 360 1.06 0.01 0.995 -6.342 -0.884 188.7
2. THEORY AND METHOD
We performed MD simulations of the SPC/E model of wa-ter using the GROMACS package [25, 26]. This wawa-ter model assumed a rigid geometry of the molecules, with an O–H dis-tance of 0.1 nm and a H–O–H angle of 109.47◦. The hydro-gen atom charge isqH=0.4238eand the oxygen atom charge is−2qH. The parameters of the Lennard-Jones interactions between the oxygen atoms were those of the AMBER-99φ force field [27].
FIG. 1: Fitting ofP(t)of the systems to 283 ()and 323 K (▽). The lines correspond to the calculatedP(t).
We carried out MD simulations with a constant number of water molecules (1158), in which we used the Berendsen’s thermostat to apply a thermal and a hydrostatic bath to the system, obtaining isobaric-isothermal ensembles at 1 atm of pressure [28]. The values of the systems’ temperatures were 360, 343, 323, 313, 303, 293, 283, 273, 263, 253, 233 and 213 K.
We assigned the velocities of the molecules according to Boltzmann’s distribution in the system at 360 K. The equili-bration method was similar for all systems: initially, we made a 200 steps of energy minimization, continuing with an
equi-libration run of∼1 ns using the constant potential energy as stability criterion. Then, we calculated the trajectory for an additional 3 ns. The preceding higher temperature liquid con-figuration was used as the starting point for each successive simulation. The values of the densities were according to the bibliography [16, 29, 30]. The simulation time step was 2 fs and the trajectories were collected every 10 fs for all sim-ulations. The sampling time is shorter than the typical time during which a hydrogen bond can be destroyed by libration movements.
0.0 0.5 1.0 1.5 2.0 2.5
-12 -10 -8 -6 -4 -2 0
323 K
283 K
l
o
g
q
(
P
(
t
)
)
t / ps
2.5 3.0 3.5 4.0 4.5 5.0
1.0 1.1 1.2 1.3
1/T /10 -3
K -1 q
FIG. 2: Non-extensivity parametersqvalues as a function of 1/T. The possible significance of the change of q behavior withT is dis-cussed in the text.
We used a geometric definition of hydrogen bond [10] with a maximum distance between their oxygen atoms of 3.5 ˚Aand 145◦as the minimum angle formed by the atoms Odonor–H– Oacceptor. In order to obtain the hydrogen bonds distribution function, in each simulation, we calculated a histogram of the quantity of hydrogen bonds for each analyzed molecule and then normalized it with the number of trajectories and the number of water molecules in the system. Then, we obtained f(n)withn=0,1, ...,5, being f(n)the probability of occur-rence ofnhydrogen bonds.
The bond correlation functionP(t)was obtained from sim-ulations by building a histogram of the hydrogen bonds’ life-times for each configuration. Then, we analyzed ifP(t) fol-lows a Tsallis distribution of the form
expq(t) = [1+ (1−q)t]
1/(1−q)
(4)
beingtthe hydrogen bonds lifetime andqthe nonextensivity parameter. In the limit whenq→1, expq(t)→exp(t).
The non-Gaussian behavior of the displacement of water molecules was studied calculating the time t∗, the time at which the non-Gaussian parameterα2(t)reaches a maximum.
The non-Gaussian parameter is
α2(t) =
3r4(t)
Brazilian Journal of Physics, vol. 39, no. 2A, August, 2009 441
0.8 1.0 1.2
10 -1 10
0
T MD
/T /K -1
p
s
210 240 270 300 330 360
0 10 20 30 40 50 60
O
c
c
u
r
r
e
n
c
e
p
e
r
c
e
n
t
a
g
e
o
f
H
B
1/ T / 10 -3
K -1 270 K
O
c
c
u
r
r
e
n
c
e
p
e
r
c
e
n
t
a
g
e
o
f
H
B
0 HB 1 HB 2 HB 3 HB 4 HB 5 HB
T / K
320 K
3.0 3.5 4.0 4.5
0 0 0 0 0 0
(a)
(b)
4 HB 2 HB 1 HB 300 K
20 30 40 50
1.0 1.1 1.2 1.3
(c)
Occurrence percentage of HB q
273 K FIG. 3: Average bond lifetimeτHBfrom Montrose et al.
depolar-izated light scattering experiments [13] () and from our simulation (). To facilitate comparison of the results, we scaled the tempera-ture of our simulation byTMDSPC/E =245 K, and the temperature of the experimental data byTH2O
MD =277 K (TMD: Temperature at which
the water density displays a maximum).
where
r4(t) and
r2(t)
are the fourth and second moments of the displacement distribution, respectively.α2(t)is known
to be zero for a Gaussian distribution [17, 31].
3. RESULTS AND DISCUSSION
To study the possibleq-exponential behavior of the bond correlation function we followed this procedure: We assigned successive values toq( 1<q.1.3, with a step of 0.01) and made a linear fitting1of logqP(t), choosing theqvalue with the highest correlation coefficientr2. Below the 130 fs the be-havior ofP(t)is strongly influenced by the libration of atoms. Above 2.5 ps the statistics is poor, because of the unlikely fact that two water molecules remain bonded by a hydrogen bond at this time. Hence, we fitted all theP(t)functions in the interval from 130 fs to 2500 fs, finding thatP(t)can be acceptably fitted with aq-exponential and may be written as follows
P(t) =P0expq(at+b) =P0[1+ (1−q)(at+b)]
1 1−q (6)
whereP0,aandbare constants. The values ofqand others
parameters of the fitting for different temperatures are indi-cated in Table I. Fig. 1 shows, as an example, theP(t)fitting of the systems at 283 and 323 K.
Fig. 2 shows thatq∝T−1for temperatures below∼300 K, whereas this parameter is∼1 for temperatures above this value. This fact indicates that a clear non-exponential behav-ior ofP(t)occurs in the region below approximately 300 K.
1log
q(x) =1−x 1−q
1−q
FIG. 4: (a) Hydrogen bonds distribution functions for n=0 to n=5 versusT. (b) Hydrogen bonds distribution functions for n=1,2 and 4 versusT−1. (c)qversus probability of occurrence of four hydrogen bonds.
Theqvalues higher than one indicate the increase of the prob-ability that two molecules remain bonded much longer.
Although the average bond lifetimes τHB obtained using Eq. 1 and 6 do not coincide with those of experimental data from polarizated light scattering experiments (see Fig. 3), both curves can be fitted by an Arrhenius behavior (τHB∝ exp(−E∗/RT)). This fact was observed in previous works [14] [15].
442 M. G. Campo et al.
1 10 100
10 -3 10
-2 10
-1 10
0
M
(
t
)
/
n
m
2
t / ps
2.5 3.0 3.5 4.0 4.5 5.0
1 10 100 t
*
1/T 10 -3
K -1 (a)
1 10
1 1.1 1.2 1.3 1.4
(c) (b) q
t *
/ ps
20 30 40 50
0.4 0.8 1.2
t* / ps
f
(
4
H
B
)
FIG. 5: Mean square displacement of water in the systems at 213 K (solid line), 273 K (dashed line) and 360 K (dotted line).
probability (f(4)) that is higher than f(3)and f(2), a sec-ond region between ∼270 and ∼320 K, in which f(3)> f(4)>f(2)and finally, a third region above∼320 K in which f(3)>f(2)>f(4). In the lower temperature regime almost 50 % of water molecules have four hydrogen bonds, this per-centage decreases when the temperature increases, reaching 20 % whenT= 360 K. In Fig. 4(b) we can observe the oc-currence of a reciprocal relation between f(2),f(1)and f(4) and the temperature. These results coincide only qualitatively with the ones obtained by Sutmann and Vallauri [32]. Ac-cording to the water model and the hydrogen bond definition used, amongst other things, the results from different simula-tions may quantitatively differ.
To study the correlation between the structural transition and the change of q we analyzed the behavior of q versus f(4)(see Fig. 4 (c)). We can observe that for temperatures below 300 K there is a linear correlation between both vari-ables. In other words, the produced structural change below approximately 320 K causes the change in the statistical be-havior ofP(t)and, as a consequence, a significative increase of the probability of two water molecules be bonded much longer.
Fig. 5 shows the mean square displacements for the sys-tems at 213, 273 and 360 K. M(t) shows some evidence of the caging behavior for water at temperatures below 300 K, where we can observe the appearance of an intermediate plateau at times between 0.1 and 100 ps that indicates a subd-iffusive motion of the water. At longer times, there is a recov-ery of diffusive motion. We can observe from Fig. 6 (a) that t∗increases with the decrease ofT, according to the results obtained by Mazza et al. [17]. Clearly,t∗∼T−1at tempera-tures below 300 K. This fact is attributable to the increase of the subdiffusive motion of the water.
Fig. 6 (b) shows thatqandt∗are correlated when the tem-perature drops below 300 K, which is an expected result be-cause both parameters have a similar behavior with this vari-able. These changes inq andt∗ are produced by a modifi-cation in the water structure when f(4)outnumbers f(2)at
FIG. 6: (a) time whenα2(t)reaches a maximumt∗ vs. 1/T. (b)
Non-extensivity parameterqvs.t∗. (c) f(4)−14 vst∗.
approximately 320 K, and a structure in which prevails three and four hydrogen bonds begins to be the most frequent one in the water.
Moreover, in Fig. 6 (c) we can see the correlation between t∗ and f(4)for values corresponding to the systems below 300 K, in which it is observed thatt∗∼f(4)−14.
Brazilian Journal of Physics, vol. 39, no. 2A, August, 2009 443
low temperatures and the dynamics of the hydrogen bonds that changes from an exponential to a non-exponential distri-bution.
4. CONCLUSIONS
We have shown that the temporal correlation function of hydrogen bonds P(t) has a q-exponential behavior. The nonextensivity parameterq takes values above 1 below ap-proximately 300 K. This increase ofqindicates the increase of the probability that two molecules remain bonded during a long time t. The transition ofP(t)from an exponential to
aq-exponential behavior occurs in parallel with a structural modification in water, where the probability of occurrence of four hydrogen bonds outnumbers the one of two hydrogen bonds. The increase ofqis also correlated with the increase of the Non-Gaussian behavior of water displacement. This fact is associated which the increase oft∗, the time at which the Non-Gaussian parameterα2(∆t)reaches a maximum.
Acknowledgment
M.G. Campo, G.L. Ferri and G.B.Roston are grateful for the financial support by PICTO UNLPAM 2005 30807 and the Facultad de Ciencias Exactas de la UNLPam.
[1] D. Eisenberg and W. Kauzmann, The Structure and Properties of Water (Clarendon Press, Oxford, 1969).
[2] F. H. Stillinger, Science209, 451 (1980).
[3] O. Mishima and H. E. Stanley, Nature (London) 396, 329 (1998).
[4] A. H. Narten, M. D. Danford and H. A. Levy, Faraday Discuss.,
43, 97 (1967).
[5] A.K. Soper, F. Bruni and M. A. Ricci, J. Chem. Phys.106, 247 (1997).
[6] K. Modig, B. G. Pfrommer and B. Halle, Phys. Rev. Lett.,
90(7), 075502 (2003).
[7] C.A. Angell and V. Rodgers, J. Chem. Phys.80, 6245 (1984). [8] J.D. Cruzan, L.B. Braly, K. Liu, M.G. Brown, J.G. Loeser and
R.J. Saykally, Science271, 59 (1996).
[9] S. Woutersen, U. Emmerichs and H. Bakker, Science278, 658 (1997).
[10] A. Luzar and D. Chandler, Phys. Rev. Lett.76, 928 (1996). [11] A. Luzar, J. Chem. Phys.113, 10663 (2000).
[12] F. Mallamace, M. Broccio, C. Corsaro, A. Faraone, U. Wandr-lingh, L. Liu, C. Mou, and S.H. Chen, J. Chem. Phys.124, 124 (2006).
[13] C.J. Montrose, J.A. B´ucaro, J. Marshall-Coakley and T.A. Litovitz, J. Chem. Phys.60, 5025 (1974).
[14] F.W. Starr, J.K. Nielsen, and H.E. Stanley, Phys. Rev. Lett.82, 2294 (1999).
[15] F.W. Starr, J.K. Nielsen, and H.E. Stanley, Phys. Rev. E.62, 579 (2000).
[16] S. Chatterjee, P.G. Debenedetti, F.H. Stillinger and R.M. Lynden-bell, J. Chem. Phys.128, 124511 (2008).
[17] M.G. Mazza, N. Giovambattista, H.E. Stanley and F.W. Starr, Phys. Rev. E76, 031203 (2007).
[18] B. Liu and J. Goree, Phys. Rev. Lett.100, 055003 (2008). [19] T. H. Solomon, E. R. Weeks, and H. L. Swinney, Phys. Rev.
Lett.71, 3975 (1993).
[20] S. Ratynskaia et al., Phys. Rev. Lett.96, 105010 (2006). [21] C. Tsallis, J. of Statistical Phys.52,479 (1988).
[22] E. T. Jaynes, Essays on Probability, Statistics, and Statistical Physics (Reidel, London, 1983).
[23] C. Tsallis et al., Phys. Rev. Lett.75, 3589 (1995). [24] C. Tsallis, Brazilian J. of Phys.,29(1), (1999).
[25] H.J.C.Berendsen, J.R. Grigera, T.P. Straatsma, J. Phys.Chem.
91, 6269 (1987).
[26] H.J.C. Berendsen, D. van der Spoel and R.V. Drunen, Comp. Phys. Comm.91, 43 (1995).
[27] E.J. Sorin and V.S. Pande, Biophys. J.88(4), 2472 (2005). [28] H.J.C. Berendsen, J. Postma, W. van Gusteren, A. Di Nola and
J. Haak, J. Chem. Phys.81, 3684 (1984).
[29] L.A. B´aez and P. Clancy, J. Chem. Phys.101(11), 9837 (1994). [30] B. Taras and A.D.J. Haymet, Molecular Simulation30, 131
(2003).
[31] A. Raman, Phys. Rev.136, 405 (1964).
![FIG. 3: Average bond lifetime τ HB from Montrose et al. depolar- depolar-izated light scattering experiments [13] () and from our simulation ()](https://thumb-eu.123doks.com/thumbv2/123dok_br/18983284.457871/3.892.467.814.77.773/average-lifetime-montrose-depolar-depolar-scattering-experiments-simulation.webp)

