Article
Printed in Brazil - ©2016 Sociedade Brasileira de Química0103 - 5053 $6.00+0.00
*e-mail: [email protected]
Distribution of Xanthene Dyes in DPPC Vesicles: Rationally Accounting for Drug
Partitioning Using a Membrane Model
Italo R. Calori,*,a Diogo S. Pellosi,b Douglas Vanzin,b Gabriel B. Cesar,b Paulo C. S. Pereira,b Mario J. Politi,c Noboru Hiokab and Wilker Caetanob
aLaboratório de Fotobiologia e Fotomedicina, Departamento de Química, Faculdade de Filosofia, Ciências e
Letras de Ribeirão Preto, Universidade de São Paulo, 14040-901 Ribeirão Preto-SP, Brazil
bNúcleo de Pesquisa em Sistemas Fotodinâmicos, Departamento de Química, Universidade Estadual
de Maringá, 87020-900 Maringá-PR, Brazil
cLaboratório de Cinética Rápida e Fototermia, Departamento de Bioquímica, Universidade de São
Paulo, 05513-970 São Paulo-SP, Brazil
The correct selection of a dye that has effective action as a photosensitizer is a primary concern for successful therapeutic outcomes. The effectiveness of the photodynamic agent is related to both the targeting of cell membranes and the photochemical yield of the chosen dye. The distributions of xanthene derivatives Eosin Y, Erythrosin B, and Rose Bengal B in vesicles of 1,2-dipalmitoyl-sn-glycero-3-phosphocholine (DPPC) in both liquid-crystalline and gel phases
were investigated by fluorescence spectroscopy. Binding constants, fluorescence anisotropy, fluorescence quenching, fluorescence quantum yield, and fluorescence resonance energy transfer at physiological pH conditions were determined. To Erythrosin B and Eosin Y, the iodide quenching rate constant was shown to involve a sphere of action mechanism driven by a specific interaction between Erythrosin B and Eosin Y molecules and the choline head-group of the phospholipid; in contrast, Rose Bengal B was located deep in the membrane and this mechanism was not present. The dyes can be ordered by their penetration depth in the membrane, and this order was found to be Eosin Y < Erythrosin B < Rose Bengal B. These results demonstrate a rational approach for the screening of more active agents for photodynamic therapy based on the affinity between the xanthene derivatives and DPPC vesicles.
Keywords: xanthene dye, DPPC liposome, membrane interface, photodynamic activity
Introduction
Biological membranes are usually the primary frontier that delimit the cell contents from their surroundings. The lipid bilayer controls drug entrance and modulates its actions.1 In fact, the interaction of drugs with biological membranes is an important parameter that affects therapeutic outcomes. This is particularly true for photo-activated therapies such as photodynamic therapy (PDT) and the photodynamic inactivation of microorganisms.2 Upon irradiation, a photosensitizer drug generates singlet oxygen (1O
2), which is the main cytotoxic species that attacks biological substrates, causing oxidative stress and ultimately death of the targeted cells.3,4 However, the lifetime of singlet oxygen inside cells is very short (about
0.2 µs) because the excited oxygen is highly reactive with subcellular substrates. Thus, rapid reactivity and a short lifetime limit the distribution of singlet oxygen in cells. Consequently, the effect of photodynamic treatment is localized at the point of 1O
2 generation, a region that is approximately 10 nm in diameter (i.e., compatible with the cell membrane width).5,6 Due to this limitation, several photodynamic drugs act directly at cell or sub-cellular membrane level. Thus, understanding the location of these drugs and their interactions with the cell membrane have become rather important parameters for the targeted design of drugs for photo-activated therapies.7,8
in the range of 20 nm to several micrometers. These systems have an interfacial physico-chemical microenvironment that mimics the biological membranes.12,13 Moreover, lipid vesicles are also important as drug delivery systems for photosensitizing agents. Lipid vesicles can solubilize both water-soluble and lipid-soluble drugs, and the drug location within the lipid vesicle depends on factors such as its partition coefficient, the nature of the lipid head group, surface charge, binding strength, drug molecular geometry, and the fluidity of the lipid bilayer.13,14
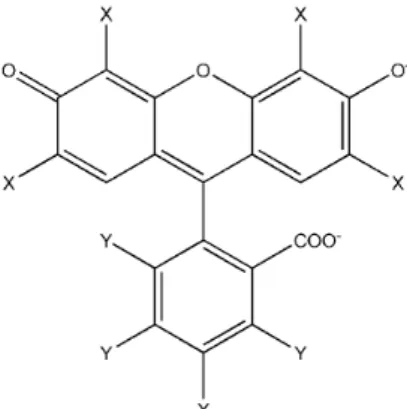
The halogenated xanthene dyes (XD) Eosin Y (EOS), Erythrosin B (ERY), and Rose Bengal B (RBB) (Figure 1) are a class of dyes with several biological applications; they can be used as contrast dyes and as fluorescent probes.15 These compounds have high light absorption coefficients in the PDT region (red to green). Also, they have high quantum yields for singlet oxygen generation, making them as potential photosensitizers for photo-activated therapies.8 The photophysical properties of these compounds have also been evaluated in lipid vesicles at various concentrations and temperature conditions.16,17 Unfortunately, fundamental studies concerning the location of the dye in model membrane, and their relation to the photodynamic activity of XD are still scarce, and further investigation is required to plan rational therapeutic applications. Therefore, the focus of the present work is the determination of the degree of binding of each dye: EOS, ERY, and RBB, and their relative locations and membrane distributions in 1,2-dipalmitoyl-sn -glycero-3-phosphocholine vesicles (DPPC vesicles) to understand how these properties affect the photodynamic action of the dyes.
Experimental
Materials and instrumentation
Eosin Y (EOS) (Reagen), Erythrosin B (ERY) (Vetec), Rose Bengal B (RBB) (Nuclear),
1,6-diphenyl-1,3,5-hexatriene (DPH) (Molecular Probes), and the phospholipid 1,2-dipalmitoyl-sn-glycero-3-phosphocholine (DPPC) (Avanti Polar Lipids) were used without further purification. To prepare the DPPC vesicles, an Avanti Mini-Extruder and 0.1 µm pore Whatman Nuclepore track-etched polycarbonate membranes were used. UV-Vis (Beckman Coulter DU 800) spectra measurements were made between 400 and 800 nm. Fluorescence (Cary-Eclipse) measurements were performed using excitation wavelengths of 480, 495, and 500 nm for EOS, ERY, and RBB, respectively. UV-Vis and fluorescence measurements were made using a quartz cell with a 1 cm path length. UV-Vis time-resolved fluorescence measurement data were obtained using a FL920 lifetime spectrometer (Edinburgh Instruments, UK), operating in the time-correlated single photon counting (TCSPC) mode. Data were analyzed using the manufacturer’s software. Data fitting used the reconvolution method of the instrument response function (IRF) and the best-fits were based on the minimal
χ2 values. Experiments were conducted at 30.0 and 50.0 °C, which are below and above the liquid-crystalline to gel phase transition temperature of DPPC (42.0 °C),18 respectively. All experiments were performed in aqueous solution at pH 7.25. The pH was controlled by Mcllvaine buffer ([Na2HPO4] = [citric acid] = 7.5 × 10⁻³ mol L-1) (monitored by a digital pH Meter Model 240, Meter Lab®) and constant ionic strength (I) set equal to 0.1 mol L-1 by NaCl addition. At this pH, the xanthene dyes are in the dianionic protolytic form (pKa2, more basic protolytic group, of 3.80, 3.79, and 3.94 for EOS, ERY, and RBB, respectively),19 as shown in Figure 1.
Sample preparation
DPPC vesicles were prepared as follows. The phospholipid DPPC was dissolved in chloroform in a round-bottomed glass tube and dried with a stream of nitrogen, forming a thin film on the wall. The sample was left in a desiccator under vacuum overnight to remove residual solvent. The film was then re-suspended in Mcllvaine buffer at 50.0 °C, sonicated in an ultrasonic bath (Thornton model T 1440), and then extruded 13 times. After extrusion, the hydrodynamic diameter of the vesicles was measured by dynamic light scattering using a Micromeritics NanoPlus-3 to obtain baseline values.
For dye-containing samples, an aliquot of previously standardized dye stock (XD in dimethyl sulfoxide, 0.5% (v/v) in final DPPC vesicle suspension) was added to the DPPC vesicles suspension and stirred magnetically in the dark at a controlled temperature (T = 30.0 °C) for 24 hours to enable the system to reach the equilibrium. Before the experiments, the DPPC vesicles size and dye spectra were Figure 1. Structure of the xanthene dyes under investigation: Eosin Y
measured to obtain baseline values. The dyes and DPPC vesicles concentration were kept equal 5.0 × 10⁻⁷ and 7.5 × 10⁻⁴ mol L-1 in all experiments unless when cited.
Binding constants
The evaluation of the binding constant (Kb) of the dyes in the DPPC vesicles were made by dye fluorescence titrimetry. Aliquots of DPPC vesicles suspension in buffer solution ([DPPC vesicles]stock = 6.8 × 10⁻³ mol L-1, without dye) were added to an aqueous, buffered solution of the dye with magnetic agitation and, after an equilibration time, the fluorescence spectra and resonance light scattering (RLS) signals were measured. Fluorescence data were fitted using equation 1:20
(1)
where F is the fluorescence intensity, Fb is the fluorescence of the XD bound to the DPPC vesicles, F0 is the fluorescence of the dye in the absence of DPPC vesicles, [S] is the phospholipid (DPPC) concentration, N is the maximum number of dye per DPPC lipid in vesicles, and C is the concentration of free (not aggregated) DPPC. The fit was poorer compared to other equations which do not consider the C term. The C values used here were 0.46 × 10⁻⁹ mol L-1 for all fits, as described by Avanti® Polar Lipids, inc. Therefore, knowing the values of Fb and F0, the intermediate experimental values F (as function of [S]) can be inserted into equation 1, yielding Kb.
Fluorescence anisotropy
The fluorescence anisotropy (r) was monitored concurrently with the binding constant experiment. Both r and the correction factor, G, values were calculated automatically with the Eclipse ADL Program Selector software, as shown in equation 2:
(2)
where G = IHV/IHH (equation 3). G is the instrumental correction factor for the ratio of polarized light.21
Molar volume, polarizability, and dipole moment of the dyes
The Gaussian 09 package was used to estimate molar volume, isotropic polarizability, and dipole moment.22
Structure optimization of the dianionic EOS, ERY, and RBB molecules was performed with the B3LYP hybrid functional and DGDZVP basis set. The IEFPCM solvent polarizable continuum model was used to model the solvent dielectric. Frequency calculations were used to confirm the nature of the stationary point. The isotropic polarizability setting using water as the solvent was at 298.15 K, which was obtained from the frequency calculations at 0.0 hartrees (static calculation), and the molar volume was performed adding the keyword “volume = tight” in the input file, which, by default, uses a Monte Carlo integration method.
Fluorescence quenching
Static and time resolved fluorescence quenching data of the dyes by iodide in aqueous buffer and DPPC vesicle suspension were treated with both equations 4 and 5:
F0/F = 1 + KSV[Q] (4)
τ0/τ = 1 + kqτ0[Q] (5)
where F0 and F are the fluorescence intensities in the absence and in the presence of the quencher, respectively; [Q] is the iodide concentration; τ0 and τ are the fluorescence lifetimes in the absence and presence of quencher, respectively; and kq is the rate constant for the collisional quenching process. For the time-resolved fluorescence decay measurements the samples were excited at 335.6 nm using a pulsed diode LASER (Pico Quant, model EPLED-340) that had a FWHM of 649.8 ps. The emissions were set at 530, 545, and 560 nm for EOS, ER, and RBB, respectively. Dye concentrations were 5.0 × 10⁻⁷ and 1.0 × 10⁻⁵ mol L-1 for the steady state and time resolved experiments, respectively.
Alternatively, a modified Stern-Volmer equation (equation 6) can be used considering the fraction of dye that is accessible to the quencher.23 This condition applies for heterogeneous distribution of fluorophores in a micro-heterogeneous system. In practice, a downward curvature of the Stern-Volmer plot suggests this condition.
(6)
Fluorescence quantum yield
The fluorescence quantum yields (ΦF) of the dyes were obtained in the absence and presence of DPPC and determined with the aid of equation 7. The standard compound used was eosin in an aqueous alkaline solution (ΦF = 0.20, λexc = 493 nm, and pH 9.2).24
(7)
A is the absorbance of each solution; FD and Fstd are the fluorescence spectrum areas of the dye (D) and of the standard (std), respectively; and n is the medium refractive index.
Fluorescence resonance energy transfer
The steady state and time-resolved fluorescence of DPH (4.17 × 10⁻⁶ mol L-1) (donor) in DPPC vesicle suspension were evaluated by addition of aliquots of concentrated stock solutions of the dyes (1.0 × 10⁻⁴ mol L-1 acceptor). The fluorescence quantum yield (ΦF) of DPH in DPPC was measured under the same conditions.
Fluorescence resonance energy transfer (FRET) is a process in which the energy of an excited state, fluorophore (donor), is transferred through long-range dipole-dipole interactions to a ground state species (acceptor). The rate of energy transfer between donor and acceptor, equation 8, is a function of the distance between them.21
(8)
τd is the lifetime of the excited donor in the absence of acceptor, R is the distance between pair donor-acceptor, and R0 is the distance between pair donor and acceptor in which energy transfer efficiency is 50% (Förster distance). The Förster distance and other information are better described in the Supplementary Information section.
Results and Discussion
Under the described experimental conditions, the spectral data correspond to the dianionic dye species. The maximum wavelengths and absorbance coefficients in buffer solution (λmax and εmax) were found to be 517 and 97.1 × 10³, 532 and 96.6 × 10³ and 543 nm and 109.0 × 10³ L mol-1 cm-1 for EOS, ERY,and RBB, respectively.19
To ensure that the DPPC:XD system was at equilibrium, the dye association kinetics in the DPPC vesicles were
monitored for 24 hours (data not shown). After this time no changes in the absorption/fluorescence spectra and DPPC vesicles size were observed, indicating that the system had reached equilibrium. All measurements were made with an incubation time of 24 hours. The absorption and fluorescence spectra of ERY in buffer and DPPC vesicle suspension are illustrated in Figure 2. The absorption and fluorescence spectra of EOS and RBB under the same conditions are shown in Figure S1 (Supplementary Information section).
The spectra of ERY in DPPC are red shifted compared to the measurements made in water. In addition, the spectra of ERY in DPPC show a small increase in absorbance and a more significant increase in the fluorescence signal at 30 °C (Figure 2); the same behavior was observed at 50 °C (data not shown). EOS and RBB behaved similarly in DPPC vesicles (Supplementary Information section, Figure S1), except to EOS at 30 °C that presents a decrease in the fluorescence signal.
Figure 2. (a) Absorption(5.00 × 10⁻⁶ mol L-1); (b) fluorescence emission
(5.00 × 10⁻⁷ mol L-1) spectra of ERY in water (solid line) and DPPC vesicle
(dashed line) suspension (7.5 × 10⁻⁴ mol L-1). pH 7.25, I= 0.10 mol L-1
A small increase in molar absorptivity accompanied by a bathochromic shift occurred for these dyes when they were placed in media less protic than water, such as organic solvents and micelles. These changes occur because of the loss of hydrogen bonding when the dyes are not in protic solvents and, consequently, the HOMO-LUMO (highest occupied molecular orbital-lowest unoccupied molecular orbital) gap becomes smaller.9 Additionally, the higher fluorescence intensities of the dyes observed in DPPC compared to water is probably due to the decrease in the vibrational deactivation route.21
Determination of binding constants, fluorescence anisotropy, and molecular properties
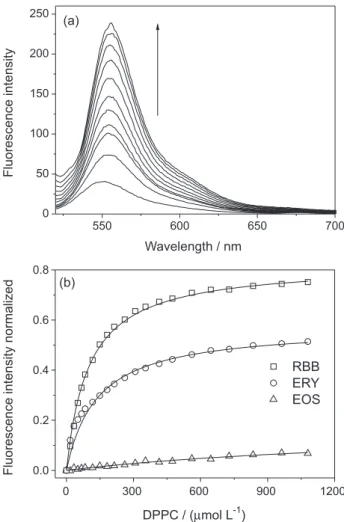
Figure 3a presents the variation in the fluorescence emission spectrum of ERY upon titration with the phospholipids. These data are a good representation of the extension of the XD-DPPC vesicle interactions.
The fluorescence spectrum (λmax.emi = 555 nm) showed high intensity variations on phospholipid addition, followed by a small red shift (around 5 nm); this is evidence for the favorable distribution of the dye into the lipid bilayer microenvironment.8 This variation in profile was also observed for the other studied xanthene dyes both above and below the phospholipid phase transition temperature.
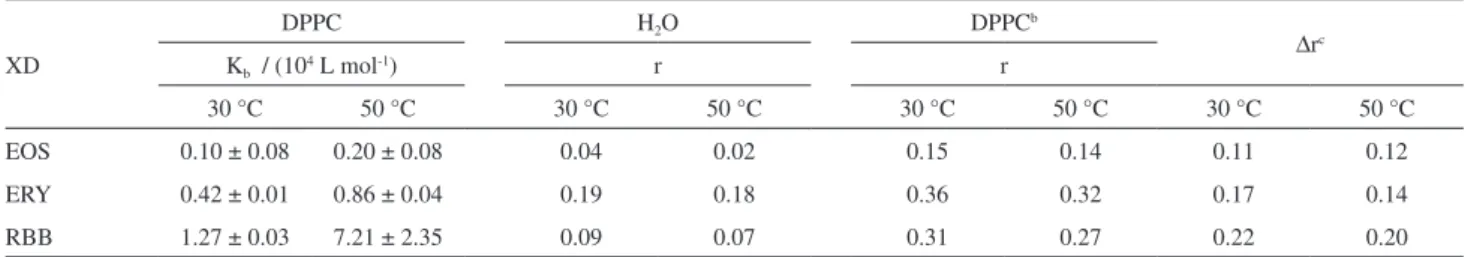
Figure 3b shows that the three dyes interact favorably with the DPPC vesicles, i.e., the fluorescence signals significantly increased in the DPPC vesicles. Binding constants (Kb) using the maximum values of fluorescence at each experimental condition are summarized in Table 1. Notably, the Kb values tendency were not influenced by the chosen excitation wavelength. Furthermore, other equations that do not consider CMC (critical micelle concentration) values, such as double reciprocal, were used and similar Kb values were obtained. However, these equations did not fit the isotherms well, as shown by their low correlation coefficients (data not shown).
The strength of the XD-DPPC vesicle interactions are modulated by the net charge and hydrophobicity of each molecule. Despite their being dianionic water-soluble molecules, the interaction of the XDs with the DPPC vesicles were thermodynamically favorable, as shown by the high binding constants. At higher temperatures, Kb valuesincreased, approximately 2-fold for EOS and ERY and 6-fold for RBB, due the higher membrane fluidity of the DPPC vesicles in the liquid-crystalline phase (50.0 °C) compared to the gel phase (30.0 °C). High binding constants are related to the preferential incorporation of the dyes into lipid bilayer, indicating that the amount of free XDs in the
water phase was insignificant (equilibrium displaced toward XD internalization).20
Another parameter that is related to dye penetration in the lipid palisade is the steady state fluorescence anisotropy (r values, Table 1). In water solutions, the small anisotropy values for EOS and RBB demonstrate that the rotational diffusion rate is substantially faster than the rate of fluorescence emission; this is typical behavior for small fluorophores in low viscosity medium.21 The fluorescence lifetimes for EOS and RBB in water at 30.0 °C were 1.54 and 1.24 ns, respectively. On the other hand, for ERY, the large r value in water is due to its extremely short fluorescence lifetime (0.089 ns).26 Therefore, we investigated the effect of temperature on rvalues. The decrease in r at 50.0 °C compared to 30.0 °C is associated with a reduction in micro-viscosity and an enhancement in the rotational diffusion of the fluorophores Figure 3. (a)Fluorescence emission spectra of ERYa as function of DPPC
at higher temperatures.21 At high DPPC concentrations (to ensure total dye partitioning to lipid bilayer), there was a significant increase in the r values compared to those measured in water at both measured temperatures (Table 1). The greater microviscosity of the DPPC bilayer membrane compared to aqueous media hinders the averaged rotational motion of the dye and increases the fluorescence anisotropy. In addition, the fluorescence anisotropy values for dyes in the DPPC vesicles were lower at 50.0 °C due to higher dynamics and lower order of the lipid environment, above the transition temperature. Overall, ∆r values followed the same order as that of the binding constants to the dyes at both 30 and 50 °C (Table 1).
All fluorescence lifetime decays were mono-exponential (Table S1), which indicates a single population in the excited state. Thus, the observed effects are a reflection of the dye microenvironment and are not associated with two or more different species of the same compound in equilibrium in different micro-phases.
To rationalize the different behavior of these dyes, it is important to understand their molecular properties. As mentioned previously, under the present experimental conditions, the dyes are present in their dianionic form. The results of molecular dynamics calculations are presented in Table 2.
As illustrated by their molecular electrostatic potential maps (MEPs, Figure S2 in the Supplementary Information
section), the doubly negative charge of the dye molecules are spread over the aromatic rings. Moreover, the dipole moments of the three xanthene dyes (Table 2) do not differ greatly from each other. On the other hand, Table 2 shows that both molecular volumes and isotropic polarizabilities follow the order EOS < ERY < RBB, the same order as the Kb values. The same ordering was also observed concerning the dye partition coefficients in water/octan-1-ol mixtures (log (Kp)); these are 0.18, 0.46, and 0.59 for EOS, ERY, and RBB, respectively.8 The iodine atoms of ERY and RBB increase their polarizabilities and, consequently, decrease their hydrophilicities. Larger molecular volumes mean that the charge density over each atom is low, favoring both hydrophobic and van der Waals interactions with the DPPC vesicles. This rationalizes the binding constants of these dyes in DPPC vesicles. Thus, the hydrophobic characteristics and van der Waals forces play key roles in the interactions of XDs with DPPC vesicles. The effect of electrostatic forces is described below.
Fluorescence quantum yields
Fluorescence quantum yield values (ΦF) for the xanthene dyes in DPPC vesicles at 30.0 and 50.0 °C were found to be 0.25 and 0.27 for EOS, 0.09 and 0.11 for ERY, and 0.08 and 0.09 for RBB, respectively. These values do not differ drastically from those in water media, but they show a slight increase in the less polar DPPC microenvironment (all ΦF values are presented in Table S2 in the Supplementary Information section). Previous studies in water and organic solvents show that the singlet excited state (*S1) population does not change significantly between protic and aprotic media, despite the increase in ΦF in organic solvents.26 In other words, the absorption cross-sections for the three dyes are equivalent in these media. Lower fluorescence quantum yields in water can be explained by the influence of hydrogen bonding, which quenches excited states.27 In a more hydrophobic environment, such as DPPC vesicles, these processes are disfavored; consequently, the fluorescence yield increases.17,24 This effect increased for Table 1. Dye/liposome binding constant (Kb) calculated by equation 1 and anisotropy values (r) in water and in DPPC vesicle suspension for xanthene dyesa
XD
DPPC H2O DPPCb
∆rc
Kb / (104 L mol-1) r r
30 °C 50 °C 30 °C 50 °C 30 °C 50 °C 30 °C 50 °C
EOS 0.10 ± 0.08 0.20 ± 0.08 0.04 0.02 0.15 0.14 0.11 0.12
ERY 0.42 ± 0.01 0.86 ± 0.04 0.19 0.18 0.36 0.32 0.17 0.14
RBB 1.27 ± 0.03 7.21 ± 2.35 0.09 0.07 0.31 0.27 0.22 0.20
a[Dye] = 5.0 × 10⁻⁷ mol L-1, pH = 7.25 and I = 0.10 mol L-1; bvalue related to [1,2-dipalmitoyl-sn-glycero-3-phosphocholine-DPPC] = 1.72 × 10⁻³ mol L-1; c∆r = r
DPPC – rH2O; XD: xanthene dyes; EOS: Eosin Y; ERY: Erythrosin B; RBB: Rose Bengal B.
Table 2. Molar volume, isotropic polarizability and total dipole moment of the investigated dyes obtained with B3LYP/DGDZVP method and IEFPCM solvent polarizable continuum model in watera
XD Dipole moment / debye Molar volume / (cm3 mol-1)
Isotropic polarizability /
bohr3
EOS 12.95 297.26 565.3
ERY 13.09 320.81 649.2
RBB 12.76 360.63 733.9
a298.15 K; XD: xanthene dyes; EOS: Eosin Y; ERY: Erythrosin B;
RBB and ERY, indicating that an increased fraction of the dye is partitioned into the membrane for these dyes and an aqueous distribution of EOS; effect supported by the calculated Kb values. Despite the changes, ΦF was still very small for the investigated xanthenes, indicating high singlet oxygen production.17
Fluorescence quenching experiments
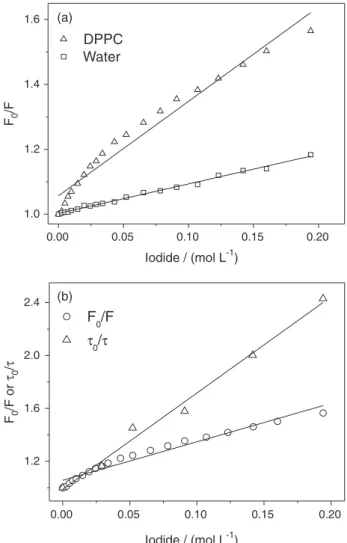
Relatively low penetration in the vesicles palisade makes the iodide ion an effective tool to investigate the location of the xanthene dye in our biomimetic systems.28 The steady-state fluorescence quenching of the dyes by iodide in an aqueous system fitted well to the Stern-Volmer model, equation 4, as demonstrated in Figure 4a for ERY in water and in DPPC at 30.0 °C, and these data are show as a representative plot for the studied system. All other data curves are presented in the Figure S3 in the Supplementary Information section. Whereas the fit to the data of the dye in water is satisfactory, data from the dyes in the DPPC mixtures show a pronounced concave form (Figure 4a and Table 3). For the DPPC suspension, a lack of linearity was observed (cc = 0.985 for EOS, cc = 0.961 for ERY, and cc = 0.354 for RBB at 30.0 °C) and a higher KSV tendency than the values in water for EOS and, in particular, for ERY (illustrated in the Figure 4a) at both 30 and 50 °C. At high iodide concentration (> 0.1 mol L-1, see Figure S3), an upward curvature was observed, suggesting a possible change of membrane properties due the increase in ionic strength of the medium. Furthermore, experiments carried out at different incubation times (12 and 24 hours) produced the same results (data not shown), thus, demonstrating that the observed variations represent the system at equilibrium. Attempts to fit the data of the dyes in DPPC mixtures to static and dynamic processes failed (data not shown). In these cases the plots usually have an upward curvature, the failure to fit these data is indicative of the complexity of the quenching processes in the DPPC vesicle suspension.
Time-resolved measurements resulted in a linear dependence in τ0/τversus [I−] plots for all dyes in DPPC vesicle suspension (Figure 4b and Figure S4 in the Supplementary Information section), confirming the existence of a dynamic quenching process.21 Bimolecular quenching constants (kq) obtained from time-resolved measurements, equation 5, are summarized in Table 3. The kq values are within the range of diffusion controlled processes in both water and DPPC at both measured temperatures, except for ERY in DPPC at 30.0°C. It was also observed that, for EOS and ERY, the kq values were higher in the DPPC mixtures than in water; in contrast, for RBB, the opposite tendency was observed. These
differences are assigned to the more “external” positioning of EOS and ERY in the membranes concerning iodide collision compared to RBB. Accordingly, the partitioning of EOS and ERY in a more aqueous environment leads to more facile access to iodide ions.
Previous 1H NMR (nuclear magnetic resonance) studies have shown the influence of iodine ion on the phospholipid proton signals.29 No differences were observed in the signals of the −CH−groups of the phospholipid aliphatic chains, whereas significant chemical shift changes were observed at choline head-groups (−N+(CH
3)3), showing a significant concentration of I− at the interfacial region of the DPPC vesicles. These results, combined with higher kq values for EOS and ERY (Table 3), suggest that these dyes are preferentially located close to the positive choline group of the phospholipids. In fact, both EOS and ERY have higher negative charge densities than RBB, based on their molar volumes and isotropic polarizabilities (Table 2).
0.00 0.05 0.10 0.15 0.20
1.0 1.2 1.4 1.6
DPPC Water
F
/F0
Iodide / (mol L )-1
Iodide / (mol L )-1 (a)
0.00 0.05 0.10 0.15 0.20
1.2 1.6 2.0 2.4
F0/F
τ
0/τ
F
/F or
/
0
0
τ
τ
(b)
The effect of the closer proximity of iodide and xanthenes to the positive head group is similar to that observed by Pellosi et al.30 in aqueous CTABr micelles. The kq value of ERY in DPPC vesicle suspension at 30.0 °C (Table 3) above the diffusion limit (kq = 1.0 × 10¹⁰ L mol-1 s-1)21 could be due to a static quenching mechanism (probably by a sphere of action, see below). This effect arises due to the proximity of iodide and ERY, which are both located close to the positively charged choline. At 50.0 °C the high temperature and membrane fluidity can “break” these interactions, leading to the diffusion limiting values. Moreover, the increase in the fraction of the dye partitioned into the membrane at 50 °C (higher Kb values at 50 °C) could amplify the effect in question.
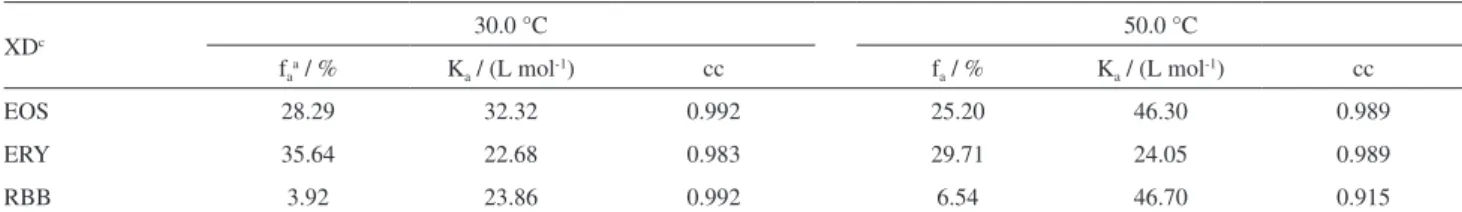
In DPPC vesicles suspension, the dyes are heterogeneously distributed and, probably, just a fraction of the fluorophores is accessible to the quencher, especially at low iodide concentrations, which causes the downward curvature in the Stern-Volmer plot (Figure 4a). Equation 6 allows the calculation of the accessible fraction (fa) of the dyes to the quencher in colloidal systems.31 Quenching data fitted well to the equation (see correlation coefficients in columns 4 and 7 of Table 4). The accessible fraction of dyes to iodide and their quenching constants (Ka) were calculated from the regression intercept and slope lines and are summarized in Table 4.
Except to RBB, the data in Table 4 show a small decrease in fa values with increasing temperature. These results can be related to the displacement of the XD towards
the phospholipid bilayer, and this is in agreement with the results of the XD-DPPC binding experiments, where Kb increases with the temperature (Table 1). The highest values of fa for ERY at both 30 and 50 °C are in accordance with the proposed location of ERY molecules close to the choline group, making it more accessible to collisions with iodide ions, as already discussed. The increase in fa for RBB at 50.0 °C may be due to the increased exposure of the molecules to an aqueous environment due to the higher membrane fluidity. Thus, from the fluorescence intensities (equation 1), anisotropies (equation 2), and quenching studies (equations 4, 5 and 6) the penetration order of the dyes in the DPPC bilayers is EOS < ERY < RBB. EOS and ERY are preferentially located closer to the DPPC vesicle interface due to positive charge of the choline group, and RBB is immersed deeply in the lipid palisade due to its higher polarizability and hydrophobicity.
Fluorescence resonance energy transfer
Another powerful tool used to exploit the relative location of molecules in nano structured particles is fluorescence resonance energy transfer (FRET).32 In this phenomenon, excitation energy is transferred from a fluorophore (donor) to a suitable acceptor, separated by relatively long distances (ca. 10-100 Å), via dipole-dipole interactions.21 In the present study diphenylhexatriene (DPH) was chosen as donor molecule because of its favorable photophysical properties and known location Table 3. Stern-Volmer constants (Ksv) values in water,aandbimolecular quenching constant (kq) of dyesa in water and in DPPC vesicle suspensionb at 30.0
and 50.0 °C, pH = 7.25, I = 0.10 mol L-1
XD
H2O H2O DPPC
Ksvc / (L mol-1) kqd / (109 L mol-1 s-1) kqd / (109 L mol-1 s-1)
30.0 °C 50.0 °C 30.0 °C 50.0 °C 30.0 °C 50.0 °C
EOS 3.96 (0.999)e 5.42 (0.997) 3.01 3.08 4.85 6.95
ERY 0.92 (0.999) 1.06 (0.998) 7.38 7.53 42.06 5.22
RBB 2.80 (0.999) 3.59 (0.999) 2.79 3.15 0.71 0.98
a[Dye] = 5.0 × 10⁻⁷ mol L-1; b[1,2-dipalmitoyl-sn-glycero-3-phosphocholine-DPPC] = 1.5 × 10⁻³ mol L-1; csteady state measurements; dtime resolved data; elinearcorrelation coefficient; XD: xanthene dyes; EOS: Eosin Y; ERY: Erythrosin B; RBB: Rose Bengal B.
Table 4. Quencher accessible fractiona (f
a) and quenching constant (Ka) of xanthene dyes in DPPC vesicle suspensionb
XDc 30.0 °C 50.0 °C
faa / % Ka / (L mol-1) cc fa / % Ka / (L mol-1) cc
EOS 28.29 32.32 0.992 25.20 46.30 0.989
ERY 35.64 22.68 0.983 29.71 24.05 0.989
RBB 3.92 23.86 0.992 6.54 46.70 0.915
a[Iodide]
max = 4.31 × 10⁻² mol L-1; b[DPPC] = 1.5 × 10⁻³ mol L-1; c[Xanthene dyes] = 0.5 × 10⁻⁶ mol L-1; EOS: Eosin Y; ERY: Erythrosin B; RBB: Rose
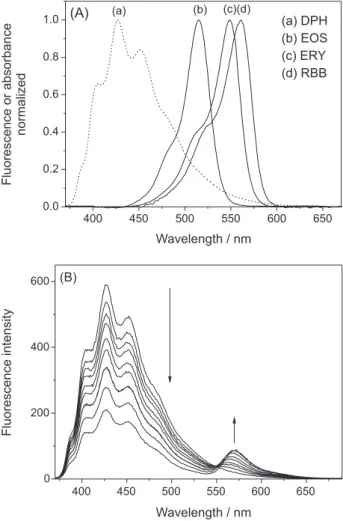
in DPPC membranes.33 In addition, the spectral overlap between DPH and the dyes in DPPC membranes matches the FRET requirements (Figure 5A). Because there are no specific interactions, e.g., electrostatic attraction, between DPH and the xanthene dyes, we assumed that the presence of DPH does not affect the position of the dyes in the DPPC vesicles. The FRET phenomenon was observed by the decrease in the steady state and time-resolved fluorescence emissions of DPH and the concomitant increase in XD fluorescence at between 510 and 650 nm that were observed on keeping the DPH concentration constant and increasing the XD concentration (Figure 5B for both ERY/DPH with steady fluorescence measurements as an example). Notice that the excitation wavelength used (335.6 nm) selectively promotes the S0→ S1 transition of DPH.
There is a broad distribution of donor-acceptor distances in colloidal systems such as micelles and vesicles; however, a donor-acceptor average distance is normally observed with
FRET experiments.32 The average distances are calculated from the values of R0and the observed efficiency of energy transfer. The average distances for DPH and the XDs in DPPC vesicles at 30 °C were 63.1, 54.3, and 44.0 Å for EOS, ERY, and RBB, respectively. On the other hand, the equations used to analyze FRET between DPPC vesicles embedded probes (DPH and XD) should have take into account the fact that the system has a three-dimensional geometry and real values may be different from those obtained. All three dyes showed similar Forster critical distances (R0): 45.6, 45.8, and 43.5 Å for EOS, ERY, and RBB, respectively. R0 is the distance at which 50% of the excitation energy is transferred to the acceptor.21 These similar values are due to R0 being an averaged value. Despite this, the energy transfer efficiency compared to EOS (12.47%) is approximately two- and four-times higher for ERY (26.47%) and RBB (48.28%), respectively. The higher efficiency of the energy transfer between RBB and DPH is indicative of the dye being located deeper inside the membrane than the other dyes. Furthermore, these results agree with previous experiments. Again, the relative order of the degree of xanthene dye exposure out of the membrane is EOS > ERY > RBB for the phospholipids DPPC membrane, demonstrating the hydrophobic forces that modulate the interactions between the XDs and DPPC. Molecular volumes are less important, as indicated by the fact that the larger XD (RBB) has a higher binding constant and greater penetration in the lipid bilayer.
Recently, we have shown that the photodynamic efficiency of these dyes follows the order RBB > ERY > EOS, and this order is the same as the order of dye penetration in the DPPC membrane model.34 Other authors have observed the same tendency in PDIMO applications of xanthene dyes for antibacterial applications.35,36 Thus, the distribution of these dyes that we have proposed strongly supports these results concerning the high membrane penetration of RBB. Our results indicate that the molecular parameters, in particular, hydrophobicity and net charge are essential to control dye location within membranes, and the location of the dye molecules is closely related to their photodynamic effect. Thus, a new generation of xanthene dyes for photodynamic applications must have strong interactions with biological membranes whilst maintaining their favorable photophysical properties. Examples of this “new generation” are the Rose Bengal-acetate (RBAc) derivatives developed by the Dini and co-workers37 and xanthene ester derivatives under evaluation by our research group.38
Conclusions
We have shown the significant interactions between xanthene dyes and DPPC vesicles at temperatures above and Figure 5. (A)DPH normalized fluorescence spectrum (dashed line)
below their phase transition. Dye hydrophobicity, net charge, molecular volume, polarizability, and membrane fluidity are the major factors that modulate these interactions; this is particularly true for RBB, which is located inside lipid bilayers as demonstrated by quenching experiments. The interactions of EOS and ERY with DPPC are modulated by the positive charge of the choline group of the phospholipid. FRET measurements demonstrated that the dye penetration in membranes follows the order RBB > ERY > EOS. The present study shows a logical way to understand target agent localizations in a membrane model and therefore rationalizes the choice of the best candidate for photodynamic action.
Supplementary Information
Supplementary data (electrostatic potential maps and absorption/fluorescence spectra) are available free of charge at http://jbcs.sbq.org.br as PDF file.
Acknowledgments
We are thankful for financial support from the Brazilian Federal Agency for Support and Evaluation of Graduate Education (CAPES), the National Council for Scientific and Technological Development (CNPq), and the State of São Paulo Research Foundation (FAPESP). Also, we are grateful to Prof Antonio Eduardo da Hora Machado for allowing the use of the Gaussian 09 package.
References
1. Dobson, P. D.; Kell, D. B.; Nat. Rev. Drug Discovery 2008, 7,
205.
2. Kim, J.; Santos, O. A.; Park, J. H.; J. Controlled Release 2014, 191, 98.
3. Celli, J. P.; Spring, B. Q.; Rizvi, I.; Evans, C. L.; Samkoe, K. S.; Verma, S.; Pogue, B. W.; Hasan, T.; Chem. Rev. 2010, 110, 2795. 4. Dolmans, D. E. J. G.; Fukumura, D.; Jain, R. K.; Nat. Rev.
Cancer2003, 3, 380.
5. Ormond, A. B.; Freeman, H. S.; Materials2013, 6, 817.
6. Deda, D. K.; Pavani, C.; Carita, E.; Baptista, M. S.; Toma, H. E.; Araki, K.; J. Biomed. Nanotechnol.2013, 9, 1307.
7. Caetano, W.; Haddad, P. S.; Itri, R.; Severino, D.; Vieira, V. C.; Baptista, M. S.; Schroder, A. P.; Marques, C. M.;
Langmuir 2007, 23, 1307.
8. Pellosi, D. S.; Estevao, B. M.; Semensato, J.; Severino, D.; Baptista, M. S.; Politi, M. J.; Hioka, N.; Caetano, W.;
J. Photochem. Photobiol., A2012, 247, 8.
9. Serro, A. P.; Galante, R.; Kozica, A.; Paradiso, P.; da Silva, A. M. P. S.; Luzyanin, K. V.; Fernandes, A. C.; Saramago, B.;
Colloids Surf., B2014, 116, 63.
10. Altgarde, N.; Becher, J.; Moller, S.; Weber, F. E.; Schnabelrauch, M.; Svedhem, S.; J. Colloid Interface Sci. 2013, 390, 258.
11. Eloy, J. O.; de Souza, M. C.; Petrilli, R.; Barcellos, J. P. A.; Lee, R. J.; Marchetti, J. M.; Colloids Surf., B2014, 123, 345. 12. van der Meel, R.; Fens, M. H.; Vader. P.; van Solinge, W. W.;
Eniola-Adefeso, O.; Schiffelers, R. M.; J. Controlled Release 2014, 195, 72.
13. Yavlovich, A.; Singh, A.; Blumenthal, R.; Puri, A.; Biochim. Biophys. Acta, Biomembr.2011, 1808, 117.
14. Liu, A. F.; Yang, L.; Zhang, Z. Y.; Zhang, Z. L.; Xu, D. M.; Dyes Pigm.2013, 99, 472.
15. Shrestha, A.; Hamblin, M. R.; Kishen, A.; Nanomedicine2014,
10, 491.
16. Hugo, E.; Abuin, E.; Lissi, E.; Alarcón, E.; Edwards, A. M.;
J. Lumin.2011, 131, 2468.
17. Chang, C. C.; Yang, Y. T.; Yang, J. C.; Wu, H. D.; Tsai, T.; Dyes Pigm. 2008, 79, 170.
18. Koynova, R.; Caffrey, M.; Biochim. Biophys. Acta, Rev. Biomembr. 1998, 1376, 91.
19. Batistela, V. R.; Pellosi, D. S.; de Souza, F. D.; da Costa, W. F.; Santin, S. M. de O.; de Souza, V. R.; Caetano, W.; de Oliveira, H. P. M.; Scarminio, I. S.; Hioka, N.; Spectrochim. Acta, Part A 2011, 79, 889.
20. Caetano, W.; Tabak, M.; Spectrochim. Acta, Part A1999, 55, 2513.
21. Lakowicz, J. R.; Principles of Fluorescence Spectroscopy, 3rd ed.; Springer: New York, USA, 2006.
22. Frisch, M. J.; Trucks, G. W.; Schlegel, H. B.; Scuseria, G. E.; Robb, M. A.; Cheeseman, J. R.; Scalmani, G.; Barone, V.; Mennucci, B.; Petersson, G. A.; Nakatsuji, H.; Caricato, M.; Li, X.; Hratchian, H. P.; Izmaylov, A. F.; Bloino, J.; Zheng, G.; Sonnenberg, J. L.; Hada, M.; Ehara, M.; Toyota, K.; Fukuda, R.; Hasegawa, J.; Ishida, M.; Nakajima, T.; Honda, Y.; Kitao, O.; Nakai, H.; Vreven, T.; Montgomery Jr., J. A.; Peralta, J. E.; Ogliaro, F.; Bearpark, M.; Heyd, J. J.; Brothers, E.; Kudin, K. N.; Staroverov, V. N.; Kobayashi, R.; Normand, J.; Raghavachari, K.; Rendell, A.; Burant, J. C.; Iyengar, S. S.; Tomasi, J.; Cossi, M.; Rega, N.; Millam, J. M.; Klene, M.; Knox, J. E.; Cross, J. B.; Bakken, V.; Adamo, C.; Jaramillo, J.; Gomperts, R.; Stratmann, R. E.; Yazyev, O.; Austin, A. J.; Cammi, R.; Pomelli, C.; Ochterski, J. W.; Martin, R. L.; Morokuma, K.; Zakrzewski, V. G.; Voth, G. A.; Salvador, P.; Dannenberg, J. J.; Dapprich, S.; Daniels, A. D.; Farkas, Ö.; Foresman, J. B.; Ortiz, J. V.; Cioslowski, J.; Fox, D. J.; Gaussian 09, Revision E.01; Gaussian, Inc.; Wallingford CT, 2009.
23. Lehrer, S. S.; Biochemistry1971, 10, 3254.
24. Fleming, G. R.; Knight, A. W.; Morris, J. M.; Morrison, R. J. S.; Robinson, G. W.; J. Am. Chem. Soc.1977, 99, 4306. 25. Boens, N.; Qin, W. W.; Basaric, N.; Hofkens, J.; Ameloot, M.;
Silva, N. D.; Engelborghs, Y.; Willaert, K.; Sillen, A.; Rumbles, G.; Phillips, D.; Visser, A.; van Hoek, A.; Lakowicz, J. R.; Malak, H.; Gryczynski, I.; Szabo, A. G.; Krajcarski, D. T.; Tamai, N.; Miura, A.; Anal. Chem.2010, 79, 2137.
26. Zhang, X.; Zhang, I.; Liu, L.; Photochem. Photobiol. 2010, 86, 492.
27. Jayme, C. C.; Calori, I. R.; Tedesco, A. C.; Spectrochim. Acta, Part A 2016, 153, 178.
28. Chmyrov, A.; Sandén, T.; Widengren, J.; J. Phys. Chem. B2010,
114, 11282.
29. Jendrasiak, G. L.; Chem. Phys. Lipids1972, 9, 133.
30. Pellosi, D. S.; Estevão, B. M.; Freitas, C. F.; Tsubone, T. M.; Caetano, W.; Hioka, N.; Dyes Pigm.2013, 99, 705.
31. Ricchelli, F.; Jori, G.; Gobbo, S.; Tronchin, M.; Biochim. Biophys. Acta1991, 1065, 42.
32. Aydin, B. M.; Acar, M.; Arik, M.; Onganer, Y.; Dyes Pigm. 2009, 81, 156.
33. Repáková, J.; Capková, P.; Holopainen, J. M.; Vattulainen, I.;
J. Phys. Chem. B2004, 108, 13438.
34. Pellosi, D. S.; Batistela, V. R.; Souza, V. R.; Scarminio, I. S.; Caetano, W.; Hioka, N.; An. Acad. Bras. Cienc.2013, 85, 1267.
35. Rossoni, R. D.; Junqueira, J. C.; Santos, E. L.; Costa, A. C.; Jorge, A. O.; Lasers Med. Sci.2010, 25, 581.
36. Pereira, C. A.; Costa, A. C. B. P.; Carreira, C. M.; Junqueira, J. C.; Jorge, A. O. C.; Lasers Med. Sci.2013, 28, 859.
37. Panzarini, E.; Inguscio, V.; Fimia, G. M.; Dini, L.; PloS One 2014, 9, e105778.
38. Estevão, B. M.; Pellosi, D. S.; de Freitas, C. F.; Vanzin, D.; Franciscato, D. S.; Caetano, W.; Hioka, N.; J. Photochem. Photobiol. A2014, 287, 30.
Submitted: December 8, 2015
Published online: March 17, 2016