Article
J. Braz. Chem. Soc., Vol. 26, No. 4, 649-659, 2015. Printed in Brazil - ©2015 Sociedade Brasileira de Química 0103 - 5053 $6.00+0.00
A
*e-mail: [email protected]
HPLC-DAD and UV-Vis Spectrophotometric Methods for Methotrexate Assay in
Different Biodegradable Microparticles
Alice R. Oliveira, Lilia B. Caland, Edilene G. Oliveira, Eryvaldo S. T. Egito, Matheus F. F. Pedrosa and Arnóbio A. Silva Júnior*
Departamento de Farmácia, Universidade Federal do Rio Grande do Norte, 59072-570 Natal-RN, Brazil
The challenge of the present work concerned the development and validation of high performance liquid chromatography (HPLC) and UV-Vis spectrophotometric methods for quantitation of methotrexate (MTX) loaded on biodegradable microparticles, composed of copolymers with different solubilities such as chitosan and poly (lactic-co-glycolic acid) (PLGA). The linearity of the analytical curves for MTX were > 0.999 (r2) and the limits of detection
(LOD) were 0.014 µg mL-1 and 0.060 µg mL-1 for HPLC and UV-Vis spectrophotometric method,
respectively. In addition, both methods were specific, robust, and accurate with a recovery between 89.5% and 105.5%. The method showed precision with relative standard deviations lower than 3.39% for HPLC and 2.90% for UV-Vis spectrophotometry. Statistical analysis revealed that both methods provide equivalent results, and also can be used for quality control of MTX-loaded in drug delivery systems.
Keywords: HPLC-DAD, UV-Vis spectrophotometry, validation, methotrexate, biodegradable microparticles
Introduction
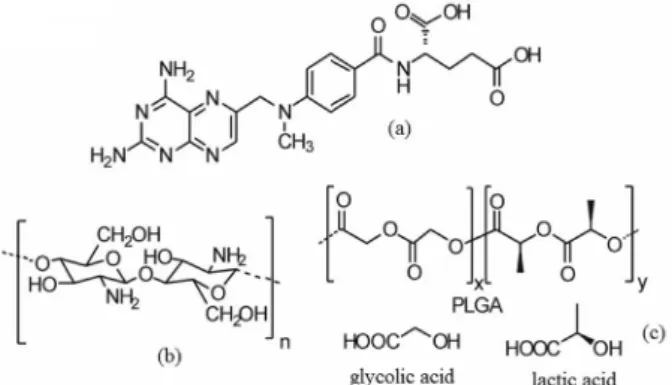
Methotrexate (MTX) (2S)-2-[[4-[(2,4-diaminopteridin-6-yl)methyl-methylamino]benzoyl]amino]pentanedioic acid (Figure 1a) is a well-known anticancer drug used in the chemotherapy of several malignant diseases, such as acute lymphocytic leukemia, osteosarcoma, breast and bladder cancers, and also several lymphomas and carcinomas.1-3 In addition, MTX is an analog of the folic
acid that can be used at lower doses as anti-inflammatory and immunosuppressant drug, mainly for the treatment of psoriasis and steroid-refractory uveitis.4,5 However, some
physicochemical and pharmacokinetic properties limit its therapeutic success. Due to its rapid renal clearance (t1/2 = 1.5-3.5 h), the short time of drug exposure in the
target tissue, high and repeated doses are required for treatment and may cause severe side effects such as bone marrow depression, ulcerative colitis, hepatotoxicity, and nephrotoxicity.6-8 One strategy to minimize the clinical
limitations presented by MTX concerns in the development of drug delivery systems, such as micro and nanoparticles.9,10
In fact, micro and nanoparticles have been used to prolong the
release of different kinds of drugs, including antimicrobial, chemotherapy, and anti-inflammatory agents. 11-15
Polymeric microparticles are solid particles with a diameter range of 1 to 1000 µm, constituted by a polymeric network structured in two dimensional forms. The microcapsules, in which a solid, liquid, or gaseous drugs core is encapsulated into a polymeric barrier, are quite different from microspheres which drugs may be absorbed, dispersed, or chemically bonded in a polymeric matrix.11,12,16,17 Among the plethora of polymers used to
produce microparticles, chitosan (CH) (Figure 1b), and poly (lactic-co-glycolic acid) (PLGA) (Figure 1c) are the most applied copolymers used for this purpose.
CH is a natural hydrophilic and water soluble polysaccharide copolymer composed of randomly distributed
the development of parenteral drug delivery systems in the pharmaceutical industry.
Several advantages concerning both biocompatible and biodegradable polymeric microparticles for prolonging the drug delivery have been well established in previous studies. 18-24 However, the evaluation of the drug content
inside such kind of drug delivery systems became a challenge for researchers. Specifically for MTX loaded on microparticles, an optimization of the analytical technique became mandatory.
Different methods have been described for MTX quantification. However, most of those methods were developed for bioanalytical purposes. For biological fluids, Nagulu et al.25 developed a simple and fast method for
determination of MTX using high performance liquid chromatography (HPLC) with UV-Vis spectrometry and liquid-liquid extraction. However, a satisfactory quantification limit for routine monitoring of the drug in serum only was achieved after the administration of high doses. Turci et al.,26 described an HPLC method using mass
spectrometry detection and solid phase extraction (SPE). Although more complex, this method revealed to be more sensitive and, moreover, able to quantify trace levels of MTX in human urine. Zhu et al.,27 developed an ion chromatography
method with highly sensitive electrochemical detection and rapid execution, enabling commercial MTX quantification in biological samples. Suzuki et al.,28 applied the immunoassay
of MTX by capillary electrophoresis and although the use of a sophisticated apparatus, they were able to detect the drug at the pg (picogram) range. Hence, as it can be observed, all the reported methods were validated for the analysis of MTX on specific matrices.
The United States Pharmacopoeia (USP) as well as the Portuguese Pharmacopoeia established an assay for MTX in tablets by HPLC.29,30 However, the Brazilian Pharmacopoeia
did not describe such analytical procedure.31
During drug formulation development, sensitive and simple analytical methods such as HPLC and UV-Vis spectrophotometry should be well validated in order to assess drug loading as well as possible interaction among their components.32-36 HPLC methods are widely employed
in quality control for assessment of drugs because of their sensitivity, repeatability, and specificity. On the other hand, the use of spectroscopic techniques can be considered direct, fast, simple, and a less expensive alternative.37,38
The aim of this study was to develop, validate, and compare two analytical methods to quantify MTX. The final goal was to optimize a method not only with high sensitivity and specificity, but also with high precision and accuracy at low concentration of MTX. The method was conceived to be applied to different drug-loaded microparticles composed of water soluble (CH) or water insoluble (PLGA) copolymers.
Experimental
Chemicals and reagents
Methotrexate was purchased from DEG (São Paulo, Brazil); Chitosan from Sigma (Saint Louis, USA), and D,L-PLGA 50:50 from Birmingham (Birmingham, USA). Acetic acid and hydrochloric acid were from Synth (Diadema, Brazil), methanol was J.T. Baker (Phillipsburg, USA), ammonium acetate and sodium hydroxide were from Qhemis (Jundiaí, Brazil). All reagents were of analytical grade. Ultra-pure water (18.2 MΩ cm-1) was produced in a
Millipore Direct- Q™ system (Billerica, USA).
Equipment, instrumental and chromatographic conditions
Analyses were conducted using an HPLC Thermo Scientific Surveyor PLUS (Miami, USA) equipped with a degasser, a Surveyor PLUS pump, and a UV-Vis spectrophotometric detector with Surveyor photodiodes selected at 303 nm. An isocratic method was developed for separation using Hypersil BDS C18, 250 × 4.6 mm i.d. chromatography column with a pre-column (Hypersil BDS C18) both obtained from Thermo Scientific. A flow rate of 1 mL min−1 and a sample injection volume of 25 µL
were used during all analyses. A freshly prepared mobile phase was filtered through a 0.45 µm Teflon membrane and cellulose acetate membrane from Sartorius and degassed prior to use.
The UV-Vis spectrophotometric method was developed using two UV-Vis spectrophotometers: a Libra S32 from Biochrom® (Cambridge, United Kingdom) and an Evolution
60S from Thermo Scientific® (Miami, USA). All absorbance
measurements were taken in a 1 cm of path-length cuvette at room temperature, at wavelengths between 190 and 400 nm using 0.1 mol L-1 acetic acid solution as a blank.
Optimization of mobile phase
Three different ratios (25:75, 30:70, and 35:65 v/v) of methanol:ammonium acetate buffer 0.05 mol L-1, pH 6.0,
were evaluated using the following parameters: number of theoretical plates (N), peak resolution (R), and retention time (t). The N was defined according to the United States Pharmacopeia (USP), which was calculated by the equation (1):
N = 16 (t/w)2 (1)
where, t is the retention time of the substance and w is the width of the peak at base.
The R was defined (USP) according to the separation of two components in a mixture, in which R = 2(t2 – t1)/w2+w1,
where t2 an t1 were the retention time of the two components,
and w2 and w1 were the corresponding width at the bases of
the peaks. In this work, a solution containing MTX and the 4-aminoacetophenone was used as internal standard (IS), which was prepared in acetic acid 0.1 mol L-1.
Preparation of MTX-loaded biodegradable microparticles
MTX-loaded PLGA microparticles were prepared at different drug/polymer ratios (9.0, 18.0, and 27.0 wt.%). In the case of the hydrophobic copolymer PLGA, while suitable amounts of drug were dissolved in an aqueous acetic acid solution (1 wt.%), the copolymer was dissolved in acetone. The mixture was mixed and dried in a mini spray-dryer Buchi-191 equipped with a 0.7 mm nozzle, an inlet temperature of 80 °C and, an outlet temperature of about 60 °C with air flow of 600 NL h-1. On the other
hand, for the hydrophilic copolymer (MTX-loaded CH microparticles), MTX and chitosan were dissolved in a 0.1 mol L-1 acetic acid solution, which was dried in a mini
spray-dryer Buchi-191 with a 0.7 mm nozzle, an inlet temperature of 140 °C, and an outlet temperature of 90 °C with air flow of 500 NL h-1; a spray feed rate of 3 mL min-1;
and an aspirator efficiency of approximately 90%. For all samples, microparticles were collected and stored under vacuum at room temperature.
Validation procedure
The analytical method was validated in agreement with the ICH (International Conference on the Harmonization of
Technical Requirements for the Registration of Pharmaceuticals for Human Use, 1996) and ANVISA (National Health Surveillance Agency, 2003) using the following analytical parameters: specificity, linearity, range, detection and quantification limits, precision, robustness, and accuracy.
Specificity
This parameter was calculated by comparing areas under the curve and retention times (for the HPLC method) or plots of absorbance scanned at a range of 190 to 400 nm (for the UV-Vis spectrophotometric method) of drug solution containing different matrix components (Chitosan or PLGA).
Standard curves
An MTX stock solution at 500 µg mL-1 was produced in
an acetic acid solution (1:10, v/v). Different aliquots of this solution were transferred to volumetric flasks and the final volume was completed with acetic acid 0.1 mol L-1 to obtain
solutions at different concentrations (0.5-16.0 µg mL-1).
All samples were filtered with Maxcrom OEM nylon membrane 0.22 µm and injected into the HPLC system in triplicate. The same samples were also analyzed by UV-Vis spectrophotometry at 303 nm. An analytical curve was generated by plotting the different concentration points and the area under the curve or the absorbance for HPLC or UV-Vis spectrophotometric method, respectively.
Linearity
The linearity was assessed by using the correlation coefficient from the (straight line) analytical curve fitted from MTX analytical data in the chosen concentration range (0.5-16.0 µg mL-1). Each point was analyzed three
times. Peak areas (response) or absorbance values against MTX concentration were plotted and a linear least-squares regression analysis was conducted to determine the slope (IC), the intercept, and the standard deviation of the intercept (DPa).
Limit of detection and limit of quantitation
The limit of detection (LOD) and the limit of quantitation (LOQ) were calculated based on the standard deviation response and the slope of the analytical curves, according to the equations (2) and (3) as follows:
LOD = (DPa × 3)/IC (2)
LOQ = (DPa × 10)/IC (3)
Precision
analyses of MTX solutions at five different concentrations (2.0, 4.0, 8.0, 12.0, and 14.0 µg mL-1) in triplicate. The
analyses were carried out on the same day for the intraday precision, and on five different days, at intervals of at least two days, for the interday precision. The results were submitted to one-way analysis of variance (ANOVA) and Student t-test at a significance level of 0.05 (p < 0.05).
Accuracy
The accuracy was evaluated by the standard addition method, in which solutions containing the matrix components (CH or PLGA), named ‘placebo’, were added to different amounts of MTX standard solution to attain five different drug concentrations (2.0, 4.0, 8.0, 12.0, and 14.0 µg mL-1). Accuracy was calculated, in triplicate, as
the mean of five tests at each level using the relationship described in the Equation 4.
× 100 ion
concentrat l
theoretica
ion concentrat al
experiment mean
Accuracy
= (4)
Apparent robustness
The precision variation involved in several of this study’s analytical parameters, such as different days, different instruments, and different laboratories, was described in previous sections. Additionally, the effect of the pH of the analytical solutions on the accuracy and precision was investigated. In the HPLC method, the robustness of the technique was checked by changing the pH of the mobile phase by 0.1 units. In the UV-Vis spectrophotometer method, the pH of the analytical solutions was measured (pH = 1.9) and adjusted to lower and higher levels (pH = 1.4 and pH = 2.4) using 0.1 mol L-1 HCl and 0.1 mol L-1NaOH,
respectively. The analytical quantitations were performed at five different concentrations (2.0, 4.0, 8.0, 12.0, and 14.0 µg mL-1) for each pH value. The robustness was
observed and reported as RDS from different analyses. In addition, the experimental data were subjected to ANOVA (significance level p < 0.05).
Performance of HLPC and UV-Vis spectrophotometric methods for MTX quantitation in biodegradable microparticles
Sufficient amount of MTX-loaded biodegradable (PLGA) microparticles, equivalent to 25 mg of pure drug, was taken as sample, and then dissolved in an aqueous acetic acid solution (10 wt.%). This stock solution (500 µg mL-1)
was diluted into volumetric flasks and the final volume was completed with 0.1 mol L-1 acetic acid to achieve the sample
solutions with a theoretical concentration of 8 µg mL-1.
All samples were filtered in 0.22 µm membranes and the
analytical quantifications were performed using the same procedure described for the analytical curves. The drug concentration was calculated using the equation generated from the analytical curves.
Statistics
The RSD was calculated as RSD = 100 x (sd/mean). For comparisons among the analytical results, the experimental data were subjected to ANOVA and the Student’s t-test. A p value < 0.05 was required for significance.
Results and Discussion
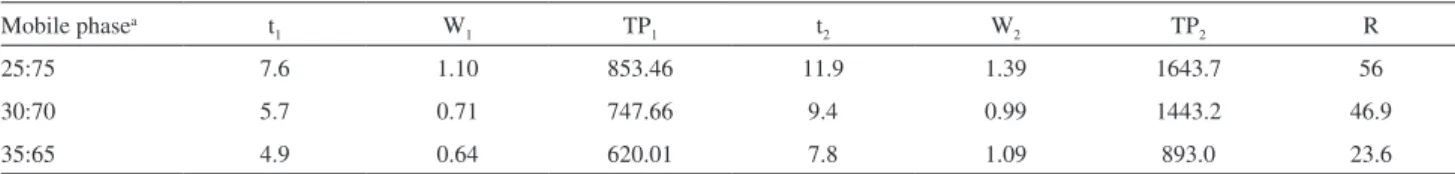
In this work, prior to the validation procedure, an optimization of the mobile phase was carried out to obtain better chromatographic separation of the studied compounds. Table 1 summarize the results obtained for the optimization of the mobile phase. The increment of methanol in the mobile phase led to decrease the retention time for both the MTX and the IS, which contributed to reducing analysis time. However, the number of theoretical plates and the peak resolution also decreased. The number of theoretical plates (TP) is a measure of the column efficiency and the plate number is a measure of the system’s capability for resolving a single peak. Therefore, empirical criteria functions have been developed to assay peak pairs. Due to its simplicity, the resolution (R) is perhaps the most popular of the empirical criteria functions.39
Based on the investigated chromatographic symmetry and resolution parameters the 25:75 (v/v) methanol:ammonium acetate buffer ratio enabled a rapid and suitable analysis time providing a quite satisfactory separation of the MTX. By using the selected mobile phase, the retention time for MTX was about 7 min. This value was lower than that obtained for the solvent systems previously proposed in other studies, which reported a retention time for the MTX higher than 10 min.40,41 Consequently, the
optimization of the analysis time in our study represented another positive feature.
Validation
In addition, this assay can predict any interaction among the components of the formulation and the drug, which could impeach a good analytical quantitation of the drug loaded into the delivery system.34-36
The UV-Vis spectrophotometric analyses revealed no interference of PLGA (Figure 2a) or CH (Figure 2b). The components of the matrix exhibited no absorbance at the selected wavelength (303 nm). Additionally, no bathochromic or hypsochromic shift was observed in the UV-Vis spectrophotometric scanning plot in the presence of both studied copolymers, which demonstrates the specificity of method. As occurred for the UV-Vis spectrophotometric method, signals of matrices PLGA/CH or impurities that might interfere with quantitation of the drug were not observed for the HPLC method (Figure 2c and 2d). The retention time of the drug remained about 7 minutes in the presence of both PLGA and CH. However, slight differences occurred due to the sample preparation procedure, which was adapted to the solubility property of each copolymer used to produce the referred biodegradable microparticles. In order to avoid any precipitation of copolymers during analysis, the samples were diluted in an aqueous acetic acid solution (in the case of samples containing PLGA) or in the mobile phase (in the case of samples containing CH), which were properly filtered prior to injection on the HPLC apparatus.
The specificity of an analytical method describes its ability to measure the drug content in the presence of impurities, excipients, degradation products, or matrix components.31-33 The overall results revealed that the
specificity was well established for the two selected methods used in this study.
Concerning the HPLC profile, a well-resolved and eluted symmetric peak with retention time in approximately 7 min was observed by using this method. Aiming to evaluate the linearity, the standard curve for MTX was constructed by plotting the peak area vs. concentration over the concentration range of 0.5 to 16 µg mL-1. The
linearity results revealed that the drug concentration was directly proportional within the specific concentration interval.32,33 This adequate linearity was demonstrated by
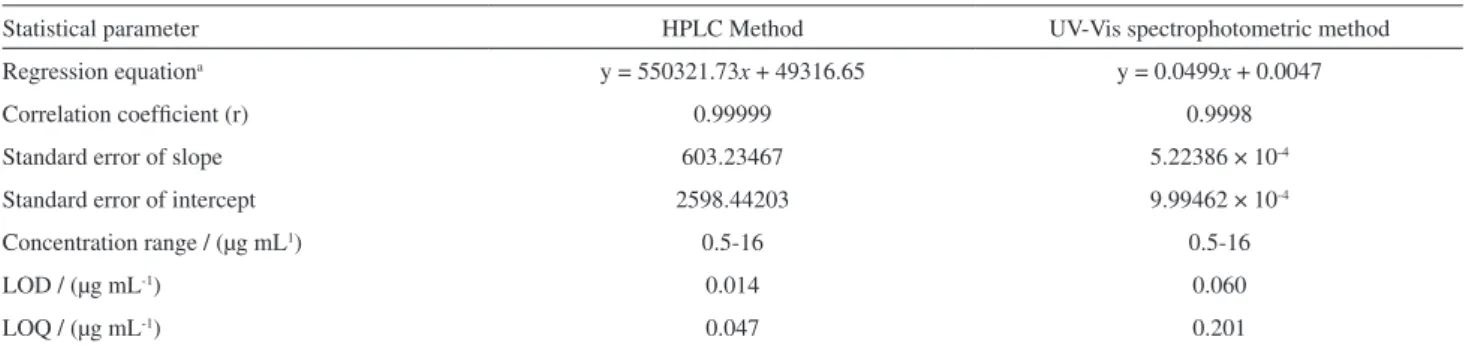
the correlation coefficient (r = 0.99999) (Table 2). HPLC
Table 1. Results obtained by testing the different ratios of the mobile phase (methanol: ammonium acetate, v/v)
Mobile phasea t
1 W1 TP1 t2 W2 TP2 R
25:75 7.6 1.10 853.46 11.9 1.39 1643.7 56
30:70 5.7 0.71 747.66 9.4 0.99 1443.2 46.9
35:65 4.9 0.64 620.01 7.8 1.09 893.0 23.6
aDifferent ratios of methanol: ammonium acetate buffer, 0.05 mol L-1, pH 6.0; t = retention time; W = peak width; TP = number of theoretical plates;
R = Resolution; 1: data for the first analyte (MTX), 2: corresponding to the second analyte (IS).
Figure 2. UV-Vis spectrophotometric scanning plots for MTX solution (8 µg mL-1) in absence and presence of PLGA (a) or CH (b) and their
is a routinely used analytical method for assessing not only drug concentration, but also the stability of a compound in food, cosmetic, and pharmaceutical products. However, the time of analysis is a main concern to any development of a method. In this work a methanol:ammonium acetate buffer at a ratio of 25:75 (v/v) was used in order to achieve a satisfactory analysis time by HPLC.
On the other hand, UV-Vis spectrophotometry is a fast technique that involves simple instrumentation when compared to the HPLC. Hurtato et al.,42 reported that the
use of the UV-Vis spectrophotometric method allowed a rapid and low-cost quantitation of levofloxacin without any time-consuming sample preparation, unlike the HPLC method. Thus, in the case of MTX in this work, the same sample preparation procedure produced a linear correlation (r = 0.9998) among MTX concentrations ranging from 0.5 to 16 µg mL-1. Moreover, both methods exhibit low standard
error of intercept and correlation coefficient values within the limits established by the ICH (1996) and ANVISA (2003) (r> 0.99). Therefore, the linearity of both the HPLC and the UV-Vis spectrophotometric methods was ensured under the described experimental conditions.
Sensitivity is another relevant and sought analytical parameter in drug analysis. Sometimes to evaluate this parameter, the use of HPLC method is fundamental, essentially for the stability studies or the determination of drugs in biological fluids.43-45 However, in this study, limits
of detection and quantification were generated based on the HPLC and UV-Vis spectrophotometric analytical curves. The values of LOD and LOQ were found between 0.014 and 0.047 µg mL-1, respectively, for the HPLC
method, while for the UV-Vis spectrophotometric method these values remained about 0.060 and 0.201 µg mL-1,
respectively. Such results clearly reveal that both methods are reliable to evaluate MTX concentration at the linearity study range.
Skibinska et al.,40 suggested a HPLC method for the
quantitation of MTX and 7-hydroxymethotrexate (7-OH
MTX) in children with acute lymphoblastic leukemia. Despite the lowest resolution found among MTX and 7-OH MTX and low concentration range (0.025-0.8 µg mL-1),
the method was linear, which provided a LOQ of about 0.025 µg mL-1. In addition, Begas et al.,41 developed a
highly sensitive HPLC method for the monitoring of MTX in osteosarcoma patients. In this study, they also found a linear concentration range from 0.011 to 2.27 µg mL-1,
which provided a LOQ of 0.005 µg mL-1.
Recently, Daniel et al.,46 suggested a HPLC procedure
using fluorometric detection for itraconazole quantitation in poly lactic-co-glycolic acid nanoparticles, plasma and tissue which linear concentration ranged from 0.01 µg mL–1
to 10 µg mL–1.However, a LOQ of 0.459 µg mL–1 was
observed. When the linear concentration range was changed from 0.01 to 0.02 µg mL–1, the LOQ decreased
to 0.008 µg mL–1.
Compared to the aforementioned methods, the HPLC method discussed in the present study revealed to be suitable for drug loading and stability studies of different biodegradable microparticles because it presented not only the best resolution and retention time, but also quite similar precision and accuracy values. However, for studies like pharmacokinetic and therapeutic drug monitoring in which high sensitivity is mandatory, a small linear concentration range should be tested. Additionally, the present study demonstrated that the UV-Vis spectrophotometric method can be perfectly applied in the quality control of different MTX-loaded biodegradable microparticles in which the amount of MTX has to be controlled for analytical purposes. A similar approach was previously demonstrated by Brier et al.,47 for fexofenadine hydrochloride in
pharmaceutical formulations. El-Hady et al.,48 previously
suggested the use of enationselective HPLC in the presence of folic acid (FA) for MTX quantitation in pharmaceutical products. However, large linear concentration ranges from 3 to 250 µg mL–1 for MTX and from 6 to 300 µg mL–1 for
FA were used, which also led to the highest LOQ of 3 and
Table 2. Results of the data regression analysis for quantitation of MTX by the proposed methods
Statistical parameter HPLC Method UV-Vis spectrophotometric method
Regression equationa y = 550321.73x + 49316.65 y = 0.0499x + 0.0047
Correlation coefficient (r) 0.99999 0.9998
Standard error of slope 603.23467 5.22386 × 10⁻⁴
Standard error of intercept 2598.44203 9.99462 × 10⁻⁴
Concentration range / (µg mL1) 0.5-16 0.5-16
LOD / (µg mL-1) 0.014 0.060
LOQ / (µg mL-1) 0.047 0.201
aBased on three analytical curves. y: the peak area (HPLC method) and absorbance (UV-Vis spectrophotometric method); x: the concentration of the MTX
12.67 µg mL–1, respectively, considering a signal-to-noise
ratio of approximately 10:1.
Table 3 summarizes the results of precision in the range of 0.5 to 16 µg mL-1. Suitable precision for the
HPLC method was found. RSD values were lower than 0.53% and 3.39% for the intraday and for the interday tests, respectively. The UV-Vis spectrophotometric method exhibited similar values (1.38% and 2.90% for intraday and for interday tests, respectively). The precision was evaluated for all tested concentration levels and the statistical analysis (ANOVA) revealed no statistical differences among the experimental data from the intraday and the interday tests for the HPLC (F = 306.5, p = 0.9974) and for the UV-Vis spectrophotometric method (F = 324.7, p = 0.9965).
The comparison between the precision of the HPLC method and UV-Vis spectrophotometric method was performed through the no paired statistical Student’s t-test
(0.05 significance level), which revealed no significant difference between HPLC and UV-Vis spectrophotometric intraday precision (p = 0.9767) and interday precision (p = 0.8874).
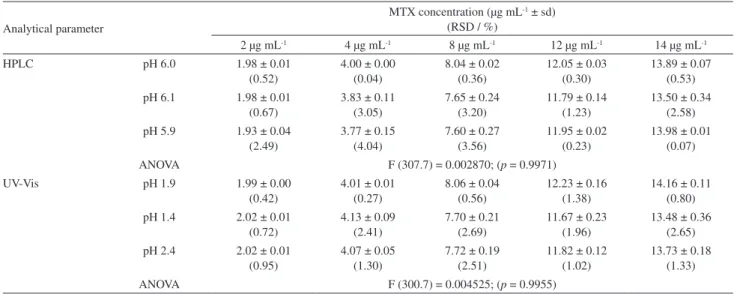
In addition, the reliability of different methods was also evaluated by a robustness study in which the effect of additional variations such as pH of the mobile phase (HPLC) or pH of the analytical solution (UV-Vis spectrophotometry) in the precision of methods was investigated at five different concentration levels.31,32,49 As presented in Table 4, no
statistical differences were observed for all experimental results for both HPLC (ANOVA : F = 307.7, p = 0.9971) and UV-Vis spectrophotometry (ANOVA: F = 300.7, p = 0.9955) when compared to the results from respective samples at the original pH. In this study, a wide range of pH was investigated aiming to evaluate the possible MTX ionization after increasing pH of the analytical solutions.
Table 3. Precision results for the HPLC and the UV-Vis spectrophotometric methods
Analytical parameter
MTX concentration (µg mL-1 ± sd)
(RSD / %)
2 µg mL-1 4 µg mL-1 8 µg mL-1 12 µg mL-1 14 µg mL-1
Precision
HPLC Intraday 1.98 ± 0.01
(0.52)
4.00 ± 0.00 (0.04)
8.04 ± 0.02 (0.36)
12.05 ± 0.03 (0.03)
13.89 ±0.07 (0.53) Interday 1.90 ± 0.06
(3.39)
3.95 ± 0.03 (0.76)
7.75 ± 0.17 (2.20)
11.68 ± 0.22 (1.87)
13.68 ± 0.22 (1.61)
ANOVA F (306.5) = 0.002611; (p = 0.9974)
UV-Vis Intraday 1.99 ± 0.00
(0.42)
4.01 ± 0.01 (0.27)
8.06 ± 0.04 (0.56)
12.23 ± 0.16 (1.38)
14.16 ± 0.11 (0.80) Interday 2.04 ± 0.02
(1.40)
4.13 ± 0.09 (2.41)
8.16 ± 0.11 (1.41)
12.50 ± 0.35 (2.90)
14.51 ± 0.36 (2.53)
ANOVA F (324.7) = 0.003512; (p = 0.9965)
Table 4. Apparent robustness results for the HPLC and the UV-Vis spectrophotometric methods
Analytical parameter
MTX concentration (µg mL-1 ± sd)
(RSD / %)
2 µg mL-1 4 µg mL-1 8 µg mL-1 12 µg mL-1 14 µg mL-1
HPLC pH 6.0 1.98 ± 0.01
(0.52)
4.00 ± 0.00 (0.04)
8.04 ± 0.02 (0.36)
12.05 ± 0.03 (0.30)
13.89 ± 0.07 (0.53) pH 6.1 1.98 ± 0.01
(0.67)
3.83 ± 0.11 (3.05)
7.65 ± 0.24 (3.20)
11.79 ± 0.14 (1.23)
13.50 ± 0.34 (2.58) pH 5.9 1.93 ± 0.04
(2.49)
3.77 ± 0.15 (4.04)
7.60 ± 0.27 (3.56)
11.95 ± 0.02 (0.23)
13.98 ± 0.01 (0.07)
ANOVA F (307.7) = 0.002870; (p = 0.9971)
UV-Vis pH 1.9 1.99 ± 0.00
(0.42)
4.01 ± 0.01 (0.27)
8.06 ± 0.04 (0.56)
12.23 ± 0.16 (1.38)
14.16 ± 0.11 (0.80) pH 1.4 2.02 ± 0.01
(0.72)
4.13 ± 0.09 (2.41)
7.70 ± 0.21 (2.69)
11.67 ± 0.23 (1.96)
13.48 ± 0.36 (2.65) pH 2.4 2.02 ± 0.01
(0.95)
4.07 ± 0.05 (1.30)
7.72 ± 0.19 (2.51)
11.82 ± 0.12 (1.02)
13.73 ± 0.18 (1.33)
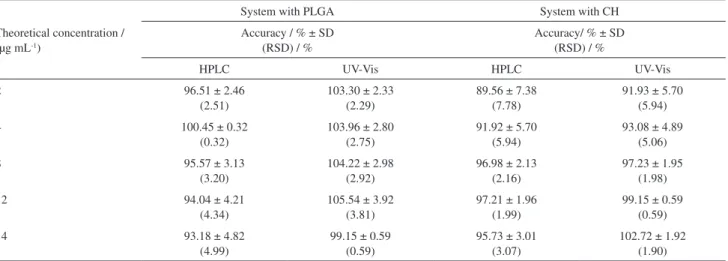
Accuracy is one of the most important validation parameter, which can be determined from at least nine analytical determinations at three different concentrations within the linear range of the standard curve.32,33 For this
purpose, at least one low, one medium, and one high concentration may be used in triplicate analyses in which the sample can be a pharmaceutical dosage form or only the placebo (excipient mixture). In this study, PLGA (for the MTX-loaded PLGA microparticles) and CH (for the MTX-loaded CH microparticles) was added to the analytical MTX solutions and the accuracy was investigated at five drug concentration levels (Table 5).
All achieved results with samples containing PLGA and CH as components of the polymer matrix ranged from 89.56 to 100.45% for the HPLC method and 91.93 to 105.54% for the UV-Vis spectrophotometric method (Table 5). As previously described about the sample preparation for MTX quantitation by HPLC analysis, the use of an aqueous solution or an organic solution for PLGA particles and CH particles, respectively, can lead to copolymer precipitation. This phenomenon, widely discussed in the literature, may decrease the MTX accuracy due to adsorption on the polymeric material.50,51 However,
the experimental accuracy data are within acceptable range for all tested concentrations for both HPLC and UV-Vis spectrophotometric methods.
The comparison between the average precision level for both methods (HPLC and UV-Vis spectrophotometry) performed by the Student’s t-test revealed a p = 0.8962. The results obtained for accuracy are in accordance with the parameters required by the ICH and the ANVISA that require recovery limits from 80 to 120% for pharmaceutical products. Therefore, this information confirms that the presence of the polymer (PLGA or CH) has no interference in the analysis of MTX by HPLC.
Concerning the UV-Vis spectrophotometric method, the presence of these components was also unable to induce changes (bathochromic or hypsochromic shift) during the quantitation of the drug and the maximum wavelength (303 nm) was kept constant.
Performance of the analytical method for MTX assay in biodegradable microparticles
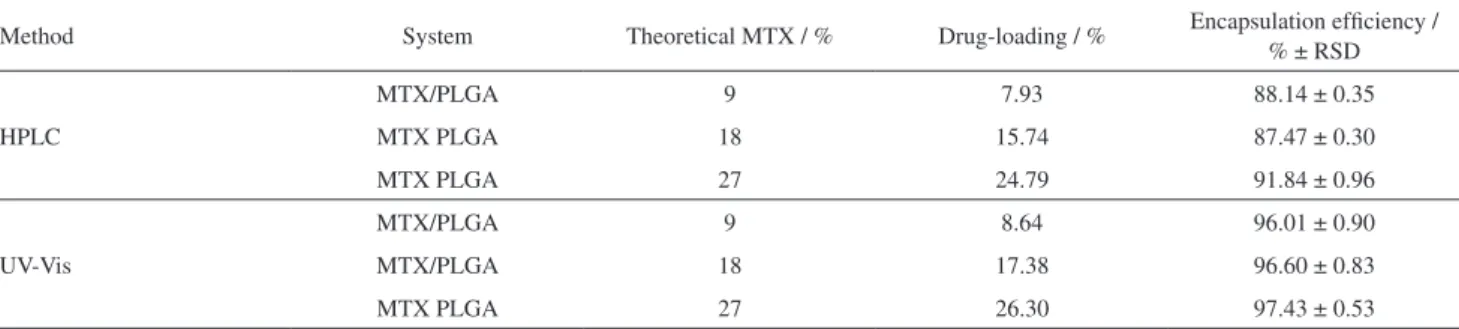
All analytical parameters recognized for quality control of pharmaceutical products were tested in this study, demonstrating that the suggested methods for quantitative analysis of MTX-loaded CH or PLGA microparticles were validated with success. In addition, a performance test was also applied in order to evaluate the application of the methodology for analysis of drug content loaded into polymeric microparticles. Thus, the MTX-loaded PLGA microparticles were chosen for this purpose. Both HPLC and UV-Vis spectrophotometric methods were used to assess the drug-loaded PLGA microparticles and encapsulation efficiency of the spray-drying technique.
The experimental results (Table 6) showed that both analytical methods can be successfully used to evaluate the drug content from biodegradable microparticles. The encapsulation efficiency describes the volume of drug loading into the polymeric matrix by the microencapsulation method. The similarity of the results from both methods attested to the expected high level of encapsulation efficiency for the spray-drying method during the production of biodegradable polymeric microparticles.
In addition, the amount of drug entrapped in the polymeric matrix, evaluated by both methods, was similar. In fact, Student’s t-test revealed that no statistical difference was found between the analytical methods (p = 0.8641). Other validations for drug delivery system studies using
Table 5. Experimental results from the accuracy test (n= 3)
Theoretical concentration / (µg mL-1)
System with PLGA System with CH
Accuracy / % ± SD (RSD) / %
Accuracy/ % ± SD (RSD) / %
HPLC UV-Vis HPLC UV-Vis
2 96.51 ± 2.46
(2.51)
103.30 ± 2.33 (2.29)
89.56 ± 7.38 (7.78)
91.93 ± 5.70 (5.94)
4 100.45 ± 0.32
(0.32)
103.96 ± 2.80 (2.75)
91.92 ± 5.70 (5.94)
93.08 ± 4.89 (5.06)
8 95.57 ± 3.13
(3.20)
104.22 ± 2.98 (2.92)
96.98 ± 2.13 (2.16)
97.23 ± 1.95 (1.98)
12 94.04 ± 4.21
(4.34)
105.54 ± 3.92 (3.81)
97.21 ± 1.96 (1.99)
99.15 ± 0.59 (0.59)
14 93.18 ± 4.82
(4.99)
99.15 ± 0.59 (0.59)
95.73 ± 3.01 (3.07)
the HPLC-DAD method and UV-Vis spectrophotometric method were described in the literature. Rossi et al.,52
proposed these two methods as alternatives for the quantitation of capreomycin in liposomal formulations. They showed that both methods were valid alternatives for drug quantitative analysis, even though the UV-Vis spectrophotometric method presented less accurate than the HPLC in reversed phase (RP) mode. In fact, the spectrophotometric analyses were easier and required shorter time for experiments. Branquinho et al.,53 evaluated
the contend of lychnipholide (LYC) in nanocapsules. These authors also observed that both methods (HPLC method and UV-Vis spectrophotometric method) were suitable to determine encapsulation efficiency and drug loading. However, due to its high sensitivity, the HPLC-DAD method was more indicated in the studies in which a very small amount of drug was released over time.
Finally, the results obtained in this work indicated that the suggested methods for the quantitation of MTX in microparticles based on copolymers with different solubility characteristics offer statistically equivalent results. However, the HPLC method seems to be more advantageous because of its high sensitivity and ability to detect other MTX derived species. These experimental findings can be used in the next studies involving MTX detection or its degradation products in stability studies, or yet to assess its content in pharmacokinetic studies using biological fluids. On the other hand, the UV-VIS spectrophotometry is an alternative method for quantitative analysis of MTX in less complex solutions such as those adopted in vitro release kinetics studies from the drug-loaded microparticles and quality control.
Conclusions
In the present study, an analytical method was developed for quantitative analysis of drug-loaded biodegradable microparticles with different copolymer matrices (CH or PLGA).The experimental results demonstrated a
properly conducted validation study of HPLC and UV-Vis spectrophotometric methods for analytical determination of MTX-loaded biodegradable microparticles. The suggested methodologies showed high specificity, linearity, precision, accuracy, robustness with low limit of detection and quantification, which demonstrates the reliability required for quality control of the MTX in these drug delivery systems. The analytical methods were sufficiently simple, rapid, and suitable and may be safely used in the quantitative analysis of MTX loaded into CH or PLGA microparticles.
Acknowledgements
The authors wish to thank the Brazilian National Council for Technological and Scientific Development (CNPq) (grant number: 483073/2010 and 481767/2012-6), the Brazilian Federal Agency for Support and Evaluation of Graduate Education (CAPES) (grant: AUXPE No. PNPD 2263/2011, and scholarship of A.R. Oliveira; E.G. Oliveira; L. B. de Caland) for the financial support. The authors are also grateful to Glenn Hawes, M.Ed. English, University of Georgia, for editing this manuscript.
References
1. Pignatello, R.; Guccione, S.; Forte, S.; Giacomo, C.; Sorrenti, V.; Vicari, L.; Barretta, G. U.; Balzano, F.; Puglisi, G.; Bioorg. Med.
Chem. 2004, 12, 2951.
2. Almagro, M. C.; Selga, E.; Thibaut, R.; Porte, C.; Noé, V.; Ciudad, C. J.; Biochem. Pharmacol. 2011, 81, 60.
3. Nogueira, D. R.; Tavano, L.; Mitians, M.; Pérez, L.; Infante, M. R.; Vinardell, M. P.; Biomater. 2013, 34, 2758.
4. Schmid, K. E.; Kornek, G. V.; Scheithauer, W.; Binder, S.; Surv. Ophthalmol. 2006, 51, 19.
5. Warren, R. B.; Griffiths, C. E. M.; Clin. Dermatol. 2008, 26, 438.
6. Ofner III; C. M.; Pica, K.; Bownan, B. J.; Chen, C. S.; Int. J. Pharm. 2006, 308, 90.
Table 6. Drug-loading content and encapsulation efficiency for PLGA microparticle systems containing MTX
Method System Theoretical MTX / % Drug-loading / % Encapsulation efficiency / % ± RSD
HPLC
MTX/PLGA 9 7.93 88.14 ± 0.35
MTX PLGA 18 15.74 87.47 ± 0.30
MTX PLGA 27 24.79 91.84 ± 0.96
UV-Vis
MTX/PLGA 9 8.64 96.01 ± 0.90
MTX/PLGA 18 17.38 96.60 ± 0.83
7. Zhang, Y.; Jin, T.; Zhuo, R. X.; Colloids Surf., B. 2005, 44, 104. 8. Taheri, A.; Atybi, F.; Nouri, F. S.; Ahadi, F.; Derakhshan, M. A.; Amini, M.; Ghahremani, M. H.; Ostad, S. N.; Manssori, P.; Dinarvand, R.; J. Nanomater. 2011, 2011, 1.
9. Kakizawa, Y.; Nishio, R.; Hirano, T.; Koshi, Y.; Nukiwa, M.; Koiwa, M.; Michizoe, J.; Ida, N.; J. Controlled Release 2010,
142, 8.
10. Leng, Z.; Zhuang, Q.; Li, Y.; Hec, Z.; Chen, Z.; Huang, S.; Jia, H.; Zhou, J.; Liu, Y.; Du, L.; Carbohydr. Polym. 2013, 98, 1173.
11. Silva-Júnior, A. A.; Scarpa, M.; Pestana, K.; Mercuri, L.; Matos, J. R.; Oliveira, A. G.; Thermochim. Acta 2008, 467, 91. 12. Silva-Junior, A. A.; Matos, J. R.; Formariz, T. P.; Rossanizi, G.;
Scarpa, M. V.; Egito, E. S. T.; Oliveira, A. G.; Int. J. Pharm. 2009, 368, 45.
13. Paganelli, F.; Cardillo, J. A.; Melo-Junior, L. A.; Lucena, D. R.; Silva-Junior, A. A.; Hofling, A. L.; Nguye, Q. D.; Kuppermann, B. D.; Belfort-Junior, R.; Oliveira, A.G.; Invest. Ophtalmol. Vis. Sci. 2009, 50, 3041.
14. Lins, L. C.; Bazzo, G. C.; Barreto, P. L. M.; Pires, A. T. N.;
J. Braz. Chem. Soc. 2014, 25, 1462.
15. Oliveira, A. R.; Molina, E. F.; Mesquita, P. C.; Fonseca, J. L. C.; Rossanezi, G.; Fernandes-Pedrosa, M. F.; Oliveira, A. G.; Silva-Junior, A. A.; J. Therm. Anal. Calorim. 2013, 112, 555. 16. Paramera, A, E. I.; Konteles, S. J.; Karathanos, V. T.; Food
Chem. 2011, 125, 892.
17. Campos, E.; Branquinho, J.; Carreira, A. S.; Carvalho, A.; Coimbra, P.; Ferreira, P.; Gil, M. H.; Eur. Polym. J. 2013, 49, 2005.
18. Jain, A. R.; Biomater. 2000,21, 2475.
19. Li, M.; Rouaud, O.; Poncelet, D.; Int. J. Pharm. 2008, 363, 26. 20. Klose, D.; Delplace, C.; Siepmann, J.; Int. J. Pharm. 2011, 404,
75.
21. Prasanth, V. V.; Moy, A. C.; Mathew, S. T.; Mathapan, R.; Int.
J. Res. Pharm. Biomed. Sci. 2011, 2, 332.
22. Ramachandran, S.; Thirumurugan, G.; Dhanaraju, M. D.; Am.
J. Drug Discovery Devel. 2011, 1, 105.
23. Soares, K. S. R.; Fonseca, J. L. C.; Bitencourt, M. A. O. Santos, K. S. C. R.; Silva-Júnior, A. A.; Fernandes-Pedrosa, M. F.;
Toxicon 2012, 60, 1349.
24. Shukla, S. K.; Mishra, A. K.; Arotiba, O. A.; Mamba, B. B.;
Int. J. Biol. Macromol. 2013, 59, 46.
25. Nagulu, M.; Udaykiran, V.; Ramakrishna, D.; Asian J. Chem. 2009, 21, 6845.
26. Turci, R.; Fiorentino, M. L.; Sottani, C.; Minoia, C.; Rapid
Commun. Mass Spectrom. 2000, 14, 173.
27. Zhu, Z.; Wub, H.; Wuc, S.; Huanga, Z.; Zhu, Y.; Xi, L.;
J. Chromatogr. A. 2013, 1283, 62.
28. Suzuki, Y.; Arakawa, H.; Maeda, M.; Anal. Sci. 2003, 19, 111. 29. The United States Pharmacopeia; The Official Compendia of
Standards, 30th ed.; for Windows (in CD), 2007, p. 2613.
30. Ministério da Saúde Português; Farmacopéia Portuguesa VII; Edição oficial 2002 Lisboa; Imprensa Nacional de Lisboa: Lisboa, 2002.
31. Agência Nacional de Vigilância Sanitária (ANVISA);
Farmacopéia Brasileira, 5rd ed.; Brasília, 2010.
32. Agência Nacional de Vigilância Sanitária (ANVISA); Guia para Validação de Métodos Analíticos e Bioanalíticos,
Resolution-RE No. 899, 2003.
33. International Conference on Harmonization of Technical Requeriments for Registration of Pharmaceuticals for Human Use (ICH): Validation of Analytical Procedures: Text and
Methodology, Q2 (R1);ICH: London, 2005.
34. Silva-Júnior, A. A.; Formariz, T. P.; Scarpa, M. V.; Oliveria, A. G.; Rev. Ciênc. Farm. Básica Apl. 2006, 27, 119.
35. Aquino, G. D. A.; Stophilha, R. T.; Fernandes-Pedrosa, M. F.; Santos, K. S. C. R.; Egito, E. S. T.; Oliveira, A. G.; Silva-Júnior, A. A.; Rev. Ciênc. Farm. Básica Apl. 2011, 32, 35.
36. Streck, L.; Santos, K. S. R. C.; Fernandes-Pedrosa, M. F.; Oliveira, A. G.; Quim. Nova. 2011, 34, 1459.
37. Weich, A.; Oliveira, D. C.; Melo, J.; Goebel K.; Rolim, C. M. B.;
Lat. Am. J. Pharm. 2007, 26, 765.
38. Talluri, M. V. N. K.; Bairwa, M. K.; Dugga, H. H. T.; Srinivas, R.; J. Liq. Chromatogr. Relat. Technol. 2012,
35, 129.
39. Klein, E. J.; Rivera, S. L.; J. Liq. Chromatogr. Relat. Technol.
2000, 23, 2097.
40. Skibinska, L.; Gregorczyk, J.; Chem. Anal. 2001, 46, 329. 41. Begas, E.; Papandreou, C.; Tsakalof, A.; Daliani, D.; Papatsibas,
E. A.; J. Chromatogr. Sci. 2014, 52, 590.
42. Hurtato, K. K.; Nogueira, D. R.; Bortolini, F.; Silva, L. M.; Zimmermann, E.; Jost, M.; Melo, S. J.; Rolim, C. M. B.; J. Liq.
Chromatogr. Relat. Technol. 2007, 30, 1981.
43. Paditrao, V. M.; Sarkate, A. P.; Sangshetti, J. N.; Wakte, P. S.; Shinde D. B.; J. Braz. Chem. Soc. 2011, 22, 1253.
44. Sharma, M.; Jawa, P. R.; Gill, R. S.; Bansal, G.; J. Braz. Chem. Soc. 2011, 5, 836.
45. Linden, R.; Antunes, M. V.; Ziulkoski, A. L.; Wingert, M.; Tonello, P.; Tzvetkov, M.; Souto, A. A. J. Braz. Chem. Soc.
2008, 19, 35.
46. Py-Daniel, K. R.; Pires Junior, O. R.; Infate, C. M. C.; Fascineli, M. L.; Tedesco, A. C.; Azevedo, R. B. J. Braz. Chem. Soc.2014,
25, 697.
47. Breier, A. R.; Steppe, M.; Schapoval, E. E. S.; Anal. Lett. 2007,
40, 2329.
48. El-Hady, D. A.; El-Maali, N. A.; Gotti, R.; Bertucci, C.; Mancini, F.; Andrisano, V.; J. Pharm. Biomed. Anal. 2005, 37, 919.
49. Ribani, N.; Bottoli, C. B. G.; Collins, C. H.; Jardim, I. C. S; F.; Melo, L.F.C.; Quim. Nova. 2004, 27, 771.
51. Lima, C. R. M.; Pereira, M. R.; Fonseca, J. L. C.; Colloids Surf., B.. 2013, 109, 52.
52. Rossi, C.; Fardella, G.; Chiappini, I.; Perioli, L.; Vescovi, C.; Riccia, M.; Giovagnoli, S.; Scuota, S.; J. Pharm. Biomed. 2004,
36, 249.
53. Branquinho, R. T.; Mosqueira, V. C. F.; Kano, E. K.; Souza, J.; Dorim, D. D. R.; Guimarães, D. A. S.; Lana, M.; J. Chromatogr. Sci. 2014, 52, 19.
Submitted: October 1, 2014