Article
J. Braz. Chem. Soc., Vol. 26, No. 7, 1431-1437, 2015. Printed in Brazil - ©2015 Sociedade Brasileira de Química 0103 - 5053 $6.00+0.00
A
*e-mail: [email protected]
Simple Methods via Mid-IR or
1H NMR Spectroscopy for the Determination of the
Iodine Value of Vegetable Oils
Gustavo G. Shimamoto, Martha M. A. Favaro and Matthieu Tubino*
Instituto de Química, Universidade Estadual de Campinas (Unicamp), P.O. Box 6154, 13083-970 Campinas-SP, Brazil
Two methods for determining the iodine value in vegetable oils are described. One employs mid-infrared (mid-IR) spectroscopy and the other uses hydrogen nuclear magnetic resonance (1H NMR). The determination of the iodine value is based on either the transmittance intensity
of mid-IR signals or on the 1H NMR signal integration and multivariate calibration. Both of the
methods showed adequate coefficients of determination (r2 = 0.9974 and 0.9978, respectively)
when compared to Wijs method, which is recommended by the norm EN 14111. A statistical comparison between the results from the proposed methods and from Wijs method shows that both instrumental methods offer equivalent results and greater precisions compared to Wijs method. The regressions obtained from the constructed models were considered statistically significant and useful for making predictions. The proposed methods present several advantages compared to Wijs method because they significantly reduce analysis time, reagent consumption and waste generation. Furthermore, an analyst can choose between the mid-IR or 1H NMR to determine the iodine value.
Keywords: iodine value, vegetable oils, infrared, nuclear magnetic resonance, green methods
Introduction
Oils and fats have always been associated with their nutritional characteristics and considered as raw material for industrial processes. Thus, the characterization and quality control of these products have always been important. Currently, in addition to their use as food, oils represent renewable energy sources for the production of biodiesel, which further reinforces the importance of
characterizing oils and assessing their quality.1
Oils are essential reagents for biodiesel production. They are composed of triglycerides, and their transesterification with short-chain alcohols produces a mixture of long-chain
monoesters (biodiesel) and glycerin as a byproduct.1-3
Characterizing oils and biodiesel is relevant for identifying fraud, contamination or adulteration, in addition
to evaluating their quality.4 The iodine value, a parameter
that characterizes oils, fats and biodiesel, indicates the
degree of unsaturation of these products.3-6
It is expected that the composition of different vegetable oils derived from the same vegetable source may vary
by geographic, climatic and other factors.7,8 However,
vegetable oils are associated with average characteristic
compositions. Therefore, it is possible to estimate a mean range for some characterizing parameters, such as the iodine value.9-11
The iodine value is a measure of the number of double
bonds in a sample. It specifies the mass of iodine (I2)
consumed per 100 g of sample.6,12 The iodine value of
oils depends on several factors, mainly on the quantity of carbon-to-carbon double bonds present in the sample. Additional factors that influence the iodine value are the storage conditions and the age of the oil, especially if the
sample has undergone oxidation processes.12
Considering that oxidation reactions also influence the iodine value, this index is directly related to another very important parameter in oils and in biodiesel, i.e.,
the oxidative stability.6,13 Oils and biodiesels with high
degrees of unsaturation, and therefore with high iodine
values, are more susceptible to oxidative degradation.5,13-16
Factors, such as high temperature and exposure to light, air and moisture, can promote the degradation of oils and
biodiesels.14-16 One of the proposed reaction mechanisms of
oxidation considers the removal of an allylic hydrogen.14-16
One of the most used procedures to determine the iodine
value is known as Wijs method.12 This method is described
in the American Oil Chemists’ Society Cd 1-25 method,17
and its use is determined by the norm EN 14111.18 It is
based on the reagent ICl dissolved in glacial acetic acid.12,18
This mixture is known as Wijs reagent or Wijs solution. Wijs method yields analytical quality, however, the use of the pertinent reagent requires careful handling because of its
toxicity.3 Moreover, this procedure is relatively expensive,
slow, and it consumes a significant amount of reagents, producing wastes that require a specific treatment before they can be discarded. These facts become important when large numbers of determinations are to be performed. Therefore, a safer, faster, greener and lower-cost procedure to determine iodine value (or other important parameters, such as the acid number)2,19,20 is desirable.21
In this work, two instrumental analytical methods are proposed to determine the iodine value; one uses mid-infrared (mid-IR) spectroscopy, and the other uses
hydrogen nuclear magnetic resonance (1H NMR). These
two techniques are widely used for the identification and characterization of organic compounds. From mid-IR spectroscopy, information is obtained about bond
vibrations, while from 1H NMR, it is possible to extract data
about the molecular, structural and geometric formulas of
organic compounds.22
It is known that oils can be formed by different types of esters. Based on this principle, Gopinath, Puhan and
Nagarajan23 built a theoretical model that used a multiple
linear regression method to predict the iodine value of different biodiesels from their fatty acid methyl ester composition. Because the composition of the different esters attached to glycerol in oils, including their unsaturations, can generate different responses in both mid-IR and
1H NMR techniques, the objective of the present work is to
correlate these responses with the iodine value to develop two different methods for determining the iodine value.
In this context, this work proposes classical multivariate
calibration with mid-IR and 1H NMR signals for
determining the iodine value. Once the multivariate model is built and updated regularly, it determines the iodine value in vegetable oils using safe and reliable procedures, while minimizing excessive experimental steps, analysis time, consumption of reagents and waste generation.
Experimental
Samples
All vegetable oils were purchased in a local market or donated by the Laboratory of Extraction, Applied
Thermodynamics and Equilibrium (Faculty of Food Engineering, Unicamp). Eleven different sources of oils
were used in this study: sunflower (Helianthus annuus),
canola (Brassica napus L. var. oleifera Moench), soybean
(Glycine max), corn (Zea mays), Brazil nut (Bertholletia
excelsia, Nobilis, Myrtaceae), cottonseed (Gossypium spp.),
rice (Oryza sativa), golden flaxseed and brown flaxseed
(Linum usitatissimum), sesame (Sesamum indicum) and a
mixed oil of sesame and toasted sesame.
Mid-IR spectra
To acquire absorption spectra, each oil sample was applied as a film between two NaCl plates. The spectra were obtained in an MB102 Bomem Fourier tranform infrared (FTIR) spectrometer using the following experimental
conditions: spectral width, 4000-600 cm-1; spectral
resolution, 0.4 cm-1; number of scans, 16. Each spectrum
was normalized from 0 to 1, dividing all points of the spectrum by the highest value, to mitigate the influence of the film thickness in signal intensities.
1H NMR spectra
All of the 1H NMR spectra were recorded in a
Bruker Avance III 500 MHz NMR spectrometer. To
obtain the spectra, 20 µL of each oil were dissolved in
600 µL of deuterated chloroform (CDCl3), containing
tetramethylsilane (TMS) as an internal reference, using the following experimental conditions: spectral width, –4.00-16.00 ppm; spectral size, 32768 points; 90º pulse,
11.75 µs; delay, 5 s and number of scans, 16.
Iodine value determination by the Wijs method (EN-14111-2003)18
An aliquot of the oil sample (0.13-0.15 g) was weighed to the nearest 0.001 g and dissolved in a 500 mL Erlenmeyer flask using 20 mL of solvent (prepared by mixing equal volumes of cyclohexane and glacial acetic acid) and 25 mL of Wijs solution. This solution was allowed to rest for 1 h in the dark with a blank prepared in the same manner except that it did not contain any sample. Then, 20 mL
of potassium iodide solution (100 g L-1) and 150 mL of
distilled water were added. Titration with standardized
0.1 mol L-1 sodium thiosulfate solution using a 50 mL
digital manual burette was carried out until the solution was a pale yellow color. Then, 3 mL of a starch solution was added. The titration was continued until the blue color
disappeared. The iodine value (g of iodine per 100 g of oil)
1 2 12.69 C (V V ) Iodine value =
m
−
(1)
where C is the exact concentration (mol L-1) of the standard
sodium thiosulfate solution; V1 is the volume (mL) of
standard sodium thiosulfate solution used for blank test;
V2 is the volume (mL) of standard sodium thiosulfate
solution used for sample titration; and m is the mass (g) of the oil sample.
Results and Discussion
The iodine values obtained by Wijs method for eleven
oil samples ranged from 97.0 to 187.1 g per 100 g of oil.
The Brazil nut oil sample presented the lowest iodine value, and the golden flaxseed oil the largest. The range between these two samples was the working range used to build the multivariable calibration model.
All of the iodine values obtained in this work are in agreement with the data given in the literature.9 In other words,
all of the iodine values are within the expected average range
for each source. For example, according to the literature9
it is expected for soybean oil an iodine value between 118 and
139 g per 100 g, and the iodine value for the sample analyzed
in this work by Wijs method was 130.4 g per 100 g.
Figures 1 and 2 show the assignments of mid-IR and
1H NMR signals, respectively.
To develop the methods using mid-IR and 1H NMR
techniques, six mid-IR signals and five 1H NMR signals
were chosen to provide further differentiation between the structures of the samples. These signals were mainly related to the double bonds, the positions of the double bonds, and the size of the carbon chains of the esters.
The wavenumbers of the selected mid-IR signals
were 721, 1465, 1651, 2854, 2925 and 3008 cm-1. The
transmittance intensity values (T) of these signals were considered as variables to build the multivariate model.
For the 1H NMR spectra, the chemical shifts of the five
selected signals were 0.99, 1.30, 2.00, 2.80 and 5.40 ppm. All of the signals in the spectra were integrated, and the integral of the signals at around 4.25 ppm was calibrated to 4.00, as those signals represent H-1 and H-3 of the glycerol, totaling four hydrogens. The calibrated values of the integral (I) of the five selected signals were used to perform the multivariate calibration. For the signal at 5.40 ppm, the resulting integral value was decreased by one unit because this signal contains the methylene hydrogen of H-2 of glycerol together with the olefinic hydrogen signals. Thus, only the olefinic hydrogens are taken into account at 5.40 ppm because the methylenic hydrogen H-2 of glycerol does not vary among samples.
For classical multivariate calibration, the data are
organized in matrices. The y matrix is a column matrix that
has the property of interest that is desired to be calibrated (in this case, the iodine value obtained by Wijs method), where each row represents one sample. As eleven oil samples were used, there are 11 rows in this matrix.
Figure 1. Assignment of observed absorption peaks in mid-IR spectra, illustrated from a spectrum of sunflower oil.
Figure 2. Assignment of hydrogens in the 1H NMR spectra, exemplified
In the X matrix, the obtained experimental data are organized for all samples (rows) for each variable
(column). Six mid-IR signals or five 1H NMR were used as
variables. The iodine value was calibrated separately using
mid-IR or 1H NMR data, which generated two methods
for determining the iodine value, each using one of the mentioned spectroscopic techniques.
Once the y and X matrices are organized, the classical
multivariable calibration is achieved by equation 2, where
β matrix represents the coefficients that define the location
of the line:24,25
y = Xβ (2)
where = 11 3 2 1 y ... y y y y , = 115 114 113 112 111 35 34 33 32 31 25 24 23 22 21 15 14 13 12 11 x x x x x 1 ... ... ... ... ... ... x x x x x 1 x x x x x 1 x x x x x 1
X and
= 5 4 3 2 1 0 β .
In this context, the objective is to find the β constant
values, and for this, it is necessary to isolate the β matrix
from the matrix calculations (equation 3):24,25
β = (XtX)-1Xty (3)
After obtaining the constants contained in this matrix, it is possible to express the iodine value based on the selected variables. Equations 4 and 5 show the general expressions
for the iodine value (IV) from the mid-IR and 1H NMR
data, respectively.
IV = β0 + β1(T721 cm-1) + β2(T1465 cm-1) + β3(T1651 cm-1) +
β4(T2854 cm-1) + β5(T2925 cm-1) + β6(T3008 cm-1) (4)
IV = β0 + β1(I5.40 ppm – 1) + β2(I2.80 ppm) + β3(I2.00 ppm) +
β4(I1.30 ppm) + β5(I0.99 ppm) (5)
where IV is the iodine value; β is a constant value
related to the variable indicated in the subindex; T is the
transmittance intensity value at the wavenumber indicated in the subindex; and I is the integration of the signal at the chemical shift indicated in the subindex.
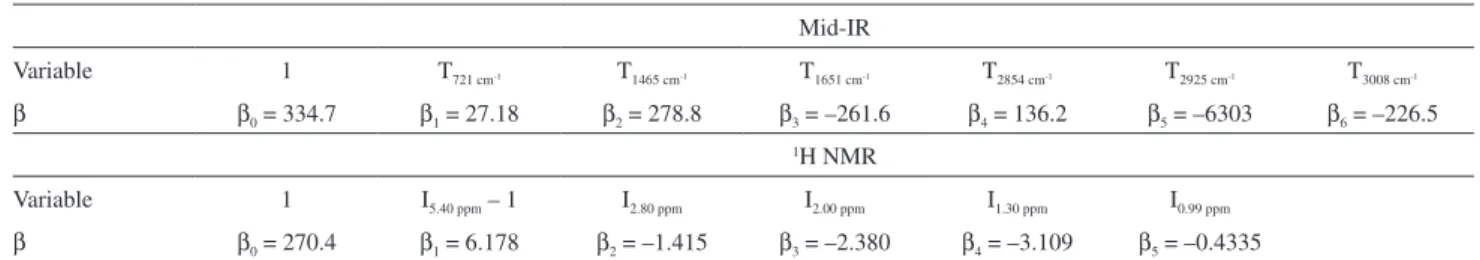
Table 1 presents the β constants values with the related
variables for the models built with the mid-IR and 1H NMR
spectra.
As the number of unsaturations in the oil increased,
the transmittance values at 1651 and 3008 cm-1 decreased
(i.e., an increase of the absorbance). This results in a higher
iodine value and it is reflected in the negative values of β3
and β6, as noted in Table 1. Moreover, the low transmittance
intensity related to the asymmetric stretching of –CH2–
groups (2925 cm-1) is also related to a higher iodine value,
as indicated by the negative β5.
The data in Table 1 show also that an increased number of olefinic hydrogens (5.40 ppm) implied an increase of
the iodine value, indicated by the positive value of β1. The
other signals contributed to a lower iodine value, especially the hydrogens from long-chain monoesters (1.30 ppm).
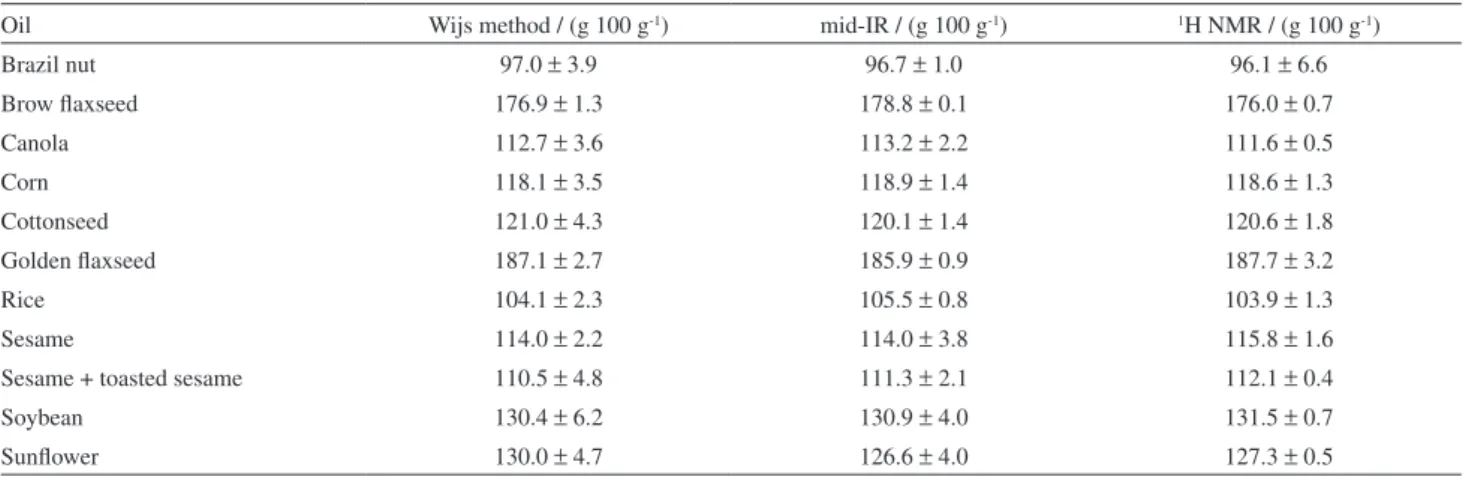
After constructing the models, the samples were tested. Table 2 shows comparisons of the results obtained by multivariate calibrations versus the results obtained by Wijs method. Table 2 lists the iodine values predicted by mid-IR
and by 1H NMR of eleven different vegetable oils, and
agreement can be observed with the results obtained by Wijs method.
The accuracy of the two proposed methods was verified by calculating the relative error of each sample, considering the results obtained by the Wijs method as the true values. The mid-IR method showed results with differences in relation to the Wijs method between zero and 2.6% and
the 1H NMR method between 0.2 and 2.1%. In terms of
precision, the Wijs method generated results with relative standard deviation (RSD) ranging from 0.7 to 4.8% (mean
RSD = 3.0%), while the range for the mid-IR and 1H NMR
methods were 0.1 to 3.3% (mean RSD = 1.7%) and 0.4 to 6.9% (mean RSD = 1.5%), respectively.
The statistical paired Student’s t-test at a 95%
confidence level was performed, and the results (Table 3) indicate complete agreement between both of the two
Table 1. β constant values, with the respective related variables, for multivariate calibration obtained from mid-IR spectra and from 1H NMR spectra
Mid-IR
Variable 1 T721 cm-1 T1465 cm-1 T1651 cm-1 T2854 cm-1 T2925 cm-1 T3008 cm-1
β β0 = 334.7 β1 = 27.18 β2 = 278.8 β3 = –261.6 β4 = 136.2 β5 = –6303 β6 = –226.5
1H NMR
Variable 1 I5.40 ppm – 1 I2.80 ppm I2.00 ppm I1.30 ppm I0.99 ppm
β β0 = 270.4 β1 = 6.178 β2 = –1.415 β3 = –2.380 β4 = –3.109 β5 = –0.4335
T: Transmittance intensity value at the wavenumber indicated in the subindex; I: integration of the signal at the chemical shift indicated in the subindex;
proposed methods and Wijs method. Snedecor’s F-test (Table 3) shows that, considering the mean of the relative standard deviation, the proposed methods tended to be more precise than the Wijs procedure.
The t calculated values that are shown in Table 3 clearly indicate that, at the confidence level of 95%, all results obtained with the two proposed methods were statistically equivalent to the results obtained with Wijs method. With respect to the precision, some high F values were observed: brow flaxseed for the comparison with mid-IR; and canola, sesame + toasted sesame, soybean
and sunflower for the comparison with 1H NMR. In all of
those cases, the high F values were consequences of the results obtained with Wijs method having higher standard deviations, meaning that the proposed methods were more precise than Wijs method.
The results show the adequacy of the multivariate
calibrations constructed from mid-IR and 1H NMR data.
In order to confirm the adequacy of the model, an analysis of the variance was performed according to Barros Neto,
Scarminio and Bruns24 and Box and Draper,25 considering
each regression as a whole.
Assuming that errors follow a normal distribution, the mean squares can be used to test whether the regression equation is statistically significant. When β = 0, there is no
correlation between X and y, and it has been demonstrated
that the ratio of the mean squares follows an F distribution (equation 6):24,25
) , ( r R
R
F MS MS
r
ν ν
≈ (6)
where MSR is the mean square related to regression; MSr
is the mean square related to residual; ν
R is the degree
of freedom related to regression; and ν
r is the degree of
freedom related to residual. Table 2. Iodine value predicted by mid-IR and by 1H NMR, and iodine value by Wijs method
Oil Wijs method / (g 100 g-1) mid-IR / (g 100 g-1) 1H NMR / (g 100 g-1)
Brazil nut 97.0 ± 3.9 96.7 ± 1.0 96.1 ± 6.6
Brow flaxseed 176.9 ± 1.3 178.8 ± 0.1 176.0 ± 0.7
Canola 112.7 ± 3.6 113.2 ± 2.2 111.6 ± 0.5
Corn 118.1 ± 3.5 118.9 ± 1.4 118.6 ± 1.3
Cottonseed 121.0 ± 4.3 120.1 ± 1.4 120.6 ± 1.8
Golden flaxseed 187.1 ± 2.7 185.9 ± 0.9 187.7 ± 3.2
Rice 104.1 ± 2.3 105.5 ± 0.8 103.9 ± 1.3
Sesame 114.0 ± 2.2 114.0 ± 3.8 115.8 ± 1.6
Sesame + toasted sesame 110.5 ± 4.8 111.3 ± 2.1 112.1 ± 0.4
Soybean 130.4 ± 6.2 130.9 ± 4.0 131.5 ± 0.7
Sunflower 130.0 ± 4.7 126.6 ± 4.0 127.3 ± 0.5
Table 3. Results from Snedecor’s F-test and Student’s t-test, with n = 3 and confidence level (1 – α) = 0.95 Oil
Wijs method mid-IR Wijs method 1H NMR
Calculated Calculated
F = sa2 / s
b2 t F = sa2 / sb2 t
Brazil nut 15 0.11 2.9 0.17
Brow flaxseed 169 2.03 3.4 0.85
Canola 2.7 0.17 52 0.43
Corn 6.3 0.30 7.2 0.19
Cottonseed 9.4 0.28 5.7 0.12
Golden flaxseed 9.0 0.60 1.4 0.20
Rice 8.3 0.82 3.1 0.11
Sesame 3.0 0.00 1.9 0.94
Sesame + toasted sesame 5.2 0.22 144 0.47
Soybean 2.4 0.10 78 0.25
Sunflower 1.4 0.78 88 0.81
As equation 6 is only valid for β = 0, this null hypothesis
can be tested by using the calculated value of MSR / MSr
and comparing it with tabled values at an appropriate confidence level. If it is verified that MSR / MSr > F, the
hypothesis of β = 0 must be discarded, showing that there
is enough evidence that a linear correlation exists between the variables X and y.24,25
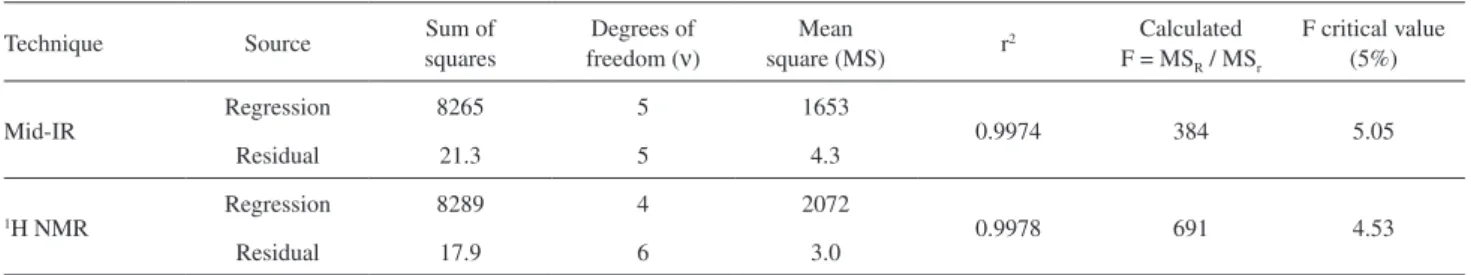
All of the analysis of variance results are presented in Table 4. The multivariable correlations provided as
coefficient of determination (r2) 0.9974 and 0.9978 for
mid-IR and 1H NMR, respectively.
Both of the constructed regressions have a higher value
of MSR / MSr compared with the F critical value at a 95%
confidence level, indicating that the regression equations are statistically significant. However, a correlation considered as significant by the F-test is not always useful for making predictions because the range of variation covered by the studied factors could be too small. The regression is useful
for making predictions when MSR / MSr is at least ten times
the value of the F distribution with the appropriate degrees
of freedom at the selected confidence level.24,25
The calculated F for the regression by mid-IR was more than 76 times the F critical value, and for the regression by
1H NMR, this number was even higher, 152 times larger
than its respective F critical value. Thus, in addition to the regression equations being statistically significant, both of the regressions are considered useful for making predictions.
All these results demonstrate that the multivariate
calibration models with mid-IR or 1H NMR can be a safe
and reliable alternative to Wijs method. A comparison among the three methods reveals that the two proposed methods are much faster, use a smaller amount of reagents/solvents and generate less waste compared with Wijs method. Therefore, the proposed methods can be considered to adhere to the principles of green chemistry.
There are other reports in the literature involving iodine
value determination by 1H NMR,4,5,27 although they do not
consider the experimental values obtained by Wijs method. The iodine value determination is based on a theoretical
average molar mass derived from 1H NMR.4,5,27 While
these methods do not require a calibration curve, they may predict different results compared with those obtained by Wijs method. This difference can occur because not every double bond is reactive to iodine (conjugated double
bonds are not),3 but all olefinic hydrogens are sensitive to
1H NMR spectroscopy. The proposed method using 1H NMR
reported here does not encounter this problem because the experimental iodine value (obtained by Wijs method) is considered in the multivariable regression.
Other methods that use mid-IR or near-IR to determine iodine value are also reported in the literature; however, they employ more sophisticated calculations from chemometrics
tools, which require appropriate software.28-32
Conclusions
This study demonstrated correlations between mid-IR
and 1H NMR data with iodine values. Once the model
(with mid-IR or 1H NMR) was built and implemented, the
model demonstrated several advantages compared with Wijs method, such as the readiness of analysis with the possibility of automating the system, significant reduction in reagent consumption, and consequently low waste generation, all of which emphasize the green character of the methods.
Both multivariate calibrations have been shown to perform well and represent simple alternative methods of determining iodine value. Moreover, with mid-IR and
1H NMR techniques, it is still possible to extract additional
information on the character and quality of the oil samples. We highlight the results with mid-IR because this is a technique with a relatively low-cost spectrometer and low maintenance costs, and it is not necessary to solubilize the
sample, unlike with 1H NMR.
Acknowledgements
The authors are grateful to CNPq and FAPESP for financial support. The authors also thank the Laboratory of Extraction, Applied Thermodynamics and Equilibrium (Faculty of Food Engineering, Unicamp) for the donated oils.
Table 4. Analysis of variance for adjusting of the built linear models
Technique Source Sum of
squares
Degrees of freedom (ν)
Mean
square (MS) r
2 Calculated
F = MSR / MSr
F critical value (5%)
Mid-IR
Regression 8265 5 1653
0.9974 384 5.05
Residual 21.3 5 4.3
1H NMR
Regression 8289 4 2072
0.9978 691 4.53
References
1. Knothe, G.; Dunn, R. O. In Industrial Uses of Vegetable Oils; Erhan, S. Z., ed.; American Oil Chemists’ Society: Champaign, 2005, pp. 42.
2. Tubino, M.; Aricetti, J. A.; J. Braz. Chem. Soc.2013, 24, 1691. 3. Tubino, M.; Aricetti, J. A.; Fuel2013, 103, 1158.
4. Oromí-Farrús, M.; Villorbina, G.; Eras, J.; Gatius, F.; Torres, M.; Canela, R.; Fuel 2010, 89, 3489.
5. Kumar, R.; Bansal, V.; Patel, M. B.; Sarpal, A. S.; Energy Fuels
2012, 26, 7005.
6. Knothe, G.; J. Am. Oil Chem. Soc.2002, 79, 847.
7. Morrison, H. J.; Bosart, L. W.; J. Am. Oil Chem. Soc.1926, 3, 130.
8. Stansbury, M. F.; Hoffpauir, C. L.; Hopper, T. H.; J. Am. Oil Chem. Soc.1953, 30, 120.
9. Firestone, D.; Physical and Chemical Characteristics of Oils, Fats, and Waxes, 2nd ed.; American Oil Chemists’ Society: Champaign, 2006.
10. Bailey, A. V.; Harris, J. A.; Skau, E. L.; J. Am. Oil Chem. Soc.
1967, 44, 117.
11. Stansbury, M. F.; Hoffpauir, C. L.; J. Am. Oil Chem. Soc.1952,
29, 53.
12. Baltes, J. In Analysis and Characterization of Oils, Fats and Fat Products; Boekenoogen, H. A., ed.; Interscience: London, 1964, pp. 1.
13. Hoekman, S. K.; Broch, A.; Robbins, C.; Ceniceros, E.; Nataranja, M.; Renewable Sustainable Energy Rev.2012, 16, 143.
14. Frankel, E. N.; J. Am. Oil Chem. Soc.1984, 61, 1908. 15. Frankel, E. N.; Prog. Lipid Res.1980, 19, 1.
16. Farmer, E. H.; Bloomfield, G. G.; Sundralingam, S.; Sutton, D. A.; Trans. Faraday Soc.1942, 38, 348.
17. American Oil Chemists’ Society; Iodine Values of Fats and Oils - Wijs Method, American Oils Chemists’ Society: Champaign, 1998, pp. 1.
18. EN 14111: Fat and Oil Derivatives - Fatty Acid Methyl Esters (FAME) - Determination of Iodine Value, European Committee for Standardization, Berlin, 2003.
19. Knothe, G.; Kenar, J. A.; Eur. J. Lipid Sci. Technol.2004, 106, 88.
20. Tubino, M.; Aricetti, J. A.; Maciel, J. A. S.; Lopes, O.; J. ASTM Int.2010, 7, 102516.
21. Tubino, M.; Aricetti, J. A.; J. Am. Oil Chem. Soc.2012, 89, 2113.
22. Silverstein, R. M.; Webster, F. X.; Kiemle, D. J.; Spectrometric Identification of Organic Compounds, 7th ed.; John Wiley: New York, 2005.
23. Gopinath, A.; Puhan, S.; Nagarajan, G.; Renewable Energy
2008, 34, 1806.
24. Barros Neto, B.; Scarminio, I. S.; Bruns, R. E.; Como Fazer Experimentos, 4th ed.; Bookman: Porto Alegre, 2010. 25. Box, G. E. P.; Draper, N. R.; Empirical Model-Building and
Response Surfaces; Wiley: New York, 1987.
26. Eckschlager, K.; Errors, Measurement and Results in Chemical Analysis; Van Nostrand Reinhold: London, 1969.
27. Miyake, Y.; Yokomizo, K.; Matsuzaki, N.; J. Am. Oil Chem. Soc.1998, 75, 15.
28. Triyasmono, L.; Riyanto, S.; Rohman, A.; Int. Food Res. J.
2013, 20, 3259.
29. Balabin, R. M.; Safieva, R. Z.; Energy Fuels2011, 25, 2373. 30. Baptista, P.; Felizardo, P.; Menezes, J. C.; Correia, M. J. N.;
Talanta2008, 77, 144.
31. Cox, R.; Lebrasseur, J.; Michiels, E.; Buijs, H.; Li, H.; Van de Voort, F. R.; Ismail, A. A.; Sedman, J.; J. Am. Oil Chem. Soc.
2000, 77, 1229.
32. Che Man, Y. B.; Setiowaty, G.; Van de Voort, F. R.; J. Am. Oil Chem. Soc. 1999, 76, 693.
Submitted: February 27, 2015
Published online: May 5, 2015