Article
J. Braz. Chem. Soc., Vol. 26, No. 2, 297-309, 2015. Printed in Brazil - ©2015 Sociedade Brasileira de Química 0103 - 5053 $6.00+0.00
A
*e-mail: [email protected]
Interlaboratory Comparison of Quantifying Hydrocarbons and Trace Elements in
Sediment Samples from a Tropical Estuary
Adriana H. Nudi,*,a Angela Wagener,a Irene T. Gabardo,b Rafael A. Lourençob and Arthur Scofielda
aDepartamento de Química, Pontifícia Universidade Católica do Rio de Janeiro (PUC-Rio),
R. Marquês de São Vicente, 225, 22453-900 Rio de Janeiro-RJ, Brazil
bCENPES/PETROBRAS, Av. Horácio Macedo, 950, Cidade Universitária,
21941-915 Rio de Janeiro-RJ, Brazil
The Marine and Environmental Studies Laboratory at PUC-Rio, in partnership with the PETROBRAS R&D Center (Brazil), conducted an interlaboratory comparison of aliphatic and aromatic hydrocarbons and trace element determinations. The goal of this study was to produce a homogeneous and stable material and obtain consensus concentration values for its use as a reference material (RM) for sediments from tropical regions. The prepared material is adequate for use as a reference material because it has remained stable (Test F, ANOVA, p < 0.05) since its preparation in 2007. In this study, several alkylated polycyclic aromatic hydrocarbon (PAH) compounds were included, and the resulting dispersion was the same order of magnitude as the parental PAH (16 PAH USEPA).
Keywords: reference material, interlaboratory study, petroleum hydrocarbon, trace elements
Introduction
Polycyclic aromatic hydrocarbons (PAHs), n-alkanes, and other aliphatic hydrocarbons, have been used as indicators of oil and incomplete combustion residues in the marine environment. In addition, PAHs are considered as contaminants of special concern due to the carcinogenic and mutagenic properties of some of its components.1,2 Metals and metalloids are components that occur naturally in the environment. In addition, metals and metalloids have historically been released in the environment due to human activities. Unlike organic pollutants, which can be degraded into less harmful components through biological or chemical processes, trace elements are non-degradable. Thus, trace elements can accumulate in sediments and act as sources of natural or anthropogenic disturbances. The effects of metal pollution in the environment can be substantial and long lasting. More importantly, toxic metals can enter the food chain and adversely affect humans when contaminated seafood is consumed.3
The process of quantifying organic and inorganic trace substances is complex because they are present in
environmental matrices at low concentrations and include a broad spectrum of components or species that must be identified and quantified individually. In addition, environmental matrices are complex and require the use of careful procedures and methods with very low detection limits. Thus, laboratory intercomparisons represent an essential method for validating methods and verifying the accuracy of results. Accuracy and precision are critical when analyzing hydrocarbons and trace-metals in environmental samples when assessing and monitoring coastal and/or ocean environments.
As in many other countries, laboratories in Brazil depend on reference materials (RMs) prepared in North America, Europe or Japan to apply such quality control. In addition to the inherent barriers for importing them, these RMs are based on the matrices of temperate climates and often have geochemical characteristics that differ from those of tropical regions.
the consensus values of these materials can be made available to universities, research centers and commercial laboratories. The prepared sediment sample (SED 001) was distributed to several regional and international laboratories in February 2008. The procedures used for preparing this material were based on ISO Guide 354 andVilleneuve et al.5 The preparation steps for the reference material included the selection of a sampling site containing sediments with the characteristics of interest (presence of hydrocarbons and trace-elements at detectable quantities), particulate size reduction, homogenization and distribution in glass bottles (the three last steps were performed by CETEM Mineral Technology Center, RJ, Brazil).
The aim of this study was to produce a reference material that could be used for calibrating analytical procedures for quantifying petroleum hydrocarbons and trace elements. To accomplish this task, the participants were requested to report the individual n-alkane contents, the isoprenoids pristane and phytane contents, the total resolved and unresolved aliphatic contents, and the individual polycyclic aromatic hydrocarbon contents (16 Environmental Protection Agency (EPA)-priority PAHs: naphthalene (N), acenaphthylene (Acen), acenaphthene (Ace), fluorene (F), phenanthrene (Ph), anthracene (Ant), fluoranthene (Fl), chrysene (Ch), pyrene (P), benzo(a)pyrene (BaP), benz(a)anthracene, (BaAnt), benzo(b)fluoranthene (BbFl), benzo(k)fluoranthene (BkFl), indeno(1,2,3-c,d)pyrene (IP), dibenz(a,h)anthracene (DBAnt), benzo(ghi)perylene (BghiPe); and also, perylene (Pe), dibenzothiophene (DBT), benzo(e)pyrene (BeP); the five series of alkylated homologues: naphthalenes (C1N, C2N, C3N and C4N), fluorenes (C1F, C2F and C3F), phenanthrenes (C1Ph, C2Ph, C3Ph and C4Ph), dibenzothiophenes (C1DBT, C2 DBT and C3DBT), chrysenes (C1Ch and C2Ch) and pyrenes (C1P and C2P)).
For trace elements, the participant laboratories were requested to report the individual metal concentrations using three different digestion methods: (i) 1.0 mol L-1 HCl – a milder extraction that provides almost all bioavailable elements;6 (ii) EPA 3050b7 (concentrated HNO
3 treatment) – which does not allow total digestion but also releases bioavailable elements; and (iii) EPA 30528 (HNO
3 + HF) – which performs total digestion. The targeted elements included Mg, Al, Ca, V, Cr, Mn, Fe, Co, Ni, Cu, Zn, As, Sr, Cd, Sn, Sb, Ba, Hg and Pb. The trace elements were chosen based on their environmental importance and the interests of the petroleum industry. Three different methods were provided so that each laboratory could perform the trace element determination using at least one method.
The requested methodology for determining hydrocarbons and trace elements would be established
based on the routines of the respective participating laboratories.
Experimental
Sample preparation
A sufficiently large amount of sediment (130 kg wet weight) was collected from Guanabara Bay, Rio de Janeiro, after screening the initial sampling site (coordinates: –43.087910 and –22.765130). The material was collected using a Van Veen sampler in containers that were previously decontaminated using acetone and dichloromethane. The collected material was stored in a refrigeration unit until the beginning of the process steps. To this batch, the following preparation procedures were applied: freeze-drying, grinding, and sieving through a 75 µm stainless steel sieve. The fraction smaller than 75 µm was homogenized in a stainless steel rotating drum (200 L), followed by stepwise separation and packing using a stainless steel rotating separator with 12 collectors. The obtained aliquots contained approximately 40 g of sediments. These aliquots were stored in glass bottles with aluminum screw caps and sealed with Teflon tape.
Homogeneity test
The homogeneity of the material was initially assessed by determining the concentrations of the hydrocarbons (n = 10) and trace elements (n = 13) in the sediment samples from different glass bottles. The F test was used to evaluate the homogeneity between the different bottles and within each bottle (analysis of variance (ANOVA); software SPSS 8.0).4 A preliminary PAH analysis was conducted at the Laboratory of Marine and Environmental Studies (LABMAM) using EPA method 8270D (gas chromatography-mass spectrometry (GC-MS)). In contrast, the trace element determinations were performed at the Laboratory of Atomic Spectrometry (LABSPECTRO) using EPA method 3050 (inductively coupled plasma-optical emission spectrometry (ICP-OES)). All samples were analyzed in triplicate. Both laboratories are part of the Department of Chemistry at PUC-Rio.
Stability study
Moisture content
The initial moisture content established for the material was 3.95 ± 0.05% (n = 10). With time, the moisture contents were determined from aliquots of the lyophilized material by drying in an oven at 105 ºC to a constant weight. Currently, the moisture content is 4.00 ± 0.05%.
Information regarding the shipping and data return
In February 2008, 42 bottles of sediment sample (SED 001) were distributed to laboratories that responded positively to the invitation letters, which were forwarded to 100 labs. In addition, a sample description and general instructions for analysis were included.
This study followed the structure suggested by Carvalho et al.9 Participants were requested to analyze hydrocarbons and trace metals by using the current techniques and methods that were applied in their laboratories. In addition, participants were also requested to perform three separate determinations for each analyte and to include a short description of their methods with the results (extraction, clean up, gas chromatographic conditions, etc.). For this purpose, a reporting form was attached to the information sheet. The concentrations were reported as net values (i.e., after correcting based on a blank, moisture content, etc.), with as many significant figures as justified by the precision of the method. For each group of targeted substances, the participants were requested to report the average weights of the samples that were taken for analysis, the moisture content, the methods used to confirm the identities of the
compounds, the calculations used for the results, a summary of the quality control procedures that were routinely employed in the laboratory, the arithmetic mean value and the relative standard deviations (in percentage) of their determinations.
Results and Discussion
Homogeneity test
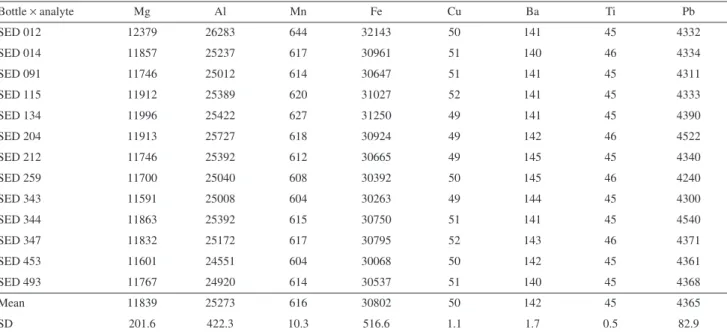
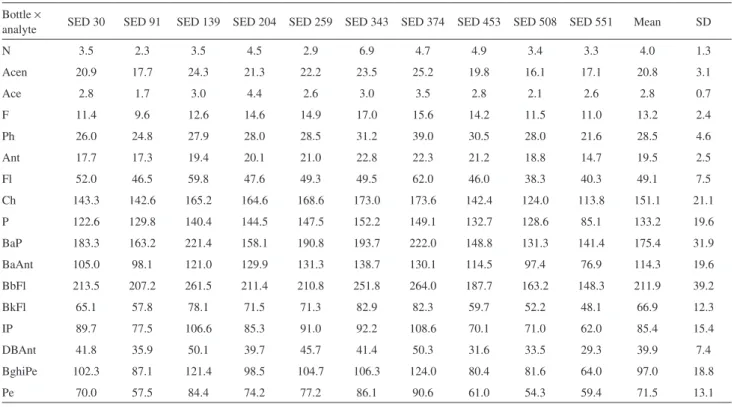
The results and the statistical analyses (F test (ANOVA); SPSS 8.0 applied for evaluating the homogeneity) indicated that the SED 001 could be considered as homogeneous between the bottles and within each bottle. The material did not show any significant inhomogeneity (F = MSB / MSW < Fcrit for α = 5%, where MSB and MSW are the mean squares between and within-bottles, respectively).4 Tables 1 and 2 show the preliminary results for the trace elements and hydrocarbons (mean and standard deviation (SD)), respectively.
Stability study
Several determinations were performed following the production of the sediment samples (n = 10) to assess the stability of the material (SED 001). Table 3 shows the results produced by LABMAM between 2007 and 2014 for some analytes. The results showed that the material is stable under actual conditions (F test, ANOVA, p < 0.05). The bottles were stored in the laboratory at a temperature of 21.0 ± 1.0 °C.
Table 1. Trace element results of the homogeneity test. Mean values (triplicate) from each vial are expressed in mg kg-1, dry weight
Bottle × analyte Mg Al Mn Fe Cu Ba Ti Pb
SED 012 12379 26283 644 32143 50 141 45 4332
SED 014 11857 25237 617 30961 51 140 46 4334
SED 091 11746 25012 614 30647 51 141 45 4311
SED 115 11912 25389 620 31027 52 141 45 4333
SED 134 11996 25422 627 31250 49 141 45 4390
SED 204 11913 25727 618 30924 49 142 46 4522
SED 212 11746 25392 612 30665 49 145 45 4340
SED 259 11700 25040 608 30392 50 145 46 4240
SED 343 11591 25008 604 30263 49 144 45 4300
SED 344 11863 25392 615 30750 51 141 45 4540
SED 347 11832 25172 617 30795 52 143 46 4371
SED 453 11601 24551 604 30068 50 142 45 4361
SED 493 11767 24920 614 30537 51 140 45 4368
Mean 11839 25273 616 30802 50 142 45 4365
Data summary
Forty two laboratories agreed to participate, and only 27 laboratories returned their results. Of these laboratories, 8 provided data for both hydrocarbons and trace elements, 11
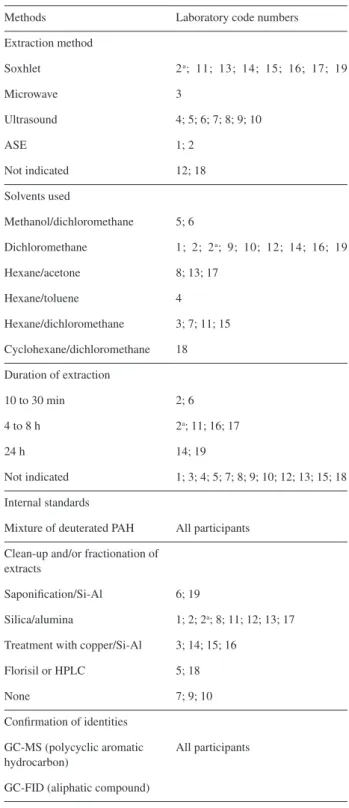
only provided results for hydrocarbons, and 8 only provided results for trace elements. Each laboratory was identified by a code number to preserve anonymity. The analytical methods that were used by the participants for petroleum hydrocarbon analysis, including the pre-treatment of the
Table 2. Results of the homogeneity test for PAH. Mean values (triplicate) from each vial are expressed in µg kg-1, dry weight
Bottle ×
analyte SED 30 SED 91 SED 139 SED 204 SED 259 SED 343 SED 374 SED 453 SED 508 SED 551 Mean SD
N 3.5 2.3 3.5 4.5 2.9 6.9 4.7 4.9 3.4 3.3 4.0 1.3
Acen 20.9 17.7 24.3 21.3 22.2 23.5 25.2 19.8 16.1 17.1 20.8 3.1
Ace 2.8 1.7 3.0 4.4 2.6 3.0 3.5 2.8 2.1 2.6 2.8 0.7
F 11.4 9.6 12.6 14.6 14.9 17.0 15.6 14.2 11.5 11.0 13.2 2.4
Ph 26.0 24.8 27.9 28.0 28.5 31.2 39.0 30.5 28.0 21.6 28.5 4.6
Ant 17.7 17.3 19.4 20.1 21.0 22.8 22.3 21.2 18.8 14.7 19.5 2.5
Fl 52.0 46.5 59.8 47.6 49.3 49.5 62.0 46.0 38.3 40.3 49.1 7.5
Ch 143.3 142.6 165.2 164.6 168.6 173.0 173.6 142.4 124.0 113.8 151.1 21.1
P 122.6 129.8 140.4 144.5 147.5 152.2 149.1 132.7 128.6 85.1 133.2 19.6
BaP 183.3 163.2 221.4 158.1 190.8 193.7 222.0 148.8 131.3 141.4 175.4 31.9
BaAnt 105.0 98.1 121.0 129.9 131.3 138.7 130.1 114.5 97.4 76.9 114.3 19.6
BbFl 213.5 207.2 261.5 211.4 210.8 251.8 264.0 187.7 163.2 148.3 211.9 39.2
BkFl 65.1 57.8 78.1 71.5 71.3 82.9 82.3 59.7 52.2 48.1 66.9 12.3
IP 89.7 77.5 106.6 85.3 91.0 92.2 108.6 70.1 71.0 62.0 85.4 15.4
DBAnt 41.8 35.9 50.1 39.7 45.7 41.4 50.3 31.6 33.5 29.3 39.9 7.4
BghiPe 102.3 87.1 121.4 98.5 104.7 106.3 124.0 80.4 81.6 64.0 97.0 18.8
Pe 70.0 57.5 84.4 74.2 77.2 86.1 90.6 61.0 54.3 59.4 71.5 13.1
Table 3. Results of the stability study for PAH, data analyses and sample size. Values are expressed in µg kg-1, dry weight
Data analyses
Apr 07 (n = 10)
May 07 (n = 5)
Aug 07 (n = 10)
Sep 07 (n = 5)
Aug 08 (n = 5)
Feb 11 (n = 3)
Sep 12 (n = 3)
Oct 12 (n = 3)
Jan 13 (n = 10)
Jan 14
(n = 3) Mean SD
Acen 23.2 31.5 22.9 22.5 24.5 18.0 19.9 18.3 27.7 19.2 22.8 4.3
DBT 9.3 11.3 9.2 9.0 9.7 6.1 8.0 8.6 8.2 6.4 8.6 1.5
Ph 31.3 38.3 31.2 35.4 29.7 27.9 26.8 35.4 33.8 29.0 31.9 3.7
Ant 21.4 27.0 21.4 20.0 18.6 12.8 13.5 12.2 16.9 16.0 18.0 4.6
Fl 54.9 69.1 54.2 69.6 51.9 74.3 64.1 72.1 82.7 69.3 66.2 9.9
P 145.9 164.0 145.9 144.6 160.9 122.1 139.5 169.6 106.8 153.0 145.2 19.1
BaAnt 125.7 144.2 124.7 123.7 119.9 82.7 81.8 66.1 91.3 76.0 103.6 26.8
Ch 167.0 215.3 166.4 189.1 175.8 114.3 44.5 49.9 59.0 109.0 129.0 62.4
BbFl 236.1 276.2 231.0 297.8 195.1 129.6 117.1 161.8 153.2 93.1 189.1 69.4
BkFl 74.3 92.5 73.1 74.8 54.5 62.2 37.9 48.8 78.0 38.4 63.5 18.2
BeP 149.8 198.0 146.5 187.9 206.7 131.4 119.7 185.6 136.5 138.1 160.0 31.3
BaP 196.0 259.7 192.5 276.0 178.7 108.2 82.3 98.0 107.1 146.2 164.5 67.9
Pe 79.7 108.6 78.6 98.0 57.9 62.0 38.0 35.6 59.0 18.7 63.6 28.3
IP 95.1 117.9 93.9 134.0 115.3 117.2 76.0 89.1 75.1 94.6 100.8 19.4
DBAnt 44.3 56.6 44.0 52.7 56.2 59.2 37.3 53.7 38.6 47.8 49.0 7.8
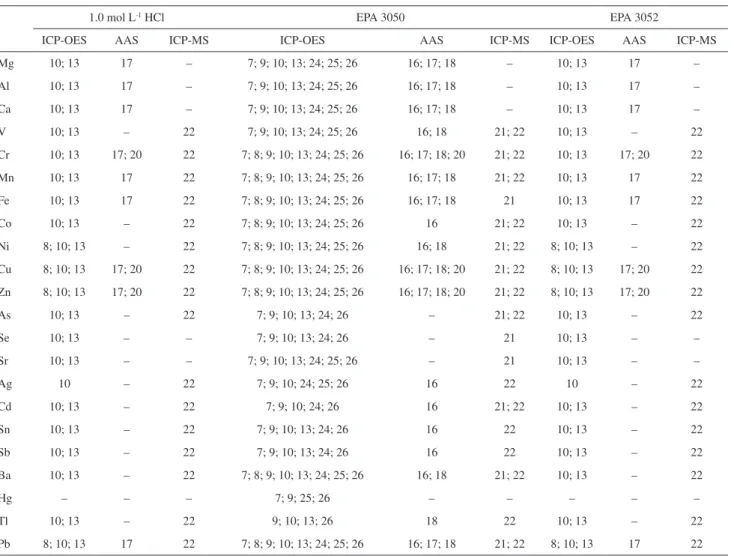
sample and the GC conditions, are given in Table 4. For trace elements (Table 5), the methods of quantification used by the laboratories ICP-OES, atomic absorption spectrometry (AAS), inductively coupled plasma mass spectrometry (ICP-MS), and neutron activation analysis (INAA).
Statistical evaluation
Results were considered acceptable when they were obtained from laboratories that reported a minimum of three replicates. The laboratories that only reported one or two replicates were disregarded. The range, mean, and standard deviation values for each analyte were based on the reported laboratory means. Next, the outliers were removed using Grubbs test, and the range, mean and standard deviation were recalculated.
To determine the laboratory performances, z-scores10,11 were calculated according to the following equation:
z=(xi– xa)/ sb (1)
where xi is the mean of the reported analyte concentrations in the samples from each laboratory; xa is the assigned value (a mean value of the acceptable results in the intercomparison run); and sb is the target standard deviation.10 The z-score is based on the properties of a normal distribution. These values express the performance of each laboratory and its deviation relative to the average results. The performance is considered acceptable if /z/ < 2. The measurement is regarded as out of control when /z/ > 3. This score represents a simple method for providing each participant with a normalized performance score for bias. This procedure has been accepted as a standard procedure by ISO/IUPAC.12-14 In addition, this calculation accounted for the variations of repeatability (which estimate the variation in a single laboratory over a short period of time) and reproducibility (which estimate the variations of the measurements between the laboratories).10
Criteria for assigning a reference material
Data for many of the analytes were sufficiently grouped to characterize the sediment samples as a reference material. The criteria used in the certification of petroleum hydrocarbon are presented by Villeneuve et al.5 and Carvalho et al.,9 i.e., (i) for a range of PAH concentrations. In this case, the relative uncertainty of the overall median does not exceed the following limits: > 10,000 µg kg-1 (30%), 1,000-10,000 µg kg-1 (50%), 100-1,000 µg kg-1 (60%),
10-100 µg kg-1 (80%) and < 10 µg kg-1 (100%). Furthermore, (ii) the overall mean is based on the data obtained by at least two different methods. (iii) The relative number of
Table 4. Summary of methods used for quantifying the petroleum hydrocarbons (aromatic and aliphatic compounds) in sediment sample SED 001
Methods Laboratory code numbers
Extraction method
Soxhlet 2a; 11; 13; 14; 15; 16; 17; 19
Microwave 3
Ultrasound 4; 5; 6; 7; 8; 9; 10
ASE 1; 2
Not indicated 12; 18
Solvents used
Methanol/dichloromethane 5; 6
Dichloromethane 1; 2; 2a; 9; 10; 12; 14; 16; 19
Hexane/acetone 8; 13; 17
Hexane/toluene 4
Hexane/dichloromethane 3; 7; 11; 15
Cyclohexane/dichloromethane 18
Duration of extraction
10 to 30 min 2; 6
4 to 8 h 2a; 11; 16; 17
24 h 14; 19
Not indicated 1; 3; 4; 5; 7; 8; 9; 10; 12; 13; 15; 18
Internal standards
Mixture of deuterated PAH All participants
Clean-up and/or fractionation of extracts
Saponification/Si-Al 6; 19
Silica/alumina 1; 2; 2a; 8; 11; 12; 13; 17
Treatment with copper/Si-Al 3; 14; 15; 16
Florisil or HPLC 5; 18
None 7; 9; 10
Confirmation of identities
GC-MS (polycyclic aromatic hydrocarbon)
All participants
GC-FID (aliphatic compound)
aLaboratory that performed the determination using two methods.
laboratory means that were rejected as outliers did not exceed (a) 20% or (b) 50%. Finally, (iv) the overall mean was calculated based on the following number (or more) of laboratory means: (a) 10 or (b) 5. Based on these criteria, the certification classifications for aliphatic and aromatic hydrocarbons are provided in Tables 6 and 7, respectively, and can be defined as follows:
Class A: when all criteria are met; Class B: when criteria i, ii, iiib, and iva or i, ii, iiia, and ivb are met; and Class C: when at least three laboratories give results that reasonably agree with each other.
These tables provide information regarding the final results, including the consensus values, the standard deviations, the numbers of participants who reported the concentrations of each substance, and the classification obtained by the analyte.5
For trace elements, the consensus values are presented in Table 8 for the three different digestion methods that were used (after verifying the outliers). We only
considered the analytes for which at least three replicates were reported.
General remarks regarding the intercomparison of the hydrocarbons and trace elements
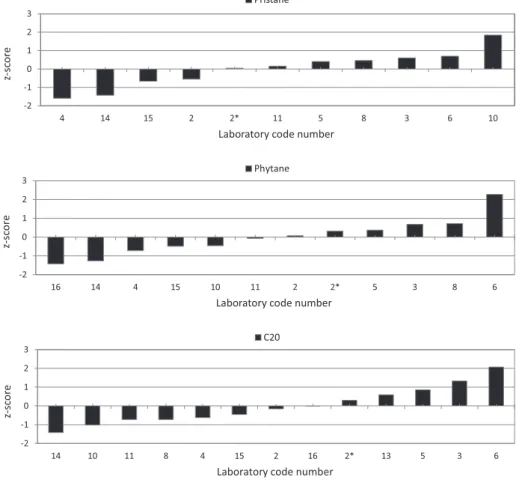
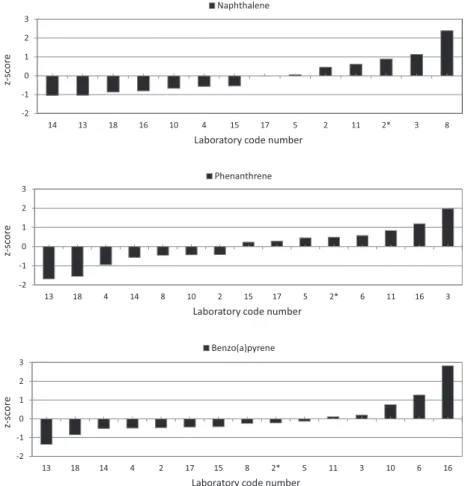
Overall, 19 laboratories provided data for hydrocarbons. Among these laboratories, only two did not report results for aliphatic compounds. Three of these laboratories only sent one analysis result and were excluded from the final evaluation. Generally, 64% of the laboratories indicated at least one outlier when determining the aliphatic hydrocarbon content, and 68% of the laboratories presented at least one outlier when determining the PAH content. Some laboratories did not report any correction for soil moisture content. The performance assessed by the z-score was satisfactory for all laboratories. Despite the large variability that is inherent to the intercomparison exercise, the typology of the n-alkanes and the PAH was
Table 5. Summary of the methods used for quantifying the elements in sediment sample SED 001. Laboratory code numbers and the instrumental methods used in each procedure
1.0 mol L-1 HCl EPA 3050 EPA 3052
ICP-OES AAS ICP-MS ICP-OES AAS ICP-MS ICP-OES AAS ICP-MS
Mg 10; 13 17 – 7; 9; 10; 13; 24; 25; 26 16; 17; 18 – 10; 13 17 –
Al 10; 13 17 – 7; 9; 10; 13; 24; 25; 26 16; 17; 18 – 10; 13 17 –
Ca 10; 13 17 – 7; 9; 10; 13; 24; 25; 26 16; 17; 18 – 10; 13 17 –
V 10; 13 – 22 7; 9; 10; 13; 24; 25; 26 16; 18 21; 22 10; 13 – 22
Cr 10; 13 17; 20 22 7; 8; 9; 10; 13; 24; 25; 26 16; 17; 18; 20 21; 22 10; 13 17; 20 22
Mn 10; 13 17 22 7; 8; 9; 10; 13; 24; 25; 26 16; 17; 18 21; 22 10; 13 17 22
Fe 10; 13 17 22 7; 8; 9; 10; 13; 24; 25; 26 16; 17; 18 21 10; 13 17 22
Co 10; 13 – 22 7; 8; 9; 10; 13; 24; 25; 26 16 21; 22 10; 13 – 22
Ni 8; 10; 13 – 22 7; 8; 9; 10; 13; 24; 25; 26 16; 18 21; 22 8; 10; 13 – 22
Cu 8; 10; 13 17; 20 22 7; 8; 9; 10; 13; 24; 25; 26 16; 17; 18; 20 21; 22 8; 10; 13 17; 20 22
Zn 8; 10; 13 17; 20 22 7; 8; 9; 10; 13; 24; 25; 26 16; 17; 18; 20 21; 22 8; 10; 13 17; 20 22
As 10; 13 – 22 7; 9; 10; 13; 24; 26 – 21; 22 10; 13 – 22
Se 10; 13 – – 7; 9; 10; 13; 24; 26 – 21 10; 13 – –
Sr 10; 13 – – 7; 9; 10; 13; 24; 25; 26 – 21 10; 13 – –
Ag 10 – 22 7; 9; 10; 24; 25; 26 16 22 10 – 22
Cd 10; 13 – 22 7; 9; 10; 24; 26 16 21; 22 10; 13 – 22
Sn 10; 13 – 22 7; 9; 10; 13; 24; 26 16 22 10; 13 – 22
Sb 10; 13 – 22 7; 9; 10; 13; 24; 26 16 22 10; 13 – 22
Ba 10; 13 – 22 7; 8; 9; 10; 13; 24; 25; 26 16; 18 21; 22 10; 13 – 22
Hg – – – 7; 9; 25; 26 – – – – –
Tl 10; 13 – 22 9; 10; 13; 26 18 22 10; 13 – 22
As expected, the results obtained for the trace elements using the different digestion methods showed a gradient that was related to the efficiency of the procedure. Milder digestion (with HCl)6 resulted in lower concentrations than the samples analyzed by the two other methods, EPA method 3050B7 (concentrated HNO
3 treatment) and EPA method 30528 (HNO
3 + HF). Similarly to the hydrocarbons, the z-scores for the metals were satisfactory. Three laboratories (or 25%) reported outlier values for the methods using 1 mol L-1 HCl, 15% reported outlier values when using EPA method 3050B, and 33% reported outliers when using EPA method 3052. Figure 3 shows some of these results.
Comparison of SED 001 with other materials
Table 9 shows the results and standard deviations that were obtained in the current study (SED 001) and those reported for two commercial reference materials (NIST 1941b14 and IAEA-43515). The data variability observed in this study was in the same range as the variabilities reported for other materials prepared by specialized groups in this area. In fact, the reference materials are classified into two groups, reference materials (RMs) and certified reference materials (CRMs). In the second group, the traceability chain is much larger and should generally present lower variability.
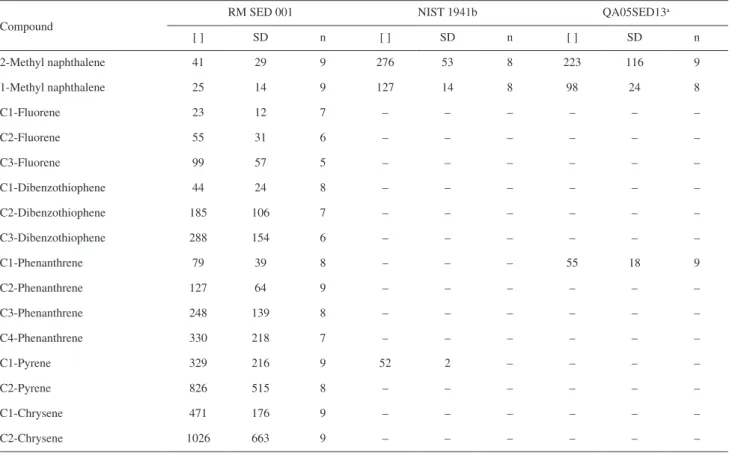
Very few reference materials report alkylated compound contents. In this study, the results obtained for alkylated PAH are of similar quality to those reported for the 16 PAHs. In addition, no increase in variation was observed due to the limited availability of commercial standards for alkylated compounds and due to the different approaches used to determine their concentrations (Table 10). Exceptions occurred for the lighter alkylated PAHs, such as alkyl naphthalene and alkyl phenanthrene, which presented higher variation. In addition, the higher molecular mass homologues tended to show larger variability, which was potentially derived from the growing uncertainty in defining the area in the ion chromatogram when transitioning from C0 to Cn compounds.
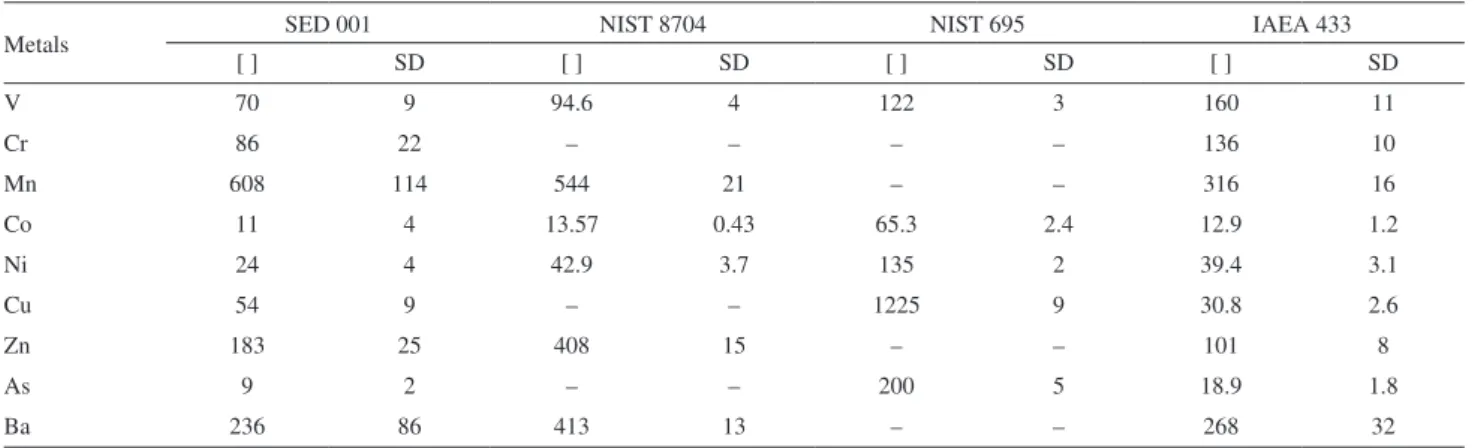
Table 11 shows the results for trace elements in the current study (SED 001 by EPA 3052 method8) and of other commercial reference materials (NIST 8704,16 NIST 695,17 and IAEA-43318). The range of the results for the reference material (SED 001) was 4.0 to 25%, which was higher than the range presented by NIST RM 8704 (from 3.0 to 8.0%), NIST 695 (from 0 to 4.0%) and IAEA 433 (5.0 to 12.0%).
A list of laboratories that participated in this study is presented in Table 12.
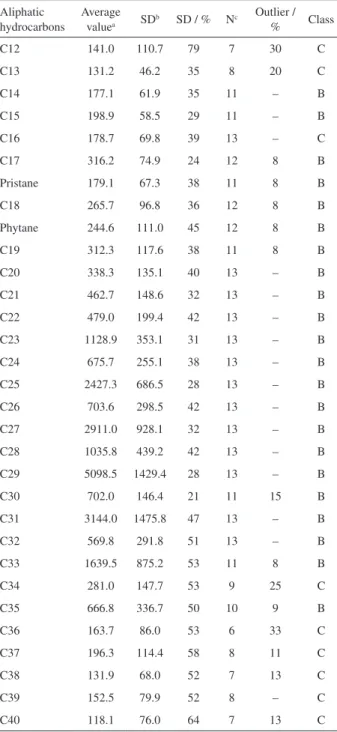
Table 6. Aliphatic compounds, dry weight basis. The results are expressed in µg kg-1
Aliphatic hydrocarbons
Average valuea SD
b SD / % Nc Outlier /
% Class
C12 141.0 110.7 79 7 30 C
C13 131.2 46.2 35 8 20 C
C14 177.1 61.9 35 11 – B
C15 198.9 58.5 29 11 – B
C16 178.7 69.8 39 13 – C
C17 316.2 74.9 24 12 8 B
Pristane 179.1 67.3 38 11 8 B
C18 265.7 96.8 36 12 8 B
Phytane 244.6 111.0 45 12 8 B
C19 312.3 117.6 38 11 8 B
C20 338.3 135.1 40 13 – B
C21 462.7 148.6 32 13 – B
C22 479.0 199.4 42 13 – B
C23 1128.9 353.1 31 13 – B
C24 675.7 255.1 38 13 – B
C25 2427.3 686.5 28 13 – B
C26 703.6 298.5 42 13 – B
C27 2911.0 928.1 32 13 – B
C28 1035.8 439.2 42 13 – B
C29 5098.5 1429.4 28 13 – B
C30 702.0 146.4 21 11 15 B
C31 3144.0 1475.8 47 13 – B
C32 569.8 291.8 51 13 – B
C33 1639.5 875.2 53 11 8 B
C34 281.0 147.7 53 9 25 C
C35 666.8 336.7 50 10 9 B
C36 163.7 86.0 53 6 33 C
C37 196.3 114.4 58 8 11 C
C38 131.9 68.0 52 7 13 C
C39 152.5 79.9 52 8 – C
C40 118.1 76.0 64 7 13 C
aAverage values are expressed on a dry weight basis; bstandard deviation; cnumber of accepted laboratory means that were used for calculating the
recommended values and the standard deviation.
preserved. In Figures 1 and 2, both classes of compound are shown for the data obtained in this study. This result shows that the RM SED 001 is suitable for calibrating laboratory procedures that target the appraisal of hydrocarbon sources.
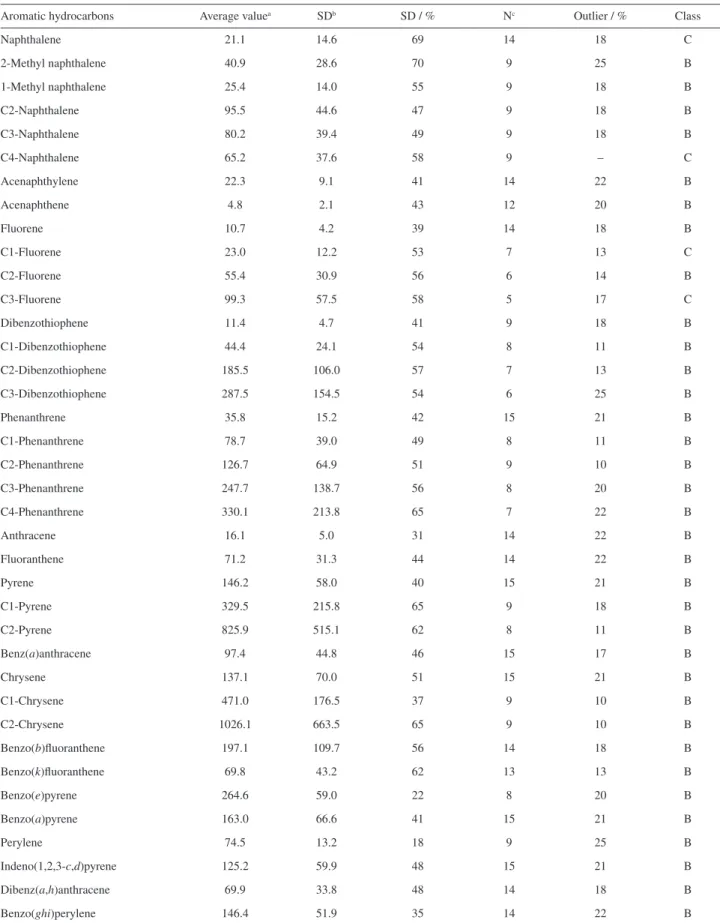
Table 7. Aromatic hydrocarbons, dry weight basis. The results are expressed in µg kg-1
Aromatic hydrocarbons Average valuea SDb SD / % Nc Outlier / % Class
Naphthalene 21.1 14.6 69 14 18 C
2-Methyl naphthalene 40.9 28.6 70 9 25 B
1-Methyl naphthalene 25.4 14.0 55 9 18 B
C2-Naphthalene 95.5 44.6 47 9 18 B
C3-Naphthalene 80.2 39.4 49 9 18 B
C4-Naphthalene 65.2 37.6 58 9 – C
Acenaphthylene 22.3 9.1 41 14 22 B
Acenaphthene 4.8 2.1 43 12 20 B
Fluorene 10.7 4.2 39 14 18 B
C1-Fluorene 23.0 12.2 53 7 13 C
C2-Fluorene 55.4 30.9 56 6 14 B
C3-Fluorene 99.3 57.5 58 5 17 C
Dibenzothiophene 11.4 4.7 41 9 18 B
C1-Dibenzothiophene 44.4 24.1 54 8 11 B
C2-Dibenzothiophene 185.5 106.0 57 7 13 B
C3-Dibenzothiophene 287.5 154.5 54 6 25 B
Phenanthrene 35.8 15.2 42 15 21 B
C1-Phenanthrene 78.7 39.0 49 8 11 B
C2-Phenanthrene 126.7 64.9 51 9 10 B
C3-Phenanthrene 247.7 138.7 56 8 20 B
C4-Phenanthrene 330.1 213.8 65 7 22 B
Anthracene 16.1 5.0 31 14 22 B
Fluoranthene 71.2 31.3 44 14 22 B
Pyrene 146.2 58.0 40 15 21 B
C1-Pyrene 329.5 215.8 65 9 18 B
C2-Pyrene 825.9 515.1 62 8 11 B
Benz(a)anthracene 97.4 44.8 46 15 17 B
Chrysene 137.1 70.0 51 15 21 B
C1-Chrysene 471.0 176.5 37 9 10 B
C2-Chrysene 1026.1 663.5 65 9 10 B
Benzo(b)fluoranthene 197.1 109.7 56 14 18 B
Benzo(k)fluoranthene 69.8 43.2 62 13 13 B
Benzo(e)pyrene 264.6 59.0 22 8 20 B
Benzo(a)pyrene 163.0 66.6 41 15 21 B
Perylene 74.5 13.2 18 9 25 B
Indeno(1,2,3-c,d)pyrene 125.2 59.9 48 15 21 B
Dibenz(a,h)anthracene 69.9 33.8 48 14 18 B
Benzo(ghi)perylene 146.4 51.9 35 14 22 B
aAverage values are expressed on a dry weight basis; bstandard deviation; cnumber of accepted laboratory means that were used in calculating the
Figure 1. z-Scores for the aliphatic hydrocarbons in sediment sample SED 001. 2*: Laboratory that performed the determination using two methods.
-2 -1 0 1 2 3
4 14 15 2 2* 11 5 8 3 6 10
z-sc
or
e
Laboratory code number
Pristane
-2 -1 0 1 2 3
16 14 4 15 10 11 2 2* 5 3 8 6
z-sc
or
e
Laboratory code number
Phytane
-2 -1 0 1 2 3
14 10 11 8 4 15 2 16 2* 13 5 3 6
z-sc
or
e
Laboratory code number
C20
Table 8. Trace elements, dry weight basis. The results are expressed in mg kg-1
1.0 mol L-1 HCl method EPA methods 3050B or 3051 EPA method 3052
Average
valuea SDb SD / % Nc
Outlier / %
Average
valuea SDb SD / % Nc
Outlier / %
Average
valuea SDb SD / % Nc
Outlier / %
Mg 8576 3211 37 6 – 11319 3244 29 11 – 11338 1716 15 4 –
Al 7904 4936 62 6 – 35916 14135 39 11 – 64789 7314 11 5 –
Ca 5435 1925 35 5 – 5481 3075 56 10 – 7561 623 8 4 –
V 20.9 14.9 71 5 – 48.7 13.7 28 9 – 69.5 9.1 13 5 17
Cr 44.6 37.3 84 7 – 66.1 13.5 20 14 – 85.7 22.7 26 8 –
Mn 395.1 86.0 22 7 – 572.5 74.3 13 13 – 607.6 114.7 19 6 –
Fe 18739 10833 58 8 – 33519 5154 15 13 7 38146 3803 10 7 –
Co 3.4 2.8 83 7 – 6.5 2.0 30 11 – 11.2 3.7 33 6 –
Ni 8.6 4.5 53 7 – 18.6 3.8 20 11 – 24.0 3.8 16 5 –
Cu 25.4 15.1 59 9 – 47.9 7.3 15 12 8 54.3 8.7 16 6 14
Zn 123.4 46.3 38 10 – 152.8 21.3 14 14 7 183.4 25.0 14 8 –
As 4.3 2.6 60 6 – 6.2 3.3 53 8 11 9.4 2.4 26 6 14
Cd 0.4 0.2 40 4 20 0.9 0.7 74 8 – – – – – –
Ba 23.7 16.4 69 6 14 55.4 16.4 30 11 15 236.5 86 36 5 –
Pb 29.9 4.1 14 7 12 37.2 9.2 25 13 – 41.3 4.3 10 4 –
aAverage values are expressed on a dry weight basis; bstandard deviation; cnumber of accepted laboratory means that were used in calculating the
Figure 3. z-Scores for the trace-elements in sediment sample SED 001. Methods: (a) 1.0 mol L-1 HCl; (b) EPA 3050B or 3051 and (c) EPA 3052. Results
obtained for Cr and Zn (n = 7, n = 14 and n = 8, respectively). 2*: Laboratory that performed the determination using two methods. -3 -2 -1 0 1 2 3
13 12 10 25 17 20 23
z-sc
or
e
Laboratory code number
Cr (a) -3 -2 -1 0 1 2 3
13 12 10 8 25 17 26 22 20 23
z-sc
or
e
Laboratory code number
Zn (a) -2 -1 0 1 2 3
10 18 12 9 7 17 8 16 13 20 24 22 25 23
z-sc
or
e
Laboratory code number
Cr (b) -3 -2 -1 0 1 2 3
10 9 26 13 12 20 8 22 18 25 7 17 24 23
z-sc
or
e
Laboratory code number
Zn (b) -3 -2 -1 0 1 2 3
13 4 2* 20 23 8 10 22
z-sc
or
e
Laboratory code number
Cr (c) -3 -2 -1 0 1 2 3
13 10 4 20 23 2* 22 8
z-sc
or
e
Laboratory code number
Zn (c)
Figure 2. z-Scores for the aromatic hydrocarbons in sediment sample SED 001. 2*: Laboratory that performed the determination using two methods.
-2 -1 0 1 2 3
14 13 18 16 10 4 15 17 5 2 11 2* 3 8
z-sc
or
e
Laboratory code number
Naphthalene -2 -1 0 1 2 3
13 18 4 14 8 10 2 15 17 5 2* 6 11 16 3
z-sc
or
e
Laboratory code number
Phenanthrene -2 -1 0 1 2 3
13 18 14 4 2 17 15 8 2* 5 11 3 10 6 16
z-sc
or
e
Laboratory code number
Table 9. Comparison of SED 001 with the other reference materials. The results are expressed in µg kg-1
Compound
NIST 1941b SED 001 IAEA-435
[ ] SD [ ] SD [ ] SD
Naphthalene 848 95 21 14 7.8 6
Fluorene 85 15 11 4 1.6 1
Phenanthrene 406 44 36 15 8.4 5
Anthracene 184 18 16 5 7.9 10
Fluoranthene 651 50 71 31 3.9 4
Pyrene 581 39 146 58 11 15
Benz(a)anthracene 335 25 97 45 3.4 4
Chrysene 291 31 137 70 2.8 2.6
Benz(b)fluoranthene 453 21 197 110 1.8 2.1
Benz(k)fluoranthene 225 18 70 43 – –
Benz(e)pyrene 325 25 265 59 23 28
Benz(a)pyrene 358 17 163 67 26 42
Perylene 397 45 75 13 – –
Benz(ghi)perylene 307 45 146 52 0.89 0.65
Indeno(1,2,3-c,d)pyrene 341 57 125 60 2.2 2.6
Table 10. Results for the alkylated compounds in SED 001. The results are expressed in µg kg-1
Compound
RM SED 001 NIST 1941b QA05SED13a
[ ] SD n [ ] SD n [ ] SD n
2-Methyl naphthalene 41 29 9 276 53 8 223 116 9
1-Methyl naphthalene 25 14 9 127 14 8 98 24 8
C1-Fluorene 23 12 7 – – – – – –
C2-Fluorene 55 31 6 – – – – – –
C3-Fluorene 99 57 5 – – – – – –
C1-Dibenzothiophene 44 24 8 – – – – – –
C2-Dibenzothiophene 185 106 7 – – – – – –
C3-Dibenzothiophene 288 154 6 – – – – – –
C1-Phenanthrene 79 39 8 – – – 55 18 9
C2-Phenanthrene 127 64 9 – – – – – –
C3-Phenanthrene 248 139 8 – – – – – –
C4-Phenanthrene 330 218 7 – – – – – –
C1-Pyrene 329 216 9 52 2 – – – –
C2-Pyrene 826 515 8 – – – – – –
C1-Chrysene 471 176 9 – – – – – –
C2-Chrysene 1026 663 9 – – – – – –
Table 11. Comparison of SED 001 with other reference materials. The results are expressed in µg kg-1
Metals SED 001 NIST 8704 NIST 695 IAEA 433
[ ] SD [ ] SD [ ] SD [ ] SD
V 70 9 94.6 4 122 3 160 11
Cr 86 22 – – – – 136 10
Mn 608 114 544 21 – – 316 16
Co 11 4 13.57 0.43 65.3 2.4 12.9 1.2
Ni 24 4 42.9 3.7 135 2 39.4 3.1
Cu 54 9 – – 1225 9 30.8 2.6
Zn 183 25 408 15 – – 101 8
As 9 2 – – 200 5 18.9 1.8
Ba 236 86 413 13 – – 268 32
Table 12. List of participants
Laboratory Country Results for
Analytical Solutions, RJ Brazil PAH /metal
Analytical Technology, SP Brazil PAH / metal
Bioagri Ambiental, SP Brazil PAH / metal
CEDRE France PAH
CONECO, FURG, RS Brazil PAH
Departamento de Geociências, Universidade de Aveiro Portugal PAH / metal
Departamento de Geologia e Recursos Naturais, Unicamp, SP Brazil Metal
Fisheries Research Services Marine Laboratory, Aberdeen Scotland PAH
Hidroquímica, FURG, RS Brazil Metal
Geochemical, MG Brazil PAH / metal
IAEA / MEL Monaco PAH / metal
Innolab, RJ Brazil PAH
Institute of Chemical and Environmental Research (ID / EA), Barcelona Spain PAH
Laboratório de Química Orgânica Marinha, Instituto Oceanográfico, USP, SP Brazil PAH
Laboratório de Análise por Ativação com Nêutrons, IPEN, SP Brazil Metal
Laboratório de Análises Ambientais, UFPR, PR Brazil PAH / metal
Laboratório de Biogeoquímica Ambiental / LBGqA, UFSCar, SP Brazil PAH / metal
Laboratório de Meio Ambiente, Centro de Tecnologia de Gás, CTGas, RN Brazil PAH / metal
Laboratório de Química, CENA USP, Piracicaba, SP Brazil Metal
LaGOM, UERJ, RJ Brazil PAH
LAQA, Tecpar, PR Brazil Metal
LQAO, CENPES-Petrobras, RJ Brazil PAH
Laboratório de Estudos Marinhos e Ambientais (LABMAM), PUC-Rio, RJ Brazil PAH
Labspectro, PUC-Rio, RJ Brazil Metal
SENAI-CIC/CETSAM, Laboratórios Ambientais, PR Brazil PAH
UFSC, SC Brazil Metal
Conclusions
The produced material is suitable for use as a reference material in processes that require routine quality control
Each laboratory should examine their performance while considering the intended use of the analytical results. The laboratories that obtained results that were further away from the expected value should carefully check their analytical procedures.
Acknowledgements
We are deeply grateful to Dr. Jean-Pierre Villeneuve, whose invaluable collaboration in the initial phase of this study was key to guaranteeing a successful outcome. We are also grateful to Dr. Maria Alice Goes from Centro de Tecnologia Mineral (CETEM) for collaboration and to all of the colleagues and laboratories that agreed to collaborate in this study and made it possible to make RM SED 001 available.
References
1. Neff, J. M.; Polycyclic Aromatic Hydrocarbons in the Aquatic
Environment - Sources, Fates and Biological Effects; Applied
Science Publishers LTD: London, 1979.
2. Bjorseth, A.; Ramdahl, T. In Handbook of Polycyclic Aromatic
Hydrocarbons, vol. 2; Bjorseth, A.; Ramdahl, T., eds.; Marcel
Dekker: New York, 1985, ch. 1.
3. Wang, W. X.; Yan, Q. L.; Fan, W. H.; Xu, Y.; Mar. Ecol.: Prog. Ser.2002, 240, 27.
4. ISO Guide 35: Reference Materials: General and Statistical
Principles for Certification, ISO: Geneva, 2006, pp. 64.
5. Villeneuve, J. P.; Mora, S.; Cattini, C.; TrAc, Trends Anal. Chem.
2004, 23, 469.
6. Australian and New Zealand Environment and Conservation
Council (ANZECC); Australian and New Zealand Guidelines
for Fresh and Marine Water Quality, ANZECC/Agriculture and
Resource Management Council of Australia and New Zealand: Camberra, 2000.
7. http://www.epa.gov/epawaste/hazard/testmethods/sw846/ pdfs/3050b.pdf accessed in November 2014.
8. http://www.epa.gov/epawaste/hazard/testmethods/sw846/ pdfs/3052.pdf accessed in November 2014.
9. Carvalho, F. P.; Villeneuve, J. P.; Cattini, C.; TrAC, Trends Anal.
Chem.1999, 18, 656.
10. Prichard, E.; Barwick, V.; Quality Assurance in Analytical
Chemistry, 1st ed.; Wiley-Interscience: London, 2007.
11. Chui, Q. S. H.; Quim. Nova2004, 27, 993.
12. Miller, J. C.; Miller, J. N.; Statistics for Analytical Chemistry, 2nd ed.; Ellis Horwood Limited: York, 1988.
13. Thompson, M.; Wood, R.; Pure Appl. Chem. 1993, 65, 2123. 14. https://www-s.nist.gov/srmors/view_detail.cfm?srm=1941b
accessed in November 2014.
15. International Atomic Energy Agency (IAEA)-435, Report No. 78: World-Wide and Regional Intercomparison for the Determination of Organochlorinated Compounds and
Petroleum Hydrocarbons in Tuna Homogenate, IAEA Marine
Environment Laboratory: Monaco, 2006.
16. https://www-s.nist.gov/srmors/view_detail.cfm?srm=8704 accessed in November 2014.
17. https://www-s.nist.gov/srmors/view_detail.cfm?srm=695 accessed in November 2014.
18. http://www.iaea.org/nael/refmaterial/iaea433.pdf accessed in November 2014.
Submitted: June 13, 2014