Simultaneous optimization by neuro-genetic approach for analysis of plant materials
by laser induced breakdown spectroscopy
☆
Lidiane Cristina Nunes
a,b, Gilmare Antônia da Silva
c, Lilian Cristina Trevizan
b, Dario Santos Júnior
d,
Ronei Jesus Poppi
e, Francisco José Krug
b,⁎
aDepartamento de Química, Universidade Federal de São Carlos, Rodovia Washington Luís, km 235, 13565-905, São Carlos, SP, Brazil bCentro de Energia Nuclear na Agricultura, Universidade de São Paulo, Av. Centenário 303, 13416-000, Piracicaba, SP, Brazil cDepartamento de Quimica, Universidade Federal de Ouro Preto, Morro do Cruzeiro S/N, 35400-000, Ouro Preto, MG, Brazil dUniversidade Federal de São Paulo
—UNIFESP, Rua Prof. Artur Riedel 275, 09972-270, Diadema, SP, Brazil
eInstituto de Química, Universidade Estadual de Campinas, Caixa Postal 6154, 13084-971, Campinas, SP, Brazil
a b s t r a c t
a r t i c l e
i n f o
Article history:
Received 31 October 2008 Accepted 6 May 2009 Available online 13 May 2009
Keywords:
Laser induced breakdown spectroscopy (LIBS) Plant analysis
Bayesian regularized neural network Genetic algorithm
Simultaneous optimization
A simultaneous optimization strategy based on a neuro-genetic approach is proposed for selection of laser induced breakdown spectroscopy operational conditions for the simultaneous determination of macro-nutrients (Ca, Mg and P), micro-macro-nutrients (B, Cu, Fe, Mn and Zn), Al and Si in plant samples. A laser induced breakdown spectroscopy system equipped with a 10 Hz Q-switched Nd:YAG laser (12 ns, 532 nm, 140 mJ) and an Echelle spectrometer with intensified coupled-charge device was used. Integration time gate, delay time, amplification gain and number of pulses were optimized. Pellets of spinach leaves (NIST 1570a) were employed as laboratory samples. In order tofind a model that could correlate laser induced breakdown spectroscopy operational conditions with compromised high peak areas of all elements simultaneously, a Bayesian Regularized Artificial Neural Network approach was employed. Subsequently, a genetic algorithm was applied tofind optimal conditions for the neural network model, in an approach called neuro-genetic. A single laser induced breakdown spectroscopy working condition that maximizes peak areas of all elements simultaneously, was obtained with the following optimized parameters: 9.0 µs integration time gate, 1.1 µs delay time, 225 (a.u.) amplification gain and 30 accumulated laser pulses. The proposed approach is a useful and a suitable tool for the optimization process of such a complex analytical problem.
© 2009 Elsevier B.V. All rights reserved.
1. Introduction
The determination of macro- and micro-nutrients in plant materials is frequently recommended for evaluation of the nutritional status of crops of economic interest. Essential elements play a decisive role in plant nutrition and can affect crop yields when they are not present in appropriate concentrations.
Laser induced breakdown spectroscopy (LIBS) is a useful technique for analysis of solid samples of environmental and geological interest. One of the major advantages of LIBS is that only minimal or no sample preparation is required. Rapid multielemental analysis can be carried out in situ; qualitative and quantitative determination of elements can be carried out in various test environments[1,2].
There is a lack of information for LIBS analysis of agricultural samples. Sun et al.[1]evaluated LIBS for the determination of some
micro-nutrients (Fe, Cu, Mn, and Zn) as well as macro-nutrients (P, Ca, and Mg) in powdered leaf samples applied directly on a double-sided tape on a glass slide. Most recently a LIBS system furnished with a Nd: YAG at 1064 nm was evaluated in our laboratory for the determination of macro and micro-nutrients in plant materials[3,4]using pellets of certified reference materials (CRM) for calibration. Results of the analysis of different plant samples carried out by LIBS compared reasonably with those obtained by inductively coupled plasma optical emission spectrometry (ICP OES) after wet acid digestion. An fs-LIBS was also evaluated for the determination of Ca, Cu, Fe, K, Mg, Na and P in animal tissues[5]; however, the optimal experimental parameters for LIBS implementation have not yet been found, and consequently, there is a large need for methodical experimental optimization.
Some variables that can influence LIBS measurements are laser related (i.e. wavelength, energy, pulse duration and shot-to-shot powerfluctuation), focusing spot size, ambient conditions, physical properties of the sample, amplification detector gain, ambient atmo-sphere, pressure and the detection window (delay time, integration time gate)[6]. In fact, the analytical performance of LIBS methods depends strongly on the choice of experimental conditions, which have to be studied in each particular application. Optimization of LIBS ☆ This paper was presented at the 10th Rio Symposium on Atomic Spectrometry, held
in Salvador-Bahia, Brazil, 7–12 September 2008, and is published in the special issue of Spectrochimica Acta Part B, dedicated to that conference.
⁎Corresponding author. Fax: +55 19 34294610.
E-mail address:[email protected](F.J. Krug).
0584-8547/$–see front matter © 2009 Elsevier B.V. All rights reserved. doi:10.1016/j.sab.2009.05.002
Contents lists available atScienceDirect
Spectrochimica Acta Part B
methods is habitually performed by univariated procedures[7,8–13]
and little has been reported on multivariate procedures [14–16]. Conventional optimization through univariate methodology requires a great amount of experiments and is time consuming; moreover, interactions between variables are not evaluated. Another aspect is the fact that applying univariate procedures, it will be rarely possible to reach really optimized values. Multivariate techniques are alter-native, economical and effective methods that allow the simultaneous optimization of more than one variable.
These multivariate statistical methods most used in chemistry can be conveniently classified according to how one decides which experiments are to be executed. All methods require the user to supply minimum and maximum values for each factor that defines the experimental domain to be investigated during the optimization procedure. Optimization procedures are frequently performed by experimental designs. The most commonly used designs to determine response surfaces are the full and fractional factorial and the more complex central composite[17], Box–Behnken[18], Doehlert[19,20] and mixture designs[21].
Doehlert design was applied in the optimization of the factors affecting LIBS performance for analysis of samples on planet Mars[14]. Experimental designs arranged according to Doehlert matrixes are useful to generate the necessary data, demanding fewer experiments and the quantity of the levels related to each factor can be selected in order to obtain more information about significant or problematic factors [22,23]. If several responses are being investigated, other approaches are extremely useful, especially those that allow the simultaneous modeling. In multi-response procedures, artificial neural network (ANN) approaches are very interesting alternatives because they provide one model for all responses, macro- and micro-nutrients and Al and Si, and that this model cannot be written in closed algebraic form. The main chemical applications of ANN, the theory and the type of learning scheme for their use have been reviewed by Zupan and Gasteiger[24].
2. Multivariate approaches
Artificial neural network is a computational modeling tool that consists of groups of highly interconnected processing elements called neurons. The neurons are arranged in one input layer (independent variables), one output layer (dependent variables), and several hidden layers that associate the inputs with outputs. A neuron collects a series of input signals and transforms them into the output signal via a transfer function[25].
During the network general training process, weights (w) and bias (b) for each connection output value are obtained as close as possible to the actual outputs, minimizing the error function given by Eq.(1):
E= Xp m= 1
Xn
k= 1 ym
;k−tm;k
2
ð1Þ
wheretis the target value;yis the predicted value (net output);nis the number of experiments in training set andpis the number of dependent variables or number of responses to be optimized. The correction is continued until the error function converges to a mini-mum. Improvement of generalization is generally obtained by the use of large data sets, where all possible data examples are presented to the network; however, in some situations, the acquisition of large data sets is difficult or even impossible[26,27].
A method for improving generalization without using large data sets is the regularization. In this method, a modification of the error function (Eq.(1)) is accomplished by adding a term that consists of the mean of the sum of squares of the network weights and biases (Eq.(2)):
Freg=γE+ 1ð −γÞmsw ð2Þ
whereγis the performance ratio andmswis given by the relation expressed in Eq.(3):
msw=1 n
Xn
j= 1
w2j ð3Þ
Weights and bias can be assumed as random variables with specified distributions. In this case, Bayesian regularized artificial neural network (BRANN) is used. This model considers all possible values of network parameters weighted by the probability of each set of weights. Bayesian methods are complementary to neural networks as they overcome the tendency of an over-flexible network to discover nonexistent, or overly complex, data models. Other drawbacks include long training times, possibility of over-trained sets and loss of an explicit function to model the system can be cincumvented[26–28].
ANN have been used for response surface modelling[29,30]and
they provided several benefits as compared with conventional
optimization techniques. They do not require the determination of a model expressible in a close mathematical form, and they can result in better generalisations, as they are able to model complex relation-ships. However the neural networks can only model the system and another algorithm is necessary to optimize the established model. Genetic algorithm (GA) can be an interesting way in this task. General information on genetic algorithms can be found in reference[31].
The GA routine utilized in this work demands a function that will be optimized by the algorithm. It was found that the loss-minimiza-tion funcloss-minimiza-tion[32](Eq.(4)), calculated from the sum of the weighted relative deviations, is the most suitable alternative:
u= Xm
i= 1
wi Q xð1;x2;: : :;xnÞ−Q4 Q4
2
ð4Þ
whereφ is the loss-minimization function;wiis the weight factor withi= 1,2,…,mandmis the number of objectives, or in this case, the number of elements. The term Q(x1,x2,…,xn) corresponds to the
objective function and n indicates the number of independent
variables. The objective function is the output values of the trained
BRANN. Q⁎ corresponds to the individual optimum value of the
objective function, defined as the maximum peak area possible for each element studied. In this case, the GA algorithm will try to minimize the loss functionφ.
GA can define the ideal conditions (maximum or minimum) from the model developed by the neural network, generating a hybrid approach named neuro-genetic [26]. In analytical chemistry, the neuro-genetic approach has been successfully applied for optimiza-tion of operaoptimiza-tional condioptimiza-tions in analytical chromatographic proce-dures[27]. In LIBS neural network have been applied to analysis of metals and painted metals[33]and of soils[34]. However, the aim of these works was for LIBS classification purposes. To our best knowl-edge, there is no work in the literature dealing with the use of ANN for the optimization of LIBS operation conditions.
According to all the facts described, the purpose of this work was to develop a strategy based on neuro-genetic approach to simulta-neously optimize LIBS operational conditions for the determination of macro-nutrients (Ca, Mg and P), micro-nutrients (B, Cu, Fe, Mn and Zn), Al and Si in plant materials by using a commercially available LIBS system equipped with a Nd:YAG at 532 nm. Effects of integration time gate, delay time, amplification gain and number of accumulated laser pulses were evaluated through Doehlert design for definition of significant variables. A model considering all peak areas simulta-neously was determined by neural network and the genetic algorithm was used tofind the LIBS operation conditions where all peaks express compromised maximum area values.
3. Experimental
3.1. LIBS instrumentation
Experiments were carried out with a LIBS system from Laser Technique Berlin (LTB) equipped with a 10 Hz Q-switched Nd:YAG laser (CFR200, Quantel, France) operating at 532 nm and generating 12 ns (FWHM) pulses of 140 mJ. Due to the optical setup of the LIBS system approximately 70 mJ reach the sample surface generating fluence of 35 J/cm2. An Aryelle–Butter
fly ICCD-echelle spectrometer with f/10 numerical aperture and 400 mm focal length were employed. Two wavelength regions can be used: VUV range (180 to 440 nm) and UV–VIS–NIR range (278 to 820 nm). Spectral resolution capabilities are 35,000 and 15,000 respectively for the VUV and UV–VIS–NIR regions and wavelength accuracy is better than 2.5 pm. The image signals are digitalized in dynamic range of 16 bits and further processed by an industrial computer. The dark current of the ICCD was automatically subtracted from the measured spectral data. Wavelength calibration was performed with an Hg lamp. Integration time gate, time delay, number of accumulated laser pulses and detector amplification gain were chosen as the LIBS operational variables to optimization.
The 15 mm diameter pellet was placed into a plastic sample holder adapted for the ablation chamber. Argonflowing at 1.0 L min−1was continuously fed into the ablation chamber by four entrance inlets symmetrically positioned in the sample holder and theflow-rate was controlled by a rotameter.
3.2. Laboratory sample
Spinach leaves (National Institute of Standards and Technology— NIST 1570a) were employed as laboratory sample. This material was selected due to the lower particle size distribution. Pellets were prepared in a Spex model 3624B X-Press by transferring 0.5 g of powdered material to a 15 mm die set and applying 8.0 ton cm−2during 5 min. Pellets were approximately 2 mm thick. Measurements were performed at ten different locations (sampling spots) on the pellet surface in order to minimize problems linked to sample microheterogeneity and the average of these measurements was used as dataset. The number of accumulated laser pulses of each sampling spot was optimized. For each of the analyzed spectra the background was subtracted considering both peak sides and the peak area was calculated. Spectral lines of interest were identified using the NIST Atomic Spectra Database[35].
3.3. Software
Most calculations were performed on the MATLAB 6.5 program-ming environment (The MathWorks, Natick, MA), using the neural network routines from the Neural Network Toolbox 4.0 (The Math-Works)[36]and the genetic algorithm implementation by Houck et al. [37]. Electronic spreadsheets were used for multivariate linear regression calculations[38].
3.4. Doehlert design
Doehlert design was applied for evaluation of the variables and the quadratic polynomial models generated for each element. The
parameters chosen for optimization were the integration time gate (tint), number of accumulated laser pulses (np), delay time (tdelay) and amplification gain (ag). The experimental levels chosen for the four studied factors are presented inTable 1.
A Dohlert matrix consisting of a set of 21 experiments (Table 2) was designed. The central point was performed in five replicates. These replicates at the central point permit the model validation by means of an estimate of experimental error variance.
Average spectra in the VUV region (180 to 440 nm) were recorded for each experimental data point according to a Doehlert design. Spectral emission lines for macro-nutrients (Ca, Mg and P), micro-nutrients (B, Cu, Fe, Mn and Zn), Al and Si were identified using the
Table 1
Experimental domain for the determination of Al, B, Ca, Cu, Fe, P, Mn, Mg, Si and Zn in plant materials by LIBS.
Factor Unit Low level Upper level Coded variables
Integration time gate µs 3 10 X1
Number of laser pulses – 10 50 X2
Delay time µs 1 5 X3
Amplification gain a.u. 100 230 X4
Table 2
Doehlert matrix and experimental design for the determination of Al, B, Ca, Cu, Fe, P, Mn, Mg, Si and Zn in plant materials by LIBS.
Doehlert matrix Experimental design
Experiment X1 X2 X3 X4 tint(µs) np tdelay(µs) ag(a.u.)
1 1 0 0 0 10 30 3 165
2 0.5 0.866 0 0 8.25 50 3 165
3 0.5 0.289 0.817 0 8.25 37 5 165
4 0.5 0.289 0.204 0.791 8.25 37 3.5 230
5 −1 0 0 0 3 30 3 165
6 −0.5 −0.866 0 0 4.75 10 3 165
7 −0.5 −0.289 −0.817 0 4.75 23 1 165
8 −0.5 −0.289 −0.204 −0.791 4.75 23 2.5 100
9 0.5 −0.866 0 0 8.25 10 3 165
10 0.5 −0.289 −0.817 0 8.25 23 1 165
11 0.5 −0.289 −0.204 −0.791 8.25 23 2.5 100
12 −0.5 0.866 0 0 4.75 50 3 165
13 0 0.577 −0.817 0 6.5 43 1 165
14 0 0.577 −0.204 −0.791 6.5 43 2.5 100
15 −0.5 0.289 0.817 0 4.75 23 5 165
16 0 −0.577 0.817 0 6.5 17 5 165
17 0 0 0.613 −0.791 6.5 30 4.5 100
18 −0.5 0.289 0.204 0.791 4.75 37 3.5 230
19 0 −0.577 0.204 0.791 6.5 17 3.5 230
20 0 0 −0.613 0.791 6.5 30 1.5 230
21a 0 0 0 0 6.5 30 3 165
aCentral point withfive replicates.
NIST atomic spectral Database. The analytical responses of each experimental point of the Doehlert matrix were the peak areas of Ca I 422.544 nm, Mg I 285.213 nm, P I 214.914 nm, B I 249.773 nm, Cu I 327.395 nm, Fe II 259.940 nm, Mn II 259.375 nm, Zn I 213.861 nm, Al I 309.271 nm and Si I 251.611 nm.
3.5. Response modeling
Results of peak area obtained from the Doehlert design were employed for a quadratic polynomial model in the BRANN training. In quadratic polynomial modeling, each element was evaluated sepa-rately, whereas in the BRANN, that correlates all responses simulta-neously, a model was obtained after the net training.
The BRANN training was performed with a tangent-sigmoidal transfer function in hidden layer and linear function in output layer, four neurons in the input layer (corresponding to the four operational variables studied) and ten neurons in the output layer, equivalent to elements evaluated (Fig. 1). The BRANN architecture optimization was performed varying the number of neurons in the intermediate layer from 1 to 15 and proceedingfive replicates to each network archi-tecture generated.
The quality of the quadratic polynomial response surfaces were evaluated through ANOVA tables and the BRANN model was evaluated considering the Root Mean Square Error (RMSE) in the net estimation of each element. TheRMSEis given by:
RMSE=
ffiffiffiffiffiffiffiffiffiffiffiffiffiffiffiffiffiffiffiffiffiffiffiffiffiffiffiffi P
Yp−Yt
2
n v u u t
ð5Þ
whereYpis the predict value,Ytis the true value andnis the number of samples.
3.6. Optimization by genetic algorithm
The neuro-genetic optimization was built by combination of BRANN and GA. The weight factors of the loss-minimization function for each element utilized in GA were defined as the ratio between the peak areas and the largest peak in the set in the Doehlert design.
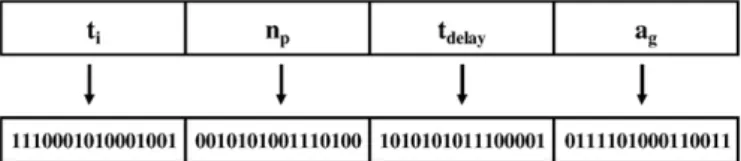
The operational variables were codified in order that each vari-able was presented as a gene in a 16-bits binary number (Fig. 2). The population on the GA procedure was 100 individuals. For the evo-lution, the probability of two random chromosomes mate in the crossover was 90% and the probability of mutation was 1%. The evolution was continued untilφV10−3or the number of generations reached 100.
4. Results and discussion
4.1. Optimization of individual responses by quadratic polynomial regression
Optimal operational conditions were investigated in this work approach in order to enhance LIBS signals for the analysis of plant materials. Different parameters such as integration time gate (tint), number of accumulated laser pulses (np), delay time (tdelay) and amplification gain (ag) were investigated. The laser pulse energy of
approximately 70 mJ reaching the sample surface was not investigated due to the lower resulting sensitivities for boron, copper and zinc.
The modeling of LIBS data was obtained through the Doehlert design, using a quadratic polynomial regression (Eq.(6)):
z=b0+b1tint+b2np+b3tdelay+b4ag+b11t2int+b22n2p
+b33t2delay+b44a2g+b12tintnp+b13tinttdelay+b14tintag +b23nptdelay+b24npag+b34tdelayag
ð6Þ
wherez is the response (peak area of each element is taken indi-vidually) with the operational variablestint,np,tdelayandagandbas the regression coefficients.
ANOVA coefficients for all elements were statistically valid (FcalcNFcritfor 95% confidence level), however, most of them showed lack offit at the same confidence level. Thus these models are not recommendable for the individual optimization of LIBS conditions.
Generally, the individual effects of delay time, integration time gate and number of pulses can be predicted very well. The delay time is defined as the delay from the initiation of the laser to the opening of the window during which signal will be accepted and the duration of that window is the integration time gate. Immediately after the laser pulse, an intense contribution of the continuum to the emission is expected[39] when the delay time is less than 0.1 µs due to the
Fig. 2.Hypothetical codification of each variable in the genetic algorithm.
Fig. 3.RMSEvalues calculated for (a) Mg, Ca, Al and Si (b) P, Fe, Mn, Zn, B and Cu from BRANN model with 10 neurons in the intermediate layer in each network training.
Bremsstrahlung process (collisions of electrons with ions and atoms— free–free emission) and recombination of electrons with ions (free-bound emission)[40]. However, after 0.1–0.5 µs the laser pulse is over, atomic and ionic lines rise from the spectral continuum. The delay time is then chosen according to the discrimination of analyte emission signal against the strong continuum radiation, with a
compromise of enhancement of signal-to-background ratio (SBR) and signal-to-noise ratio (SNR). At longer delay times, the emission signals tends to decrease as LIBS plasma is afinite event.
The integration time gate is also selected to obtain an optimum SBR. Generally, SNR and SBR values follow the same trend as the delay time changes. However, a low SBR can sometimes give a good SNR
Fig. 5.Spectra with the selected regions used in optimization for determination of Al, B, Ca, Cu, Fe, Mg, Mn, P, Si and Zn in plant materials: (a) obtained with the conditions optimized by the neuro-genetic approach (9.0 µs integration time gate, 30 accumulated laser pulses, 1.1 delay time µs and 225 a.u. amplification gain), (b) best experimental point of the Doehlert design (6.5 µs integration time gate, 30 accumulated laser pulses, 1.5 µs delay time and 230 a.u. amplification gain).
[39]. LIBS signals tend to increase until a certain value with the increase of the number of pulses accumulated for the generation of one spectrum. For plant materials analyzed in a homemade LIBS set up with Nd:YAG at 1064 nm, it was observed that when the ablation was made in the same sample position, a proportional increase in sensitivity was observed up to 4 pulses for all selected emission lines; after that, the signal intensity did not increase proportionally with the number of shots, which is probably caused by changes in the sample surface geometry after 4 consecutive pulses[3].
The best values of delay time, integration time gate and number of pulses is dependent on the sample properties and on the analytical emission line. Atomic and ionic lines present different behavior during plasma lifetime. Anyway, the results indicate the need of more sophisticated mathematical and computational procedures tofind a suitable optimization model, especially when considering simulta-neous optimization, as discussed previously.
4.2. Neuro-genetic approach
Tofind the best conditions for simultaneous determination of the ten studied elements in plant samples, an approach based on a neuro-genetic procedure was used. The best BRANN architecture consisted of ten neurons at the intermediate layer. Five replicates were performed for each trained architecture. The RMSE values and the behavior of residuals were considered in the evaluation of the networks.
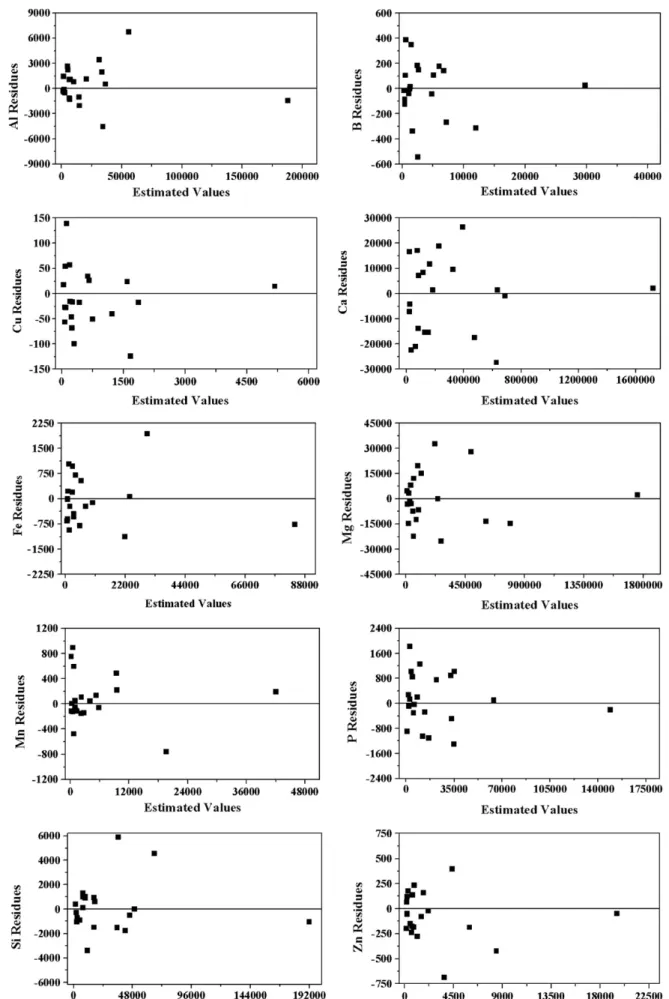
Fig. 3shows the RMSE values from the chosen architecture during the net training process. These values were similar to standard deviations of the center point replicate experiments, which is a good indication of the quality of the modelfit. According to a compromise with RMSE values that could satisfy the modeling of all elements simultaneously, it was decided to proceed with the neuro-genetic approach utilizing the net obtained from thefirst training. The be-havior of the residuals, to all elements, corresponding to the optimum BRANN model is show onFig. 4. A random distribution of the residuals can be observed, evidencing that the data were well modeled by BRANN. One point with a higher signal than the others can be observed for each analyte represented inFig. 4. All these high values correspond to experiment 20 of the Doehlert design (Table 2). This behavior indicates that major correlation between the responses and multi-response optimization can be expected.
After modeling using the BRANN, a genetic algorithm routine was used tofind out the conditions that yield simultaneously the higher peak areas for all ten elements. The optimum conditions were those that resulted on the lowest possible value for the loss functionφ (Eq.(4)), built up applying the output BRANN responses. A single LIBS working condition pointed out by GA for analysis of plant materials that maximizes peak areas of all elements simultaneously, was obtained with the following optimized parameters: 9.0 µs integration time, 1.1 µs delay time, 225 (a.u.) amplification gain and 30 accu-mulated laser pulses. The results from the neuro-genetic optimization show that larger peak areas were obtained with highertintandag; intermediate values ofnpand smaller values oftdelay. An experiment was carried out following the neuro-genetic optimized conditions and the results were compared with the best experimental point of the Doehlert design (experiment 20—see Table 2). The results of this confirmation experiment can be observed inFig. 5, indicating that the optimum experimental region was successfully obtained with BRANN and GA.
5. Conclusions
By using chemometric strategies, a single LIBS working experi-mental condition was proposed in order to maximize peak areas of several elements simultaneously. In this context, integration time gate, time delay, number of pulses accumulated and detector amplification were investigated and optimized.
The procedure developed with neuro-genetic approach is efficient and can be applied in LIBS system for the simultaneous determination of macro-nutrients (Ca, Mg and P), micro-nutrients (B, Cu, Fe, Mn and Zn), Al and Si in plant samples. The use of this optimization procedure is a suitable tool for the optimization process of complex analytical problems.
Acknowledgments
Authors are thankful to the CAPES (Coordenação de Aperfeiçoa-mento de Pessoal de Nível Superior), FAPESP (Fundação de Amparo à Pesquisa do Estado de São Paulo, Processes: 04/15965-2, 06/06466-8) and to the CNPq (Conselho Nacional de Desenvolvimento Científico e Tecnológico, Processes: 477385/2006-0, 301285/2006-3) forfinancial support. Authors are also grateful to Prof. Dr. Jez W. B. Braga for the Matlab routine for peak area calculation.
References
[1] Q. Sun, M. Tran, B.W. Smith, J.D. Winefordner, Direct determination of P, Al, Ca, Cu, Mn, Zn, Mg and Fe in plant materials by laser-induced plasma spectroscopy, Canad. J. Anal. Sci. Spectrosc. 44 (1999) 164–170.
[2] S.I. Gornushkin, I.B. Gornushkin, J.M. Anzano, B.W. Smith, J.D. Winefordner, Effective normalization technique for correction of matrix effects in laser-Induced breakdown spectroscopy detection of magnesium in powdered samples, Appl. Spectrosc. 56 (2002) 433–436.
[3] L.C. Trevizan, D. Santos Junior, R.E. Samad, N.D. Vieira Junior, C.S. Nomura, L.C. Nunes, I.A. Rufini, F.J. Krug, Evaluation of laser induced breakdown spectroscopy for the determination of macronutrients in plant materials, Spectrochim. Acta Part B 63 (2008) 1151–1158.
[4] L.C. Trevizan, D. Santos Junior, R.E. Samad, N.D. Vieira Junior, L.C. Nunes, I.A. Rufini, F.J. Krug, Evaluation of laser induced breakdown spectroscopy for the determina-tion of micronutrients in plant materials, Spectrochim. Acta Part B 64 (2009)DOI: 10.1016/j.sab.2009.04.003.
[5] D. Santos Jr., R.E. Samad, L.C. Trevizan, A.Z. Freitas, N.D. Vieira Jr., F.J. Krug, Evaluation of femtosecond laser-induced breakdown spectroscopy for analysis of animal tissues, Appl. Spectrosc. 62 (2008) 1137–1143.
[6] F. Yueh, J.P. Singh, H. Zhang, Laser-induced breakdown spectroscopy, elemental analysis, in: R.A. Meyers (Ed.), Encyclopedia of Analytical Chemistry, Wiley, 2000. [7] J. Kaiser, O. Samek, L. Reale, M. Liska, R. Malina, A. Ritucci, A. Poma, A. Tucci, F. Flora, A. Lai, L. Mancini, G. Tromba, F. Zanini, A. Faenov, T. Pikuz, G. Cinque, Monitoring of the heavy-metal hyperaccumulation in vegetal tissues by X-ray radiography and by femto-second laser induced breakdown spectroscopy, Microsc. Research and Tech. 70 (2007) 147–153.
[8] N. Carmona, M. Oujja, E. Rebollar, H. Römich, M. Castillejo, Analysis of corroded glasses by laser induced breakdown spectroscopy, Spectrochim. Acta Part B 60 (2005) 1155–1162.
[9] I. Bassiotis, A. Diamantopoulou, A. Giannoudakos, F. Roubani-Kalantzopoulou, M. Kompitsas, Effects of experimental parameters in quantitative analysis of steel alloy by laser-induced breakdown spectroscopy, Spectrochim. Acta Part B 56 (2001) 671–683.
[10] W.T.Y. Mohamed, Improved limit of detection of Be, Mg, Si, Mn, Fe and Cu in aluminum alloy samples using a portable Echelle spectrometer with ICCD camera, Opt. Laser Technol. 40 (2008) 30–38.
[11] P. Robert, C. Fabre, J. Dusbessy, M. Flin, M. Boiron, Optimization of micro-Laser Induced Breakdown Spectroscopy analysis and signal processing, Spectrochim. Acta Part B 63 (2008) 1109–1116.
[12] M.A. Gondal, T. Hussain, Z.H. Yamani, Optimization of the LIBS Parameters for detection of trace metals in petroleum products, Energy Sources Part A 30 (2008) 441–451.
[13] D. Body, B.L. Chadwick, Optimization of the spectral data processing in a LIBS simultaneous elemental analysis system, Spectrochim. Acta Part B 56 (2001) 725–736.
[14] R. Brennetot, J.L. Lacour, E. Vors, A. Rivoallan, D. Vailhen, S. Maurice, Mars analysis by laser-induced breakdown spectroscopy (MALIS): influence of mars atmosphere on plasma emission and study of factors influencing plasma emission with the use of Doehlert designs, Appl. Spectrosc. 57 (2003) 744–752.
[15] J.S. Cowpe, J.S. Astin, R.D. Pilkington, A.E. Hill, Application of response surface methodology to laser-induced breakdown spectroscopy: influences of hardware configuration, Spectrochim. Acta Part B 62 (2007) 1335–1342.
[16] L.E. García-Ayuso, J. Amador-Hernández, J.M. Fernández-Romero, M.D. Luque de Castro, Characterization of jewellery products by laser-induced breakdown spectroscopy, Anal. Chim. Acta 457 (2002) 247–256.
[17] M.A. Bezerra, R.E. Santelli, E.P. Oliveira, L.S. Villar, L.A. Escaleira, Response surface methodology (RSM) as a tool for optimization in analytical chemistry, Talanta 76 (2008) 965–977.
[18] S.L.C. Ferreira, R.E. Bruns, H.S. Ferreira, G.D. Matos, J.M. David, G.C. Brandão, E.G.P. da Silva, L.A. Portugal, P.S. dos Reis, A.S. Souza, W.N.L. dos Santos, Box–Behnken design: an alternative for the optimization of analytical methods, Anal. Chim. Acta 597 (2007) 179–186.
[20] S.L.C. Ferreira, W.N.L. dos Santos, C.M. Quintella, B.B. Neto, J.M. Boque-Sendra, Doehlert matrix: a chemometric tool for analytical chemistry—review, Talanta 63 (2004) 1061–1067.
[21] J.A. Cornell, Experiments with Mixtures: Designs, Models and the Analysis of Mixture Data, Wiley, New York, 1990.
[22] Y. Hu, D.L. Massart, Uniform shell designs for optimization in reversed-phase liquid chromatography, J. Chromatogr. 485 (1989) 311–323.
[23] S.L.C. Ferreira, W.N.L. dos Santos, M.A. Bezerra, V.A. Lemos, J.M. Bosque-Sendra, Use of factorial design and Doehlert matrix for multivariate optimization of an on-line preconcentration system for lead determination byflame atomic absorption spectrometry, Anal. Bioanal. Chem. 375 (2003) 443–449.
[24] J. Zupan, J. Gasteiger, Neural networks: a new method for solving chemical problems or just a passing phase? Anal. Chim. Acta 248 (1991) 1–30.
[25] J. Zupan, J. Gasteiger, Neural Networks for Chemists: An Introduction, VCH Publishers, New York, 1993.
[26] E.R. Pereira-Filho, C. Mello, P.A. Costa Filho, M.A.Z. Arruda, R.J. Poppi, Neuro-genetic approach for optimisation of the spectrophotometric catalytic determina-tion of cobalt, Anal. Chim. Acta 433 (2001) 111–117.
[27] G.A. Silva, F. Augusto, R.J. Poppi, A Simultaneous optimization by neuro-genetic approach of a multiresidue method for determination of pesticides inPassiflora alatainfuses using headspace solid phase microextraction and gas chromato-graphy, J. Chromatogr. A 1138 (2007) 251–261.
[28] D.A. Winkler, F.R. Burden, Bayesian neural nets for modeling in drug discovery, DDT: Biosilico 2 (2004) 104–111.
[29] S. Agatonovic-Kustrin, M. Zecevic, L. Zivanovic, I.G. Tucker, Application of neural networks for response surface modeling in HPLC optimization, Anal. Chim. Acta 364 (1998) 265–273.
[30] J. Garcia, A.N. Araujo, J.L.F.C. Lima, I. Villaescusa, M. Poch, Application of natural computational techniques to optimal design offlow injection systems, Anal. Chim. Acta 402 (1999) 275–283.
[31] R. Leardi, Genetic algorithms in chemistry, J. Chromatogr. A 1158 (2007) 226–233. [32] S. Gergely, E. Bekassy-Molnar, G. Vatai, The use of multiobjective optimization to
improve winefiltration, J. Food Eng. 58 (2003) 311–316.
[33] C. Bohling, K. Hohmann, D. Scheel, C. Bauer, W. Schippers, J. Burgmeier, U. Willer, G. Holl, W. Schade, All-fiber-coupled laser-induced breakdown spectroscopy sensor for hazardous materials analysis, Spectrochim. Acta Part B 62 (2007) 1519–1527. [34] J.B. Sirven, B. Bousquet, L. Canioni, L. Sarger, S. Tellier, M. Potin-Gautier, I. Le Hecho, Qualitative and quantitative investigation of chromium-polluted soils by laser-induced breakdown spectroscopy combined with neural networks analysis, Anal. Bioanal. Chem. 385 (2006) 256–262.
[35] NIST (National Institute of Standards and Technology),http://physics.nist.gov/ PhysRefData/ASD/lines_form.html.
[36] H. Demuth, M. Beale, Neural Network Toolbox Version 4.0 for use with Matlab, The MathWorks Inc., Natick, 2002.
[37] C. Houck, J. Joines, M. Kay, A Genetic algorithm for function optimization: a Matlab implementation, NCSU-IE, Technical Report, 95-09, North Caroline State Uni-versity, 1995.
[38] R.F. Teófilo, M.M.C. Ferreira, Quimiometria II: planilhas eletrônicas para cálculos de planejamentos experimentais, um tutorial, Quimica Nova 2 (2006) 338–350. [39] D.A. Cremers, L.J. Radziemski, Handbook of laser-induced breakdown
spectro-scopy, Wiley, Chichester, 2006.
[40] C. Aragón, F. Peñalba, J.A. Aguilera, Curves of growth of neutral atom and ion lines emitted by a laser induced plasma, Spectrochim. Acta Part B 60 (2005) 879–887.