A Regional Model for Malaria Vector
Developmental Habitats Evaluated Using
Explicit, Pond-Resolving Surface Hydrology
Simulations
Ernest Ohene Asare1,2*, Adrian Mark Tompkins2, Arne Bomblies3
1Department of Physics, Kwame Nkrumah University of Science and Technology, Kumasi, Ghana,2Abdus Salam International Centre for Theoretical Physics (ICTP), Trieste, Italy,3School of Engineering, University of Vermont, 33 Colchester Ave, Burlington, VT 05405, United States of America
Abstract
Dynamical malaria models can relate precipitation to the availability of vector breeding sites using simple models of surface hydrology. Here, a revised scheme is developed for the VECTRI malaria model, which is evaluated alongside the default scheme using a two year simulation by HYDREMATS, a 10 metre resolution, village-scale model that explicitly simu-lates individual ponds. Despite the simplicity of the two VECTRI surface hydrology parame-trization schemes, they can reproduce the sub-seasonal evolution of fractional water coverage. Calibration of the model parameters is required to simulate the mean pond frac-tion correctly. The default VECTRI model tended to overestimate water fracfrac-tion in periods subject to light rainfall events and underestimate it during periods of intense rainfall. This systematic error was improved in the revised scheme by including the a parametrization for surface run-off, such that light rainfall below the initial abstraction threshold does not contrib-ute to ponds. After calibration of the pond model, the VECTRI model was able to simulate vector densities that compared well to the detailed agent based model contained in
HYDREMATS without further parameter adjustment. Substituting local rain-gauge data with satellite-retrieved precipitation gave a reasonable approximation, raising the prospects for regional malaria simulations even in data sparse regions. However, further improvements could be made if a method can be derived to calibrate the key hydrology parameters of the pond model in each grid cell location, possibly also incorporating slope and soil texture.
Introduction
The availability of water for larvae development is a key determinant of mosquito density [1,
2]. Mosquitoes exploit diverse habitats for their oviposition though species have habitat-type preferences [1,3–8]. For instance, the two key African malaria vectors,Anopheles gambiae sensu strictoandAnopheles arabiensisprefer small temporary sun-lit pools for oviposition
OPEN ACCESS
Citation:Asare EO, Tompkins AM, Bomblies A (2016) A Regional Model for Malaria Vector Developmental Habitats Evaluated Using Explicit, Pond-Resolving Surface Hydrology Simulations. PLoS ONE 11(3): e0150626. doi:10.1371/journal. pone.0150626
Editor:Francesco Pappalardo, University of Catania, ITALY
Received:June 12, 2015
Accepted:February 17, 2016
Published:March 22, 2016
Copyright:© 2016 Asare et al. This is an open access article distributed under the terms of the Creative Commons Attribution License, which permits unrestricted use, distribution, and reproduction in any medium, provided the original author and source are credited.
Data Availability Statement:The temperature and rainfall data used for this paper were obtained from Niger Meteorological Service, and the authors do not have third-party dissemination rights. This data is available from the African Monsoon Multidisciplinary Analyses (AMMA) database (http://database.amma-international.org) Both model output data sets are supplied as supporting files.
[9–11] although they also thrive in other water bodies [3,5,8]. These temporary sun-lit pools typically have higher water temperatures, which shortens the length of the aquatic stage devel-opment of mosquitoes. Due to their size they are also prone to desiccation before larvae emerge as adults, implying that the temporal dynamics of small ponds is also important. For instance, Himeidan et al. [12] found hilltop habitats to be unproductive, containing fewAnopheline lar-vae but with zero pupation rate as result of habitat instability. The availability, area coverage and persistence of temporary surface water (which serves as developmental habitat for gravid mosquitoes) are tied with depth, intensity and frequency of rainfall as well as local hydrological conditions.
Attempts to link rainfall incidence to malaria vector abundance and disease incidence have yielded varied results in different geographical locations. For instance, the 1997 El Niňo
south-ern oscillation (ENSO) caused an increase in rainfall in parts of eastsouth-ern Africa leading to a malaria epidemic in southwest Uganda [13], but conversely a reduction in malaria cases was observed in the Usambara Mountains of Tanzania [14], indicating that the relationship between rainfall and malaria transmission is nonlinear and complex. In Botswana, for example, Thomson et al. [15] developed a malaria early warning system based on multi-model ensemble prediction of precipitation and found that the relationship between November-February pre-cipitation and the anomaly in malaria incidence is best explained by a quadratic relationship with malaria incidence decreasing once rainfall exceeded a certain threshold. In Malawi, Lowe et al. [16] found a similar quadratic relation. Kelly-Hope et al. [17] observed a weak correlation between precipitation and abundance of mosquito vectors with a correlation coefficient (r2) of 0.246 and 0.315 forAn. gambiae s.sandAn. arabiensisrespectively. Similarly, Molineaux and Gramiccia [18] found a poor correlation between mosquito abundance and seasonal rainfall using data from Garki district in northern Nigeria. In addition, in Banizoumbou village in southwestern Niger, Bomblies [19] showed that temporal patterns of individual rainfall events are related to mosquito abundance, partially explaining previously observed poor correlations which typically consider monthly or seasonal total precipitation. The nonlinear relationship of mosquito abundance to precipitation is poorly understood and may be partially due to intense rainfall reducing larvae density by flushing first stage larvae [20]. Patz [21] observed an improvement in predictingAn. gambiaebiting rate from 8% with raw precipitation to 45% with modelled soil moisture, used as a proxy for pond availability. In a related study in South Africa, Montosi et al. [22] found that soil moisture predicts better sub-seasonal variability in malaria cases relative to rainfall and temperature. Shaman et al. [23] found a positive associa-tion between modelled local surface wetness with10 days time lag and abundance of Anoph-eles walkeriandAedes vexansin the eastern United States.
It is clear that for dynamical malaria models to accurately reproduce variations in malaria associated with rainfall, then they need to be able to include a representation of the surface hydrology correctly. Thus rainfall would drive a simple model for breeding site availability, which ultimately determines vector density. The rainfall may be obtained from a nearby station if available, but if malaria is to be modelled regionally recourse to satellite-merged retrieval products may be necessary due to sparse station data availability.
Dynamical mathematical models for mosquito density or malaria transmission have incor-porated representations of the surface hydrology that vary in complexity. Depinay et al. [24] introduced a local scale dynamical model designed to explicitly model individual breeding sites to simulate mosquito population dynamics. Hoshen and Morse [25] relate the oviposition rate to the 10 day rainfall rate in the Liverpool Malaria Model (LMM). Lunde et al. [26] parame-trized surface hydrology as a function of river length and soil moisture based on the assump-tion that potential habitats are located within the vicinity of rivers and lakes. Their Open Malaria Warning (OMaWa), designed to be run on a large scale, may have limited application and Educational Programme (STEP). The study was
also partly funded by two European Union Seventh Framework Programmes projects: HEALTHY FUTURES under the grant agreement number 266327 and QWeCI (Quantifying Weather and Climate Impacts on health in developing countries) under the grant agreement number 243964.
in areas of relatively flat topography where habitats are only rain-fed and can be located far away from permanent water bodies. Another recently introduced regional scale dynamical malaria model, the vector-borne disease community model of the International Centre for Theoretical Physics, Trieste (VECTRI; Tompkins and Ermert [27]) uses a simple surface hydrology parametrization that models the evolution of the fractional water coverage within each grid cell.
Observations are required to evaluate and improve treatment of surface hydrology, however the small spatial scale of breeding habitats confounds such efforts. Field data can provide useful measurements of specific breeding sites, but are unable to assess the statistics of all ponds over a large area. At the same time, presently no evaluated and validated remotely sensed retrieval products exist for the coverage of small scale ponds.
A possible method to progress is to employ ultra-high resolution, explicit hydrology simula-tions as an intermediate step. Explicit simulasimula-tions, which require mapping out the topography, land cover and soil texture at O(m) scale can only be conducted over areas of O(km) scale, due to the data input requirements which require manual mapping of an area, and additionally due to the computational cost. However, such explicit simulations for an O(km)-scale“patch”can be validated by isolated in situ measurements at this village scale, and then subsequently be used to provide O(km)-scale pond coverage evolution statistics to evaluate a simple scheme of a model such as VECTRI, which can potentially be applied on regional scales.
One explicit hydrological model, HYDREMATS, has been applied previously to simulate all individual ponds for a domain of several kilometres, which was validated at specific sites within the domain using measurements taken from a selection of ponds [28]. For local, village scale modelling, Bomblies et al. [28] introduced the high-resolution Hydrology, Entomology, and Malaria Transmission Simulator (HYDREMATS). HYDREMATS runs with 10 meter spatial scale grid-cells to explicitly simulate pool formation and persistence time that control aquatic stage development of mosquito for each individual pond. In order to set up this model, Bani-zoumbou village in southwest Niger was manually mapped at this 10 m scale using survey-grade differential GPS instrumentation. The model simulated daily water depth and showed good agreement with observations, predicting seasonal and sub-seasonal mosquito abundance [28]. Bomblies et al. [29] using HYDREMATS found good agreement with observed interan-nual variability in mosquito abundance between two villages located 30 km apart, but with con-trasting local hydrological and environmental conditions. Furthermore, HYDREMATS has been used to assess the impact of environmental management in malaria control [30] and the sensitivity of the model to various climate change scenarios has been evaluated [31].
The objectives of this study are to use the statistics of all ponds aggregated over the entire HYDREMATS domain to evaluate the pond parametrization used in VECTRI [27]. A modified version of the scheme that attempts to address some shortcomings of the default VECTRI model is also presented and evaluated. Finally, we examine how the simulation of mosquito density by the simple bulk model of VECTRI compares to the detailed agent-based treatment of the HYDREMATS model.
products could be used to drive VECTRI so as to get real time prediction of malaria transmis-sion on a regional scale.
Method and Data
Data for study Region
The study region, Banizoumbou village in southwestern Niger (13° 310, 2° 390), was mapped out at 10 m resolution and in situ pond measurements were taken throughout two rainy sea-sons of 2005 and 2006. In addition, vector density was estimated using Centers for Disease Control (CDC) miniature light traps deployed in six locations (four indoor, two outdoor) in Banizoumbou. The HYDREMATS high-resolution, coupled hydrology and entomology model of Bomblies et al. [28] was then used to successfully simulate the pool formation and daily pond water depth at the 10 m scale as well as the vector density differences between the two seasons. For a comprehensive description of the study area, the HYDREMATS simulations, and their evaluation with in situ measurements, the reader is referred to Bomblies et al. [28].
Station rainfall data for the experiments were provided by the Banizoumbou meteorological station located just outside the village. This data is available from the African Monsoon Multi-disciplinary Analyses (AMMA) database (http://database.amma-international.org). To explore the potential of using satellite precipitation products to drive VECTRI on a regional scale, two satellite products, namely the Tropical Rainfall Measuring Mission (TRMM 3B42; Huffman et al. [33]) and the second version of the Famine Early Warning System (FEWS RFE2; Herman et al. [34]) were assessed as these are the two key daily rainfall products available in near real-time. The TRMM 3B42 rainfall estimates are available on a 3-hour temporal resolution and a spatial resolution of 0.25° × 0.25° between latitudes 50° north and south. Rainfall estimates from TRMM 3B42 are derived using a combination of passive microwave sensors (TMI, AMSU-B, SSM/I, and AMSR-E) and the TRMM 2A12 precipitation radar (PR) calibrated using available rain gauge data on a monthly timescale [35]. The FEWS RFE2 rainfall retrieval combines geostationary infrared information with polar orbiting microwave sensor (SSM/I and AMSU-B) data, replaced with rain gauge data where available on the global telecommuni-cations system (GTS). This product has a spatial resolution of 0.1° × 0.1° [36]. For each product the satellite pixel was selected that contains the study area.
VECTRI Malaria Model
Default model hydrology. VECTRI is an open source grid-cell distributed dynamical malaria model that operates using a resolution of the driving climate data (10–100 km). For a detailed overview the reader is referred to Tompkins and Ermert [27]. The model incorporates a simple surface hydrological parametrization scheme (V1.2.6) that estimates at each time step the fractional water coverage area in each grid cell. Fractional water coverage area is a sum of both temporary and permanent habitats. Locations with permanent year-round water bodies that can provide breeding sites can constitute transmission hot-spots, with markedly reduced seasonality in the transmission intensity, and which provide the seed to initiate transmission in neighboring areas once rains commence [37–39]. Including an estimate of the permanent breeding fraction enables the model to represent the reduced amplitude of the malaria trans-mission seasonal cycle in such locations.
their cattle during the dry season. This results in highly polluted water during the dry season which detersAnopheles Gambiae. Only during the wet season, when the water quality was much improved are mosquito larvae found in abundance in the periphery of this pool. As a result of these considerations, for this study the permanent water fraction is set to zero so that only temporary ponds are accounted for.
The ground water table is usually around 30 to 50 m below the surface in the Sahel [40,41], although there are some local exceptions, and ground water is assumed to be too deep to affect pond fraction in both models. For the study location of Banizoumbou village itself, the water table is 22 m below the surface, while for the surrounding areas the average depth is around 50 m, with a minimum depth of 10 m directly below the largest pools [42].
The net aggregated fractional water coverage of temporary pools in each grid cell was expressed as inEq 1:
dwpond
dt ¼Kw Pðwmax wpondÞ wpondðEþIÞ
ð1Þ
wherewpondis net aggregated fractional water coverage in a grid cell,wmaxis maximum
tempo-rary pond coverage area,Pis precipitation rate,EandIwhich were set to afixed constant are evaporation rate and infiltration rate respectively andKwis a constant that links rainfall to the
growth of the temporary ponds. For details see Tompkins and Ermert [27].
The scheme is highly simplified and neglects many factors, including topographical slope, soil texture, presence of vegetation, pond geometry and heterogeneity in water infiltration rates. For example, the rate of infiltration decreases towards the middle of these temporary ponds due to the effect of clogging by sediment over time [43,44]. This nonlinearity in infiltra-tion relainfiltra-tion will therefore lead to constant infiltrainfiltra-tion assumpinfiltra-tions over- or underestimating loss of water from the ponds. The stability of ponds has also been linked with their shape. For instance, Garmendia and Pedrola-Monfort [45] observed rapid drying of cylindrical shaped ponds relative to conic shape ponds. The presence of vegetation has been documented to reduce evaporation rates of water bodies [46], although this would be challenging to represent in the scheme due to the lack of data to set the relevant parameters on a regional scale. In any case, as evaporation is generally a small loss term relative to infiltration, vegetation coverage will be of second order impact on the water balance of these water bodies.
Modified model hydrology. A new surface hydrology parametrization scheme (V1.3.0) is introduced to address some of the shortcomings of the default scheme. The modified approach is still based on the concept of small kilometer-scale catchments that cover a proportionwmax
of a grid cell that collect water locally into temporary surface pools, while precipitation falling on the remaining area is lost to the larger scale drainage network. A schematic of the modified approach is given inFig 1which emphasizes that in the new model, all precipitation falling directly in ponds contributes to their growth, while in the remaining catchment area, only the surface runoff does so. Ponds lose water mass through processes of infiltration, evaporation and overflow.
In the new scheme, pool geometry is accounted for using the simple power function relation of Hayashi and Van der Kamp [47]. Unlike V1.2.6, the relationship between volume and pond fractional coverage area is also linked to the pond’s geometry in V1.3.0 as expressed inEq 2 fol-lowing Asare et al. [48]:
dwpond
dt ¼ 2
phref
wref
wpond
!p=2
ðQðwmax wpondÞ þPwpondÞð1 fÞ wpondðEþfImaxÞ
Hereprepresents the shape factor of ponds,hrefis the aggregated reference pond water
depth,wrefis the reference fractional coverage equated toKw,Qis the runoff (seeEq 3),Imax
maximum infiltration which depends on the local hydrology and soil type andf ¼wpond
wmax. The
overflow (markedOinFig 1) is modelled by a simple factor 1−f. It is recalled that the pond
fraction is not representative of a single water body, but rather models the statistics of a collec-tion of water bodies. The assumpcollec-tion is that as the pond fraccollec-tion increases, a greater number of these bodies reach their maximum capacity and lose water through overflow losses. Asare et al. [48] noted overflow losses to be significant in water bodies during the peak of the rainy season. This hydrological scheme has been evaluated and showed good agreement with in situ pond observations [48]. Infiltration is expected to be maximum when the ponds reach their maxi-mum surface area. For instance, in southwestern Niger, Martin-Rosales and Leduc [44] found maximum infiltration of the order of 600 mm day−1after a rainfall event which reduced
signifi-cantly as the water depth reached the clogging region of the pond. In the same region, Descon-nets et al. [43] found a similar sharp decrease in infiltration rate from the sandy to clay-clogged area of the pond. The infiltration is modelled by a simple linear function of the pond fraction, which leads to the strong nonlinear evolution of pond fraction observed. It is emphasized that the maximum infiltration rate is only reached when the pond fraction equals the catchment area, which never occurs even after intense rainfall, and mean infiltration rates are usually an order of magnitude lower. Here, a range of suitable values forImaxare tested.
TheQterm in the V1.3.0 is calculated based on the United States Department of Agriculture (USDA) USDA [49] Soil Conservation Service curve number (SCS-CN) method:
Q¼ðP 0:2SÞ
2
Pþ0:8S ð3aÞ
S¼25400
CN 254 ð3bÞ
wherePis rainfall (mm),Sis potential maximum retention (mm) andCN(range between 0 and 100) is the curve number, a dimensionless parameter representing the land surface charac-teristics. WhenCNis 100, all rainfall will become runoff while all rainfall infiltrates without Fig 1. Schematic of the modified hydrology scheme adapted from Asare et al. [48].Precipitation (P) is assumed to fall homogeneously across the grid-cell. In some locations the rainfall drains into stream/river catchments, while the remainder either contributes directly to pools or falls within local catchments for ponds, in which case only a proportion may reach the ponds via surface runoff. The sink of pond coverage is via the loss of water due to overflow (O), infiltration (I) and evaporation (E).
generating runoff whenCNis 0. TheCNvalues for various hydrological soil groups and land cover types are available from SCS-CN tables provided by the USDA [49]. Setting a suitable value for CN is a challenge. While The CN is a function of soil properties, these can be quite spatially heterogeneous and can also change in time due to surface crust formation, which can greatly increase runoff [50,51].
The infiltration is also a function of the soil water content, which is not modelled in VEC-TRI to avoid increasing model complexity by the addition of further prognostic equations for multiple soil layers and the extraction of water in the root zone by vegetation. Therefore, in this study a range of appropriate values were tested assuming sandy soil with crust formation, as specified in [28,29]. Runoff occurs when rainfall exceeds the initial abstraction capacity of the surface layer which is generally assumed to be 0.2S.
Hayashi and Van der Kamp [47] introduced a simple geometrical model for ponds. Studies have shown that the geometrical shape parameter in the model is approximately 2 for tempo-rary ponds [47,52,53]. This simple geometrical model showed good agreement with daily observed surface area of individual micro habitats in suburb of Kumasi Ghana [48].
Vector model. The VECTRI model simulates the total vector density per square metre by dividing larvae into a number of development bins and vectors into a number of bins that repre-sent the state of the gonotrophic cycle Tompkins and Ermert [27]. Temperature impacts rate of the progression of larvae through the successive growth stages, the female adult gonotrophic rates, and the mortality of both larvae and adults. The pond fraction limits larvae density through a max-imum biomass carrying capacity, the value of which was adopted from the HYDREMATS model.
HYDREMATS Malaria Model
Surface hydrology. HYDREMATS is a mechanistic model that simulates the pool water level and flow velocity at each time step and grid-cell based on distributed flow routing [28]. The overland flow component of the model solves the two-dimensional Saint-Venant equations (continuity and horizontal momentum equations). A finite difference solution of diffusive-wave approximations of the Saint-Venant equations is used to predict pool water depth and surface-water routing. The overland flow direction is strongly linked with variations in the slope of cell topography and surface water pools are predominantly found at topographic low points in the study region. The mean velocity of the routing is parametrized by Manning’s equation with roughness parameter depending on soil and vegetation characteristics of each cell.
The HYDREMATS land surface parametrization consists of two vegetation layers and six soil layers based on the land surface transfer scheme (LSX) of Pollard and Thompson [54]. This coupled atmosphere-vegetation-soil scheme simulates momentum, energy and water fluxes exchanges at each grid cell, and includes the partitioning of rainfall into infiltration and overland runoff.
actions of many independent individuals. Bomblies et al. [28] gives further detail concerning the functionality of the entomology model within HYDREMATS.
Hydrology Comparison method
Assuming a 5 cm water depth threshold for each cell to be considered to contain a breeding site, HYDREMATS daily average pond coverage fraction is derived for the 2.5 × 2.5 km simula-tion area and used to evaluate the two VECTRI parametrizasimula-tion schemes which simulate a sin-gle water fraction over the study domain. Cells with water depth less than this threshold are likely to dry out within a day without rainfall and tests show little sensitivity of the results to this value (Fig 2).
In order to identify the set of parameters that minimizes the error between VECTRI and HYDREMATS hydrology schemes, a deterministic optimization based on the root mean
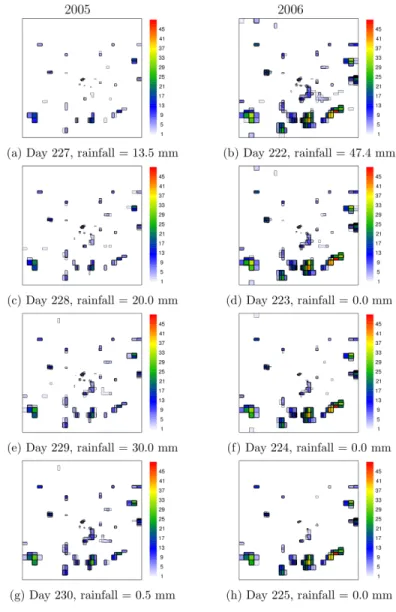
Fig 2. An example of daily HYDREMATS simulated water depth evolution of individual ponds over the study domain for four consecutive days in each year.The Julian day and rainfall recorded for the selected days in 2005 (left panel) and 2006 (right panel) are provided under each plot.
square error (RMSE) is used. Various parameters includingwmax,Kw,E+I,ImaxandCNin the
VECTRI surface hydrology schemes are perturbed from their default values. These parameters have the most influence on the pond stability on both seasonal and intraseasonal time scales. The VECTRI model is then integrated in a Monte Carlo set of ensembles using combinations of parameters. The RMSE is calculated for each experiment for the entire simulation period of 2005 to 2006.
To assess VECTRI model’s performance in simulating the water fraction and vector density, the Nash-Sutcliffe efficiency (NSE) [55] given byEq 4is used
NSE¼1
XN
i¼1
ðSi OiÞ
2
XN
i¼1
ðOi O
Þ2
ð4Þ
whereSiis the simulated value,Oiis the observed value,Ois the mean of observations and N
is the total number of observations. TheNSEmetric ranges between−1and 1 withNSEvalue
of 1 indicates that observed versus simulated plot perfectlyfits a 1:1 line.
Results and Discussion
High resolution integrations
Pond stability is determined by precipitation frequency, intensity as well as local hydrological parameters such as soil type, water table depth and micro topography. In a Sahelian environ-ment, infiltration accounts for about 90% of the loss of water [30,43]. Total rainfall recorded was 409.3 and 478.3 mm in 2005 and 2006, respectively falling in 44 and 39 wet days in the two years.
An example of HYDREMATS simulated water depth using station rainfall observations for the entire study region for a sequence of 4 days in 2005 and 2006 is shown inFig 2(seeS1 Dataset). This figure illustrates pond water coverage and shows how grid cells with water depth less than 5 cm tend to be short-lived in this simulation and unlikely to survive until the next day without rainfall. Although Bomblies et al. [28] observed mosquito larvae in hoof-print of animals in this region, such habitats located far from larger scale depressions resolved by the 10 m model resolution tended to be short-lived, as persistence times were only several hours and therefore far less than the approximately seven days required under optimum conditions for completion of the mosquito aquatic stage development [24]. In contrast, animal hoof-prints located within the catchment of large depressions were stable enough to produce adult mosqui-toes. Thus productive developmental habitats cluster around topographical low areas [28]. The locations of the HYDREMATS simulated habitats are similar for the two years but with differ-ences in habitat extent and stability (Fig 2).
VECTRI hydrology parametrization Evaluation
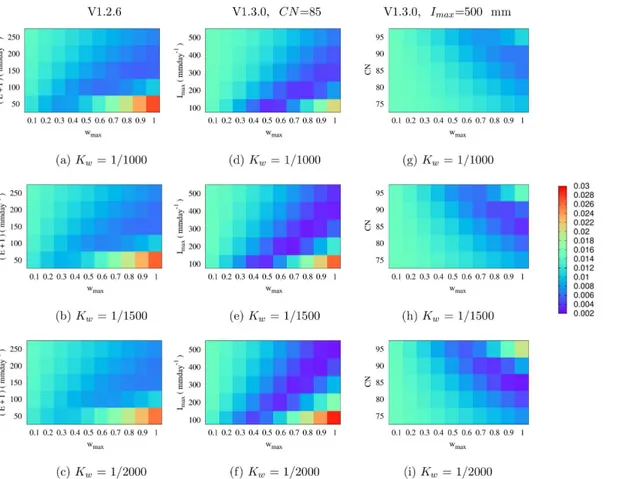
Fig 3(seeS2 Dataset) shows the pond fraction root mean square error (RMSE) for VECTRI (V1.2.6 and V1.3.0) using a combination of various tunable parameters as described in the methods section. Regarding V1.2.6 (Fig 3a, 3dand 3g), decreasingKwresulted in an increase
in RMSE with respect to HYDREMATS with the exception of whenE+I= 50 mm day−1.
Although decreasingKwcaused a decrease in pond growth for a given rain rate, at the same
time it increases pond stability by reducing daily loss of water from the pond due to the linear relation betweenKwand rainfall andE+Iterms. Increasing the constant loss termE+I
reduces the RMSE between V1.2.6 and HYDREMATS withwmaxof 0.5. In this case, during
intense rainfall events when the pond water extends to the sandy porous fringes associated with high infiltration, the constant infiltration rate will lead to an underestimation of the total infiltrated water.
Smaller RMSE values were observed between HYDREMATS and VECTRI V1.3.0 with con-stantCN= 85 (Fig 3b, 3eand 3h) at smallerwmaxcompared to V1.2.6. Although varyingImax
affects the values ofwmaxthat resulted in good agreement with HYDREMATS, the range of
val-ues forwmaxthat produce lower RMSE are smaller relative to the V1.2.6. The primary reason is
the scaling factorfthat moderates infiltration by accounting for increases or decreases in daily infiltration rates with pond water extent [43,44]. In addition, both the runoff andKw
coeffi-cient in V1.3.0 are also nonlinear. The V1.3.0 scheme with fixed maximum infiltration (Imax=
500 mm day−1) also shows a similar pattern to the previous V1.3.0 experiment but requires
large values ofwmaxto minimize the RMSE (Fig 3c, 3fand 3i). The good agreement between
V1.3.0 (Imax= 500 mm day−1) and HYDREMATS at high values ofwmaxdemonstrates that the
set infiltration threshold is likely to be too high for the study region.
It is clear from these experiments that there is no unique set of parameters which leads to a good performance of the VECTRI schemes, and many parameter combinations enable the VECTRI surface hydrology schemes to reproduce water fraction similar to that of the Fig 3. RMSE between HYDREMATS and VECTRI schemes (with varying tunable parameters) simulated daily water fraction.Left panel: VECTRI hydrology V1.2.6, middle panel: V1.3.0 varying maximum infiltrationImaxwith a constantCNof 85 and right panel: V1.3.0 varyingCNwith constantImaxof 500 mm day−1.
HYDREMATS model. This is due to the use of several calibration parameters to improve the performance of a single model metric; the higher degrees of freedom in the tuning parameter set leading to model equifinality. Beven discusses this in the context of hydrological models [56], but it is common to any (especially nonlinear) modelling system with multiple uncertain parameters. For example, many thousands of a climate model parameter settings produced present-day simulations of global mean temperature deemed an acceptable representation of reality in the climateprediction.net project [57,58].
The VECTRI new parametrization V1.3.0, especially with fixedCN, showed good agree-ment with HYDREMATS at lowerwmaxvalues relative to V1.2.6. In addition, although the
VECTRI surface hydrology schemes are considerably less complex relative to HYDREMATS, the model parameters closely mimic processes they are meant to represent as seen inFig 3.
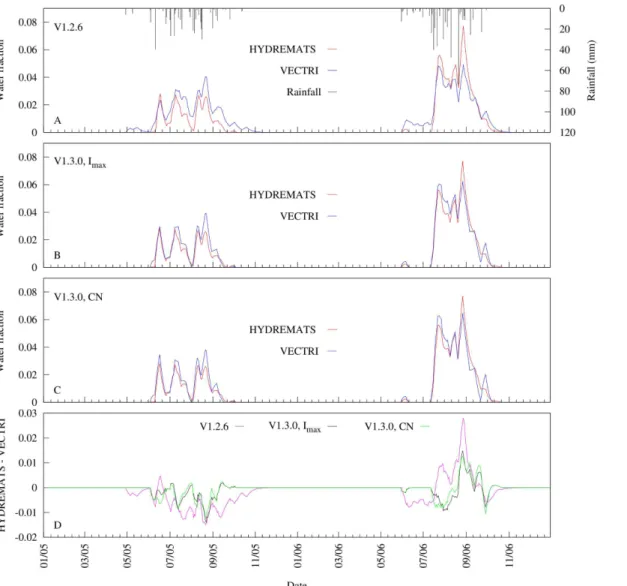
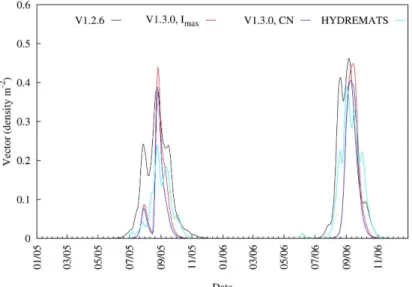
Fig 4shows an example of a 7-day moving average time series of simulated water fraction by the HYDREMATS and the two VECTRI schemes using combinations of parameters that
Fig 4. Comparison of 7-day moving average time series of simulated water fraction from HYDREMATS and VECTRI schemes.The VECTRI schemes time series were generated from a sets of VECTRI calibrated parameters that minimize RMSE values with respect to HYDREMATS. (a) V1.2.6, (b) V1.3.0 varying maximum infiltration (Imax) assuming a constantCNof 85, (c) V1.3.0 varyingCNat a constantImaxof 500 mm day−1, and (d) the difference between HYDREMATS and VECTRI.
resulted in the lowest RMSE with respect to HYDREMATS (Table 1; seeS3 Dataset). The 7-day window was selected because it is the optimum time for successful completion of aquatic stage mosquito development [24]. The simulation results clearly demonstrate that the variabil-ity in the daily water fraction follows trends in rainfall relating to its inter-storm period, inten-sity, and frequency. There was a slight increase in recorded rainfall of about 69 mm (16%) from 2005 to 2006 with 2006 having shorter storm return period compared to 2005. The impact of rainfall variability on the model’s simulated daily pond fraction over the two year period highlights that rainfall sub-seasonal variability can be as important for transmission intensity as seasonal totals within the Banizoumbou village. Whereas greater inter-storm peri-ods may have little influence on the stability of permanent and semi-permanent ponds, they will cause desiccation of temporary ponds [30].
Fig 4further reveals that despite the simplicity of the VECTRI surface hydrology parametri-zation schemes, it is able to reproduce the fractional water coverage evolution as simulated by the HYDREMATS model, although the V1.3.0 scheme shows a further improvement (NSE= 0.95) relative to the V1.2.6 scheme (NSE= 0.85). The initial ponding occurring in the V1.2.6 scheme in 2005 as a result of two isolated rainfall events of order of 6 mm is absent in both the V1.3.0 and the HYDREMATS. Clearly in the area like Banizoumbou, these events are unlikely to cause ponding especially occurring at the onset of the monsoon season. However, the VECTRI model tends to overestimate and underestimate the HYDREMATS water fraction in 2005 and 2006, respectively. A possible reason for this disparity may be the different response of the two VECTRI schemes to different rainfall pattern. The relative magnitude of the water fraction predicted by the two models changes as the season progresses. This is partic-ularly apparent with VECTRI V1.2.6 in the 2006 season, where VECTRI predicts larger water fraction during the season onset, and lower fractions later in the season. Part of the disparity is due to the simple approach of the earlier surface hydrology scheme that does not account for run off. The rainfall events during the earlier season of 2006 are small in magnitude, and by introducing the curve-number based runoff scheme V1.3.0 prevents these events from produc-ing breedproduc-ing sites, in agreement with HYDREMATS. Nevertheless, further improvements could be made by including soil moisture, which would increase infiltration in the earlier sea-son when soil moisture is dry and reduce it in the later seasea-son, albeit at the cost of increasing the complexity of the scheme.
Furthermore, the difference in observed rainfall between the two years (see rainfall inFig 4) caused the simulated pond water fraction by both models to have a higher mean water frac-tional coverage in 2006 relative to 2005, more than expected by 117, 15, 72 and 75% for HYDREMATS, V1.2.6, V1.3.0 (fixedCN) and V1.3.0 (fixedImax) respectively.
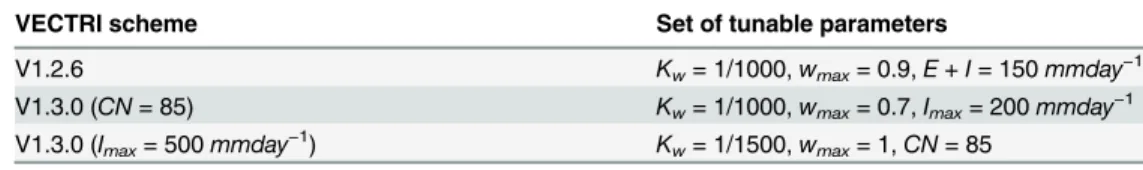
This variability in daily simulated water fraction due to the influence of rainfall also impacts vector abundance. For example, in this same study area, Bomblies et al. [28] captured 140% more mosquitoes at the same locations in the village in 2006 than in 2005. The results from the simulated mosquito vector abundance by both models are consistent with the observed increase in 2006 relative to 2005 (Fig 5;S4 Dataset) but with a wide range of increases. For Table 1. The VECTRI schemes set of tuning parameters that lead to the minimum RMSE between HYDREMATS and VECTRI simulated water fractions.
VECTRI scheme Set of tunable parameters
V1.2.6 Kw= 1/1000,wmax= 0.9,E+I= 150mmday−1
V1.3.0 (CN= 85) Kw= 1/1000,wmax= 0.7,Imax= 200mmday−1 V1.3.0 (Imax= 500mmday−1) Kw= 1/1500,wmax= 1,CN= 85
instance, HYDREMATS simulates a 84% increase between 2005 and 2006, while the three ver-sions of VECTRI, V1.2.6, V1.3.0 (fixedCN) and V1.3.0 (fixedImax), produced increases of 4, 54
and 36%, respectively. The differences in the VECTRI simulated vectors densities are due only to the changes in the surface hydrology scheme as all other model components are identical in the simulations, highlighting the critical importance of the hydrological component of the model, that is possibly the least constrained by observations and thus likely to be one of the key contributors to malaria model uncertainty. In particular, it is seen that the V1.2.6 suffers from a too early onset, particularly in 2005, due to its neglect of the runoff process, which resulted in light rains causing pooling in the pre-onset phase of the monsoon (Fig 5). From the two VEC-TRI schemes, larvae density simulated from the revised scheme showed better agreement (NSE= 0.70) with the HYDREMATS relative to the default scheme (NSE= 0.54). In fact, con-sidering the simplicity of the bulk larvae/vector schemes in VECTRI relative to the highly detailed agent based approach employed in HYDREMATS, and the fact that no parameter tun-ing of these components was performed (although it is recalled that the biomass carrytun-ing capacity parameter in VECTRI is adopted from HYDREMATS), the similarity between the conversion of water fraction to vector density by the two models is quite remarkable. This result supports the conjecture that with knowledge of the factors that affect surface hydrology, a simple model such as VECTRI can potentially be employed to simulate vector density and subsequently malaria transmission on a local scale.
VECTRI simulation with satellite products
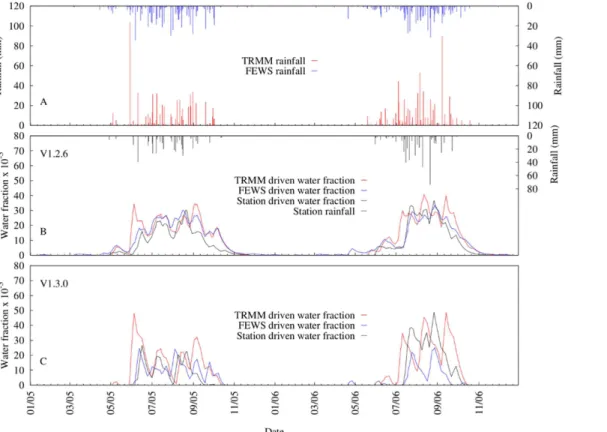
Over the two year study period, TRMM 3B42 and FEWS RFE2 recorded 1305.5 and 1181.4 mm of rainfall, about 47 and 33% respectively more than the station measurement records.
Fig 6shows the 7-day moving average time series of VECTRI (both V1.2.6 and V1.3.0 schemes) driven by both rainfall estimates and station observation simulated water fraction. The differ-ences in the rainfall also impact the simulated water fractions. For example, the mean simu-lated water fraction over the study period increased about 45 and 49% for V1.2.6 and V1.3.0 driven by TRMM 3B42 rainfall respectively, when compared to station runs. Interestingly, the Fig 5. Comparison of 7-day moving average time series of simulated mosquito vector abundance from HYDREMATS and VECTRI schemes.For the VECTRI experiments, identical calibrated parameters as forFig 4were used.
FEWS RFE2 mean simulated water fraction was about 34% more than station runs for V1.2.6 but about 25% less than that of station runs for V1.3.0. One reason for this disparity is that in V1.2.6 rainfall is used directly as input to drive the model while rainfall is converted to runoff in V1.3.0. To a certain extent, the initial abstraction term in runoff computation [49] sets the threshold below which rainfall amount generates no runoff. For instance, when setting CN= 85 in V1.3.0, rainfall less than9 mm will produce no runoff and leads to no increase in the water fraction but some increase in the water fraction occurs in V1.2.6. In addition to this, the runoff term in V1.3.0 is highly nonlinear and so greater recharge occurs with intense rain-fall events. Lastly, there is also the fact that infiltration in V1.3.0 adds another nonlinearity and therefore contributes to the different simulated water fraction results from the two schemes.
The relatively good agreement between simulated water fractions using station data versus the two satellite retrievals, although VECTRI driven by FEWS RFE2 (V1.2.6:NSE= 0.83; V1.3.0:NSE= 0.64) performed reasonably well compared to TRMM ((V1.2.6:NSE= 0.55; V1.3.0:NSE= 0.47). This further reveals that there were few heavy rainfall events recorded by the station that were missed by FEWS RFE2 or TRMM 3B42. It is the intense rainfall events that contribute most to ponding and thus greatly influences the simulated water fraction as shown inFig 6. Light rainfall events that the satellites may miss are less important for ponding. The results clearly show that the greatest disparities between VECTRI simulated water frac-tions occur on days when either TRMM 3B42 or FEWS RFE2 record high rainfall amount but little or no rainfall is recorded by the ground station or vice versa.
Another important finding of the VECTRI model driven by TRMM 3B42 is the ability of the surface hydrology scheme to simulate sub-seasonal rainfall variability impacts on both Fig 6. Comparison of 7-day moving average time series between VECTRI simulated water fraction driven by station rainfall, TRMM 3B42 and FEWS RFE2 rainfall estimates.(a) TRMM and FEWS RFE2, (b) V.1.2.6 scheme predicted water fraction and (d) V.1.3.0 scheme predicted water fraction.
water fraction dynamics and vector abundance. TRMM 3B42 recorded almost the same amount of rainfall in 2005 (653.1 mm) and 2006 (652.4 mm) but with a variable sub-seasonal pattern (see TRMM 3B42 rainfall inFig 6). The VECTRI simulated water fraction and mos-quito vector abundance showed a difference of about 18 and 43% respectively, for V1.3.0 and 1 and 5% respectively, for V1.2.6.
Conclusions
The challenge of validating surface hydrology parametrizations of dynamical malaria models arises from the lack of data from both field observations or remote sensing techniques due to the small spatial scales of the key malaria vector habitats. To partially address this, the HYDRE-MATS high resolution village-scale model that explicitly simulates individual ponds was used to provide a proxy for high resolution observations of breeding sites and used to evaluate the performance of the bulk parametrization scheme for water fraction used in the regional-scale malaria model, VECTRI. In addition to the default scheme, a modified scheme is proposed that accounts for pond geometry more realistically and also incorporates the nonlinearities of the surface runoff and the infiltration processes.
The results reveal that both VECTRI surface hydrology schemes were able to reproduce sea-sonal and intraseasea-sonal variability in pond water fraction (NSE>0.85), with the modified scheme able to produce a closer match to the explicit benchmark model, HYDREMATS. How-ever, the default VECTRI model tended to overestimate and underestimate the HYDREMATS water fraction in 2005 and 2006, respectively, and overestimate water fraction early in the rainy season. Accounting for run-off processes in a revised scheme improved this bias, and lead to more accurate predictions of the ponding onset at the start of the rainy season, although it is possible that further improvement could be made by representing soil moisture in the model, albeit at the cost of greatly increasing the model complexity and numerical cost. The results indicate that, after calibration, a simple scheme is able to represent the evolution of the ensem-ble statistics of small-scale breeding sites.
Numerous malaria endemic regions are characterized by inadequate ground observations of rainfall and thus the impact of replacing the local ground-based station measurements with remotely sensed retrievals of rainfall from FEWS RFE2 and TRMM 3B42 was assessed. Despite the contrasting scales of the measurements and the uncertainties related to the retrieval algo-rithms, the study showed that satellite data could nevertheless produce a reasonable simulation of the sub-seasonal evolution of the pond fraction for this area.
parameters using information such as district case data, however, it is clear that this calibration step represents a considerable challenge.
Supporting Information
S1 Dataset. A complete HYDREMATS simulated daily water depth for the entire study area and period.These text files are named according to each day using Julian day numbers. (GZ)
S2 Dataset. A complete set of VECTRI simulated outputs (both default and modified schemes) for various range of tuning parameters.These NetCDF files can be viewed using ncview.
(GZ)
S3 Dataset. Files containing HYDREMATS and VECTRI (using set of parameters given by
Table 1) simulated water fractions.
(GZ)
S4 Dataset. Files containing HYDREMATS and VECTRI (using set of parameters given by
Table 1) simulated vector density.
(GZ)
Author Contributions
Conceived and designed the experiments: EOA AMT. Performed the experiments: EOA AMT AB. Analyzed the data: EOA AMT AB. Wrote the paper: EOA ATM AB.
References
1. Fillinger U, Sonye G, Killeen GF, Knols BGJ, Becker N. The practical importance of permanent and semipermanent habitats for controlling aquatic stages of Anopheles gambiae sensu lato mosquitoes: operational observations from a rural town in western Kenya. Tropical Medicine & International Health. 2004; 9(12):1274–1289. doi:10.1111/j.1365-3156.2004.01335.x
2. Minakawa N, Sonye G, Yan G. Relationships between occurrence of Anopheles gambiae sl (Diptera: Culicidae) and size and stability of larval habitats. Journal of medical entomology. 2005; 42(3):295– 300. PMID:15962777
3. Sattler MA, Mtasiwa D, Kiama M, Premji Z, Tanner M, Killeen GF, et al. Habitat characterization and spatial distribution of Anopheles sp. mosquito larvae in Dar es Salaam (Tanzania) during an extended dry period. Malaria Journal. 2005; 4(1):4. doi:10.1186/1475-2875-4-4PMID:15649333
4. Mutuku FM, Bayoh MN, Gimnig JE, Vulule JM, Kamau L, Walker ED, et al. Pupal habitat productivity of Anopheles gambiae complex mosquitoes in a rural village in western Kenya. The American journal of tropical medicine and hygiene. 2006; 74(1):54–61. PMID:16407346
5. Awolola T, Oduola A, Obansa J, Chukwurar N, Unyimadu J. Anopheles gambiae ss breeding in polluted water bodies in urban Lagos, southwestern Nigeria. Journal of Vector Borne Diseases. 2007; 44 (4):241. PMID:18092529
6. Majambere S, Fillinger U, Sayer DR, Green C, Lindsay SW. Spatial distribution of mosquito larvae and the potential for targeted larval control in The Gambia. The American journal of tropical medicine and hygiene. 2008; 79(1):19. PMID:18606759
7. Imbahale SS, Paaijmans KP, Mukabana WR, van Lammeren R, Githeko AK, Takken W. A longitudinal study on Anopheles mosquito larval abundance in distinct geographical and environmental settings in western Kenya. Malaria Journal. 2011; 10(1):81. doi:10.1186/1475-2875-10-81PMID:21477340
8. Minakawa N, Dida GO, Sonye GO, Futami K, Njenga SM. Malaria vectors in Lake Victoria and adjacent habitats in western Kenya. PLoS One. 2012; 7(3):e32725. doi:10.1371/journal.pone.0032725PMID: 22412913
10. Gimnig JE, Ombok M, Kamau L, Hawley WA. Characteristics of larval anopheline (Diptera: Culicidae) habitats in western Kenya. Journal of Medical Entomology. 2001; 38(2):282–288. doi: 10.1603/0022-2585-38.2.282PMID:11296836
11. Koenraadt C, Githeko A, Takken W. The effects of rainfall and evapotranspiration on the temporal dynamics of Anopheles gambiae ss and Anopheles arabiensis in a Kenyan village. Acta tropica. 2004; 90(2):141–153. doi:10.1016/j.actatropica.2003.11.007PMID:15177140
12. Himeidan YE, Zhou G, Yakob L, Afrane Y, Munga S, Atieli H, et al. Habitat stability and occurrences of malaria vector larvae in western Kenya highlands. Malaria Journal. 2009; 8:234. doi: 10.1186/1475-2875-8-234PMID:19845968
13. Kilian A, Langi P, Talisuna A, Kabagambe G. Rainfall pattern, El Nino and malaria in Uganda. Trans R Soc Trop Med Hyg. 1999; 93(1):22–3. doi:10.1016/S0035-9203(99)90165-7PMID:10492781
14. Lindsay SW, Bødker R, Malima R, Msangeni HA, Kisinza W. Effect of 1997–98 EI Niño on highland malaria in Tanzania. The Lancet. 2000; 355(9208):989–990. doi:10.1016/S0140-6736(00)90022-9
15. Thomson MC, Doblas-Reyes FJ, Mason SJ, Hagedorn R, Connor SJ, Phindela T, et al. Malaria early warnings based on seasonal climate forecasts from multi-model ensembles. Nature. 2006; 439 (7076):576–579. doi:10.1038/nature04503PMID:16452977
16. Lowe R, Chirombo J, Tompkins AM. Relative importance of climatic, geographic and socio-economic determinants of malaria in Malawi. Malaria journal. 2013; 12(1):416. doi:10.1186/1475-2875-12-416 PMID:24228784
17. Kelly-Hope LA, Hemingway J, McKenzie FE. Environmental factors associated with the malaria vectors Anopheles gambiae and Anopheles funestus in Kenya. Malaria journal. 2009; 8(1):268. doi:10.1186/ 1475-2875-8-268PMID:19941637
18. Molineaux L, Gramiccia G. The Garki Project. Research on the epidemiology and control of malaria in the Sudan Savanna of West Africa. World Health Organization. 1980;.
19. Bomblies A. Modeling the role of rainfall patterns in seasonal malaria transmission. Climatic change. 2012; 112(3–4):673–685. doi:10.1007/s10584-011-0230-6
20. Paaijmans KP, Wandago MO, Githeko AK, Takken W. Unexpected high losses of Anopheles gambiae larvae due to rainfall. PLoS One. 2007; 2(11):e1146. doi:10.1371/journal.pone.0001146PMID: 17987125
21. Patz JA. Predicting key malaria transmission factors, biting and entomological inoculation rates, using modelled soil moisture in Kenya. Tropical Medicine & International Health. 1998; 3(10):818–827. doi: 10.1046/j.1365-3156.1998.00309.x
22. Montosi E, Manzoni S, Porporato A, Montanari A. An ecohydrological model of malaria outbreaks. Hydrology and Earth System Sciences. 2012; 16(8):2759–2769. doi:10.5194/hess-16-2759-2012
23. Shaman J, Stieglitz M, Stark C, Le Blancq S, Cane M. Using a dynamic hydrology model to predict mos-quito abundances in flood and swamp water. Emerging Infectious Diseases. 2002; 8(1):8.
24. Depinay JMO, Mbogo CM, Killeen G, Knols B, Beier J, Carlson J, et al. A simulation model of African Anopheles ecology and population dynamics for the analysis of malaria transmission. Malaria Journal. 2004; 3(1):29. doi:10.1186/1475-2875-3-29PMID:15285781
25. Hoshen MB, Morse AP. A weather-driven model of malaria transmission. Malaria Journal. 2004; 3 (1):32. doi:10.1186/1475-2875-3-32PMID:15350206
26. Lunde TM, Korecha D, Loha E, Sorteberg A, Lindtjørn B. A dynamic model of some malaria-transmitting
anopheline mosquitoes of the Afrotropical region. I. Model description and sensitivity analysis. Malar J. 2013; 12(1):28. doi:10.1186/1475-2875-12-28PMID:23342980
27. Tompkins AM, Ermert V. A regional-scale, high resolution dynamical malaria model that accounts for population density, climate and surface hydrology. Malar J. 2013; 12:65. doi: 10.1186/1475-2875-12-65PMID:23419192
28. Bomblies A, Duchemin JB, Eltahir EAB. Hydrology of malaria: Model development and application to a Sahelian village. Water Resour Res. 2008; 44:W12445.
29. Bomblies A, Duchemin JB, Eltahir EAB. A mechanistic approach for accurate simulation of village scale malaria transmission. Malaria journal. 2009; 8(1):223. doi:10.1186/1475-2875-8-223PMID:19799793
30. Gianotti RL, Bomblies A, Eltahir EA. Hydrologic modeling to screen potential environmental manage-ment methods for malaria vector control in Niger. Water resources research. 2009; 45(8). doi:10.1029/ 2008WR007567
32. Yamana TK, Eltahir EAB. On the use of satellite-based estimates of rainfall temporal distribution to sim-ulate the potential for malaria transmission in rural Africa. Water Resources Research. 2011; 47(2): W02540. doi:10.1029/2010WR009744
33. Huffman GJ, Bolvin DT, Nelkin EJ, Wolff DB, Adler RF, Gu G, et al. The TRMM multisatellite precipita-tion analysis (TMPA): Quasi-global, multiyear, combined-sensor precipitaprecipita-tion estimates at fine scales. Journal of Hydrometeorology. 2007; 8(1):38–55. doi:10.1175/JHM560.1
34. Herman A, Kumar VB, Arkin PA, Kousky JV. Objectively determined 10-day African rainfall estimates created for famine early warning systems. International Journal of Remote Sensing. 1997; 18 (10):2147–2159. doi:10.1080/014311697217800
35. Iguchi T, Kozu T, Meneghini R, Awaka J, OKAMOTO K. Rain-profiling algorithm for the TRMM precipi-tation radar. Journal of Applied Meteorology. 2000; 39(12):2038–2052. doi:10.1175/1520-0450(2001) 040%3C2038:RPAFTT%3E2.0.CO;2
36. Love TB, Kumar V, Xie P, Thiaw W. A 20-year daily Africa precipitation climatology using satellite and gauge data. In: American Meteorological Society Conference on Applied Climatology, Seattle, WA; 2004.
37. Oesterholt M, Bousema J, Mwerinde O, Harris C, Lushino P, Masokoto A, et al. Spatial and temporal variation in malaria transmission in a low endemicity area in northern Tanzania. Malaria Journal. 2006; 5(1):98. doi:10.1186/1475-2875-5-98PMID:17081311
38. Bøgh C, Lindsay SW, Clarke SE, Dean A, Jawara M, Pinder M, et al. High spatial resolution mapping of
malaria transmission risk in the Gambia, west Africa, using LANDSAT TM satellite imagery. The Ameri-can journal of tropical medicine and hygiene. 2007; 76(5):875–881. PMID:17488908
39. Ageep TB, Cox J, M’oawia MH, Knols BGJ, Benedict MQ, Malcolm CA, et al. Spatial and temporal dis-tribution of the malaria mosquito Anopheles arabiensis in northern Sudan: influence of environmental factors and implications for vector control. Malaria Journal. 2009; 8(1):123. doi: 10.1186/1475-2875-8-123PMID:19500425
40. Leduc C, Favreau G, Schroeter P. Long-term rise in a Sahelian water-table: The Continental Terminal in south-west Niger. Journal of hydrology. 2001; 243(1):43–54. doi:10.1016/S0022-1694(00)00403-0
41. Ramier D, Boulain N, Cappelaere B, Timouk F, Rabanit M, Lloyd CR, et al. Towards an understanding of coupled physical and biological processes in the cultivated Sahel–1. Energy and water. Journal of Hydrology. 2009; 375(1):204–216. doi:10.1016/j.jhydrol.2008.12.002
42. Favreau G, Cappelaere B, Massuel S, Leblanc M, Boucher M, Boulain N, et al. Land clearing, climate variability, and water resources increase in semiarid southwest Niger: A review. Water Resources Research. 2009; 45(7).
43. Desconnets JC, Taupin JD, Lebel T, Leduc C. Hydrology of the HAPEX-Sahel Central Super-Site: sur-face water drainage and aquifer recharge through the pool systems. Journal of Hydrology. 1997; 188:155–178. doi:10.1016/S0022-1694(96)03158-7
44. Martin-Rosales W, Leduc C. Dynamiques de vidange d’une mare temporaire au Sahel: l’exemple de Banizoumbou (Sud-Ouest du Niger). Comptes Rendus Geoscience. 2003; 335(5):461–468.
45. Garmendia A, Pedrola-Monfort J. Simulation model comparing the hydroperiod of temporary ponds with different shapes. Limnetica. 2010; 1(29):145–152.
46. Idso S. Relative rates of evaporative water losses from open and vegetation covered water bodies. Water resources bulletin. 1981; 17(1):1. doi:10.1111/j.1752-1688.1981.tb02587.x
47. Hayashi M, Van der Kamp G. Simple equations to represent the volume-area-depth relations of shallow wetlands in small topographic depressions. Journal of Hydrology. 2000; 237(1–2):74–85. doi:10.1016/ S0022-1694(00)00300-0
48. Asare EO, Tompkins AM, Amekudzi LK, Ermert V. A breeding site model for regional, dynamical malaria simulations evaluated using in situ temporary ponds observations. Geospatial health. 2015;: Submitted.
49. USDA S. National Engineering Handbook, Section 4: Hydrology. Washington, DC. 1972;.
50. Hoogmoed W, Stroosnijder L. Crust formation on sandy soils in the Sahel I. Rainfall and infiltration. Soil and tillage research. 1984; 4(1):5–23. doi:10.1016/0167-1987(84)90013-8
51. Stroosnijder L, Hoogmoed W. Crust formation on sandy soils in the Sahel II. Tillage and its effect on the water balance. Soil and tillage research. 1984; 4(4):321–337. doi:10.1016/0167-1987(84)90032-1
52. Minke AG, Westbrook CJ, van der Kamp G. Simplified volume-area-depth method for estimating water storage of prairie potholes. Wetlands. 2010; 30(3):541–551. doi:10.1007/s13157-010-0044-8
54. Pollard D, Thompson SL. Use of a land-surface-transfer scheme (LSX) in a global climate model: the response to doubling stomatal resistance. Global and Planetary Change. 1995; 10(1):129–161. doi:10. 1016/0921-8181(94)00023-7
55. Nash J, Sutcliffe J. River flow forecasting through conceptual models part I—A discussion of principles. Journal of hydrology. 1970; 10(3):282–290. doi:10.1016/0022-1694(70)90255-6
56. Beven K. A manifesto for the equifinality thesis. Journal of hydrology. 2006; 320(1):18–36. doi:10. 1016/j.jhydrol.2005.07.007
57. Murphy JM, Sexton DM, Barnett DN, Jones GS, Webb MJ, Collins M, et al. Quantification of modelling uncertainties in a large ensemble of climate change simulations. Nature. 2004; 430(7001):768–772. doi:10.1038/nature02771PMID:15306806
58. Stainforth DA, Aina T, Christensen C, Collins M, Faull N, Frame DJ, et al. Uncertainty in predictions of the climate response to rising levels of greenhouse gases. Nature. 2005; 433(7024):403–406. doi:10. 1038/nature03301PMID:15674288
![Fig 1. Schematic of the modified hydrology scheme adapted from Asare et al. [48]. Precipitation (P) is assumed to fall homogeneously across the grid- grid-cell](https://thumb-eu.123doks.com/thumbv2/123dok_br/18254682.342695/6.918.92.697.116.348/schematic-modified-hydrology-scheme-adapted-precipitation-assumed-homogeneously.webp)