A study of a solar eclipse using a photocell
(Um estudo do eclipse solar usando foto-c´elula)J.A. Liendo1and G.H. Chac´ın
Physics Department, Sim ´on Bol´ıvar University, Caracas, Venezuela Recebido em 12/07/04; Aceito em 13/09/04
In this work we measured light intensity as a function of time during a total solar eclipse using a solar cell. The measured intensity was corrected for the detector response and compared with a mathematical expression that represents the uncovered apparent area of the solar disk as a function of time. By no means, this corrected intensity is linearly related to the uncovered area, this being due to effects such as the solar corona luminosity, the limb darkening and light scattered in the atmosphere. Estimates of the fraction of light that causes this devi-ation from linearity are given.
Keywords:solar eclipse, light intensity measurements, calibration, photocell.
Neste trabalho, medimos a intensidade da luz como func¸˜ao do tempo durante um eclipse total do Sol usando uma c´elula solar. A intensidade medida foi ajustada pela resposta do detector e comparada com uma express˜ao matem´atica que representa a ´area aparente n˜ao coberta do disco solar como func¸˜ao do tempo. De nenhum modo, esta intensidade ajustada est´a linearmente relacionada `a ´area n˜ao coberta, sendo devida a efeitos tais como a luminosidade da coroa, escurecimento do limbo e a luz espalhada na atmosfera. Estimativas da frac¸˜ao de luz que causa este desvio da linearidade s˜ao dadas.
Palavras-chave:eclipse solar, medida de intensidade da luz, calibrac¸˜ao, foto-c´elula.
1. Introduction
Anybody observing a solar eclipse for the first time would perhaps expect a proportional relationship be-tween light intensity and the uncovered apparent area of the sun. Although it is well known that the eye ad-justs to ambient lighting conditions and its response is highly non-linear, it was notorious, to the naked eye, that light intensity was high even when the solar disk was appreciably covered. Only few minutes before the beginning of totality, a significant intensity decrease occurred. This observation was consistent with the readings of the solar cell we used in this work.
In the theoretical section, we work out an expres-sion for the uncovered apparent area of the solar disk as a function of time. In the experimental section, we present the simple equipment we used to measure light intensity and detector response. From a
discus-sion based on both the measured light intensity and the theoretical area mentioned above, we show the exis-tence, at sea level, of an excess of light relative to the light that would be detected if the solar disk were a ho-mogeneous light emitter and contributions such as the solar corona luminosity and light scattered in the atmo-sphere did not exist. Finally, we propose estimates for the fraction of this light excess as a function of time during the eclipse by use of a simple model.
2. Theory
We aim to deduce a formula for the uncovered apparent solar area, A, as a function of the penetration length,x,
defined in Fig. 1. Although the sun is bigger than the moon, the fact that it is proportionally farther away, im-plies that both bodies subtend approximately the same solid angle. We define the apparent areas of the solar
1Enviar correspondˆencia para J.A. Liendo. E-mail: [email protected].
and lunar disks as the areas of the images of the sun and the moon if they were projected on a screen. Obvi-ously, the sizes of these areas and their corresponding radii depend on the projection device used but they will maintain a fixed ratio between them. In order to obtain the final expression, A = A(x), we define R1 and R2
as the apparent solar and lunar radii respectively and introduce the variable λ and other intermediate ones shown in Fig. 2.
Figure 1 - Penetration length,x, corresponding to the apparent solar
area blocked (shaded region) by the observed lunar disk (moving to the right) as the eclipse occurs. The uncovered apparent solar area, A(x), is given by Eq. (1).
Figure 2 - The moon blocking the sun during the eclipse. The cov-ered solar area is equal to D1+ D2. The rest of the variables shown (x,λ,θandϕ)are defined to facilitate the deduction of a formula
for the uncovered solar area A. The figure is not drawn to scale.
The uncovered apparent solar area is given by
A=πR21−(D1+D2) (1)
where D1+D2 represents the shadow area indicated in
Figs. 1 and 2. With the help of Fig. 3, Eq. (1) can be written as
A=πR2
1−[(S1−T1) + (S2−T2)]
A=πR2
1−(S1+S2) + (T1+T2) (2)
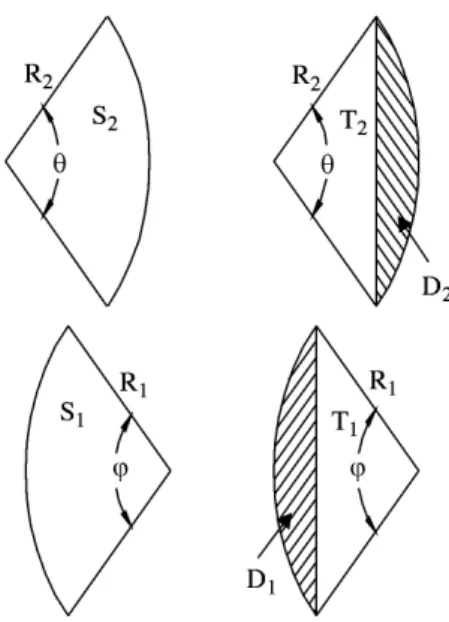
Figure 3 - Sectional areas of the solar and lunar disks, S1and S2 re-spectively, and their corresponding relationships with the areas D1 and D2previously shown in Fig. 2 ( D1=S1-T1and D2=S2-T2).
The relationships between the areas Di, Tiand Si
(i = 1,2) can be obtained from Fig. 3. From that figure,
S1+S2 = 1 2(φR
2 1+ϑR
2
2) (3)
and from Fig. 4,
T1+T2 = (R2−x+R1)
q
R2
2−ℓ2 (4)
where 0 < x < 2R1. Note that Fig. 4 comes from
Fig. 2.
Figure 4 - Diagram used to facilitate the deduction of a mathemat-ical expression (Eq. 4) relating the sum of the areas T1 and T2 (shown in Fig. 3) with R1, R2,xandλ.
Inserting Eqs. (3) and (4) into Eq. (2)
A(x) =πR2 1−
1 2(ϑR
2 2+φR
2 1) + (R2+R1−x)
p
R2 2−ℓ
From Figs. 2 and 4,
h2=R22−ℓ 2
=R12−(R2−x+R1−ℓ)2 (6)
After some algebra we obtain
ℓ= R 2
2+R1R2−x(R1+R2) + x
2
2
R2+R1−x
(7)
Finally, we substitute Eq. (6) in (5)
A(x) =πR2 1−R
2
1arccos(
R2+R1−x−ℓ
R1 )−
R2
2arccos( ℓ
R2) + (R2+R1−x)
p
R2
2−ℓ2 (8)
In order to obtain a relationship between R1 and
R2, we measure the time to reach totality (T= 90 min)
and totality duration (t= 205 s; from b to d in Fig. 5)
approximately. Using Fig. 5, we can write
Figure 5 - Several stages of the eclipse; (a) represents the begin-ning of the eclipse. The lunar disk (bigger shaded circle moving to the right) starts blocking the sun; (b), (c) and (d) are the beginning, the middle and the end of totality respectively. The time measured from (b) to (d) was 205 s approximately.
2(R2−R1) =vt (9)
and
v= 2R1
T (10)
wherevis the velocity with which the lunar disk moves
across the sky blocking the solar disk. From (9) and (10), we get
R2=R1(1 +
t
T) (11)
Inserting the values given above, we have approxi-mated R2 to 1.04R1.
3. Experimental
The experiment was carried out on February 26, 1998, in Playa Tiraya, Paraguan´a Peninsula, Venezuela (12o
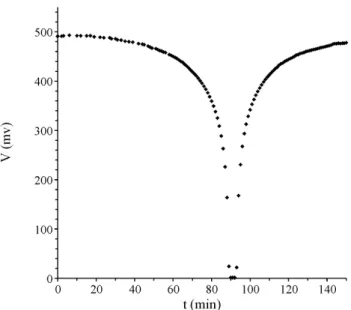
2’ North, 69o 50’ east). We used a rectangular (7 cm x 4 cm) solar cell connected to a multimeter. The cell was placed on a table facing the entire sky. Figure 6 shows the voltage reading as a function of time as the eclipse progressed.
Figure 6 - Measured voltage (in mV) as a function of time during the eclipse. Note the rapid signal changes as the eclipse approaches totality att= 90 min. The voltage readings of the last two points before totality (t= 88 and 89 min) are very uncertain. The solar cell was seeing the entire sky.
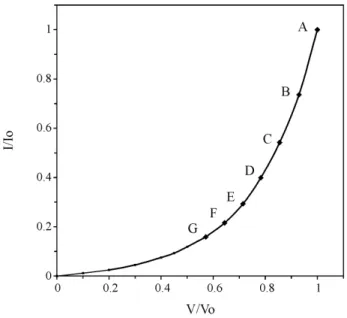
In order to convert the measured voltage to light in-tensity, we constructed a simple calibration device con-sisting of a parallelepiped cardboard box with a cross section of 38 cm x 38 cm and a height of 120 cm, as shown in Fig. 7. The detector was fixed at the inner bottom of the box and a window was opened at the top to let the solar light in. To be able to reduce the light intensity by known quantities, we constructed filters that were added one by one at different positions inside the calibration box. Each filter consisted of a piece of mosquito netting attached to a rectangular cardboard frame. From the observation of the netting under a mi-croscope, we concluded that it was fairly regular (with 1.2 mm x 1.7 mm openings in average). In a 300 mm x 235 mm piece of netting, we counted 157 x 162 open-ings, allowing us to estimate the ratio of the opened area to the total area of the netting to be approximately 0.74 which represents the attenuation of light intensity per filter. Figure 8 shows the calibration curve obtained that represents the cell response to the overall light in-tensity. The voltage, V, and light intensity, I, have been normalized to their corresponding maximum values V0
point B with one filter and so on. This simple calibra-tion allowed us not to worry about the cell response to every wavelength contained in the detected light.
Figure 7 - A transversal view of a parallelepiped box used to carry out a light intensity calibration. A solar cell connected to a volt-meter is set up at the bottom. For illustration purposes, three mosquito netting filters are shown inside the box. During the cali-bration experiment, 6 filters were added one by one to generate the calibration curve displayed in Fig. 8. The diagram is not drawn to scale.
Figure 8 - Calibration curve.
4. Results and discussion
Figure 9 shows graphs of the nomalized light intensity, I/I0, and the normalized uncovered apparent solar area,
A/A0, as a function of time during the eclipse (from
the beginning of the eclipse until the beginning of to-tality). For each V/V0 value obtained from the eclipse
data (Fig. 6), we determined the corresponding I/I0
value using the calibration curve shown in Fig. 8. The rapid intensity changes during the last two minutes be-fore totality (see Fig. 6) made the collection of reliable data very difficult during that period. The fact that the curves are different was expected as mentioned earlier. The I/I0 curve runs well above the A/A0 curve. This
is due to light, reaching the detector, originated in the solar corona and also, indirect light scattered by the terrestrial atmosphere and interplanetary dust. In addi-tion, the limb darkening (the observational fact that the light intensity decreases towards the rim of the solar disk) plays an important role (1). The purpose of this work was not to quantify each one of these contribu-tions but to estimate their overall effect.
Figure 9 - Plots of the normalized light intensity, I/I0(squares), and the normalized uncovered apparent solar area, A/A0(triangles), as a function of time from the beginning of the eclipse until the be-ginning of totality. I0and A0 are the light intensity and apparent solar disk area respectively when the sun is totally uncovered.
In a simple model where light reaching the detector comes directly only from the uncovered solar area and the solar disk is assumed to be a homogeneous light emitter, one could assume
I I0
= A
A0
but considering the effects mentioned in the previ-ous paragraph, we could write
I I0
=f A A0
+I
∗
I0
(13)
where I∗/I0 represents the fraction of light originated from the solar corona, limb darkening and light scatter-ing with f possibly bescatter-ing a function of the uncovered solar area satisfying 0 < f < 1. Note in Fig. 9, for example, that when a half of the solar disk is covered (A/A0= 0.5) att= 53 min, the measured light intensity
is not reduced to a half. On the contrary, I/I0 = 0.76.
The minimum contribution of I∗/I0 occurs for f-values close to 1 which means
I∗ I0 ≈
I I0 −
A A0
(14)
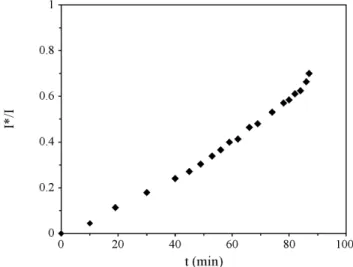
Figure 10 shows the ratio (I/I0 – A/A0)/(I/I0) =
I∗/I as a function of time. It is clearly observed that the percentage of light coming from the effects men-tioned earlier increases as the sun is blocked out during the eclipse. Note that it amounts to about 34% when A/A0= 0.5 att= 53 min.
Figure 10 - Estimates for the minimum fraction of light intensity due to the limb darkening, the solar corona and light scattering, I∗/I
= [ I/I0– A/A0]/[ I/I0], as a function of time during the eclipse.
5. Conclusions
In this work, we have determined light intensity as a function of time during a total solar eclipse observed in
the Caribbean area on February 26, 1998. From a com-parison between the measured intensity and a theoret-ical expression for the uncovered apparent solar area, we have shown that these quantities are not linearly re-lated. This has been interpreted as due to the detection, at sea level, of light that does not come directly from the solar disk, originated in the solar corona and light (from the solar disk or the corona) scattered by the at-mosphere. The thickness variations of the atmosphere should be considered. Also, the limb darkening con-tributes to produce the divergence from linearity men-tioned above. We found that as the eclipse progressed, the fraction of excess light, I∗/I, reaching the earth sur-face increased from at least 0.3 (when the solar disk was half covered) to 0.8 when the eclipse was close to the beginning of totality. The drastic decrease of light intensity observed two minutes before the beginning of totality, did not permit us to obtain reliable data during that period.
The low cost of the measuring devices (a solar cell + voltmeter) and materials used to make the calibra-tion box (cardboard and mosquito netting) indicates that studies involving the determination of solar light intensity can be easily implemented. No deep knowl-edge in physics and mathematics is required for any-body to reproduce the steps of this experience success-fully. However, the importance of a calibration (to con-vert a measured quantity such as a voltage into a phys-ical variable of interest such as an intensity) is taught. In addition, the simplicity of the calibration process, including the making of the calibration box and filters, can be used to encourage high school and college stu-dents to search for simple and cheap solutions in order to study scientific problems apparently difficult.
Acknowledgments
We thank undergraduate student Valentina Urrutia for her cooperation during the calibration measurements, the elaboration of the figures and the time she spent with us discussing several aspects of this work.