Mortality due to noncommunicable diseases
in Brazil, 1990 to 2015, according to estimates from
the Global Burden of Disease study
Mortalidade por doenças não transmissíveis no Brasil, 1990 a 2015,
segundo estimativas do estudo de Carga Global de Doenças
Deborah Carvalho Malta
I, Elisabeth França
II, Daisy Maria Xavier Abreu
III, Rosângela Durso Perillo
IV, Maíra Coube Salmen
V,
Renato Azeredo Teixeira
VI, Valeria Passos
VII, Maria de Fátima Marinho Souza
VIII, Meghan Mooney
IX, Mohsen Naghavi
XUniversidade Federal de Minas Gerais (UFMG), Belo Horizonte (MG), Brazil
ABSTRACT
CONTEXT AND OBJECTIVE: Noncommunicable diseases (NCDs) are the leading health problem globally and generate high numbers of premature deaths and loss of quality of life. The aim here was to describe the major groups of causes of death due to NCDs and the ranking of the leading causes of premature death between 1990 and 2015, according to the Global Burden of Disease (GBD) 2015 study estimates for Brazil.
DESIGN AND SETTING: Cross-sectional study covering Brazil and its 27 federal states.
METHODS: This was a descriptive study on rates of mortality due to NCDs, with corrections for garbage codes and underreporting of deaths.
RESULTS: This study shows the epidemiological transition in Brazil between 1990 and 2015, with increas-ing proportional mortality due to NCDs, followed by violence, and decreasincreas-ing mortality due to communi-cable, maternal and neonatal causes within the global burden of diseases. NCDs had the highest mortality rates over the whole period, but with reductions in cardiovascular diseases, chronic respiratory diseases and cancer. Diabetes increased over this period. NCDs were the leading causes of premature death (30 to 69 years): ischemic heart diseases and cerebrovascular diseases, followed by interpersonal violence, traf-ic injuries and HIV/AIDS.
CONCLUSION: The decline in mortality due to NCDs conirms that improvements in disease control have been achieved in Brazil. Nonetheless, the high mortality due to violence is a warning sign. Through main-taining the current decline in NCDs, Brazil should meet the target of 25% reduction proposed by the World Health Organization by 2025.
RESUMO
CONTEXTO E OBJETIVO: As doenças crônicas não transmissíveis (DCNT) são o principal problema de saúde global e geram um elevado número de mortes prematuras e perda de qualidade de vida. O objetivo foi descrever os principais grupos de causas de morte por DCNT e o ranking das causas de morte prema-tura entre 1990 a 2015, segundo estimativas do estudo Global Burden of Disease (GBD) 2015 para o Brasil.
TIPO DE ESTUDO E LOCAL: Estudo transversal do Brasil e 27 Unidades Federadas.
MÉTODOS: Estudo descritivo das taxas de mortalidade por DCNT, com correções para sub-registro e có-digos garbage.
RESULTADOS: O estudo aponta a transição epidemiológica no Brasil entre 1990 e 2015, com o crescimen-to da mortalidade proporcional por DCNT, seguida das violências, e com a redução das causas maternas, infecciosas e infantis na carga global de doenças. As DCNT cursaram com as taxas de mortalidade mais elevadas em todo o período, mas com declínio para as doenças cardiovasculares, respiratórias crônicas e câncer. O diabetes aumentou no período. As DCNT lideram entre as causas de morte prematura (30 a 69 anos): doenças isquêmicas do coração e doenças cerebrovasculares, seguidas de violência interpessoal, lesão no trânsito e HIV/aids.
CONCLUSÕES: A queda da mortalidade por DCNT conirma melhora do controle de doenças no país. Entretanto, a alta mortalidade por violência é um sinal de alerta. Mantendo-se a queda atual das DCNT, o Brasil deverá atingir as metas de redução propostas pela Organização Mundial de Saúde de 25% até 2025. IMD, PhD. Professor and Researcher, Department
of Mother and Child and Public Health, Nursing School, Universidade Federal de Minas Gerais (UFMG), Belo Horizonte (MG), Brazil. IIMD, PhD. Associate Professor, Department of Preventive and Social Medicine, Universidade Federal de Minas Gerais (UFMG), Belo Horizonte (MG), Brazil.
IIIPhD. Researcher, Nucleus of Education in Collective Health, School of Medicine, Universidade Federal de Minas Gerais (UFMG), Belo Horizonte (MG), Brazil.
IVMSc. Nurse, Municipal Health Department, Belo Horizonte, and Researcher, School of Medical Sciences, Universidade Federal de Minas Gerais (UFMG), Belo Horizonte (MG), Brazil.
VBA. Researcher and Strategic Planning Manager, Hospital Israelita Albert Einstein (HIAE), São Paulo (SP), Brazil.
VIStatistician, Postgraduate Program on Epidemiology, Faculdade de Medicina, Universidade Federal de Minas Gerais (UFMG), Belo Horizonte (MG), Brazil.
VIIMD, PhD. Professor, Faculdade de Ciências Médicas de Minas Gerais, Belo Horizonte (MG), Brazil.
VIIIMD, PhD. Director, Ministry of Health, Brasília (DF), Brazil.
IXPhD. Senior Engagement Manager in the Global Engagement Team, Institute for Health Metrics and Evaluation (IHME), Washington DC, United States.
XMD, MPH, PhD. Professor of Global Health, Institute for Health Metrics and Evaluation (IHME), Washington DC, United States.
KEY WORDS:
Chronic disease. Neoplasms. Diabetes mellitus. Respiratory tract diseases. Global burden of disease.
PALAVRAS-CHAVE:
INTRODUCTION
Noncommunicable diseases (NCDs) are the leading health prob-lem globally and generate high numbers of premature deaths and loss of quality of life, thus imposing a high degree of limitation and disability, as well as economic impacts for families and
soci-ety in general.1 he World Health Organization (WHO) has
esti-mated that NCDs account for about 70% of all global deaths, i.e. about 38 million deaths annually. Among these deaths, 16 mil-lion occur prematurely (under 70 years of age) and almost
28 million are in low and middle-income countries.2 he NCD
burden encompasses individuals in all socioeconomic strata and, more intensely, those belonging to vulnerable groups, such as the
elderly and those with low levels of education and income.3
In Brazil, NCDs also constitute a major health problem and, according to data from the national mortality information sys-tem, they corresponded to 72.6% of the causes of death in 2011. Cardiovascular diseases ranked irst among the causes of death,
followed by neoplasms, chronic respiratory diseases and diabetes.4,5
here is strong evidence correlating social determinants such as education, occupation, income, gender and ethnicity with the prevalence of NCDs and risk factors such as tobacco use,
harm-ful alcohol use, physical inactivity and unhealthy diet.1 If not
prop-erly prevented and managed, these diseases will require medical care with increasing costs due to incorporation of technology, in addition to causing loss of quality of life and premature deaths and having a great impact on the economy, thereby afecting coun-tries’ growth and having the capacity to reduce gross domestic
product (GDP) by up to 2% a year.2
In 2011, the United Nations (UN) recognized the magnitude of NCDs worldwide and established commitments to address this problem (United Nations, 2011) and, in 2013, WHO approved a
global action plan for prevention and control of these diseases.6
his global plan deined a priority goal consisting of a 25% rela-tive reduction in premature mortality due to NCDs (cardiovascu-lar diseases, cancer, diabetes or acute respiratory diseases) among
people between ages of 30 and 70 years by 2025.6 his overarching
goal is consonant with the national target deined by the National
Plan to Combat Noncommunicable Diseases 2011-2022.7
In 2015, the UN Assembly adopted a set of 17 goals as part of a sustainable development agenda, including the goal of “ensuring healthy lives and promoting well-being for all at all ages”. One of the targets was to “reduce by one third premature mortality due to non-communicable diseases through prevention and treatment and to promote mental health and wellbeing by 2030”, which contin-ued the commitment already made by the World Health Assembly
to achieve this by 2025.8
It has therefore become a global priority to monitor trends in mortality due to NCDs in order to ascertain whether national and global commitments will be achieved. Since 1990, the concept of
the Global Burden of Disease (GBD) has grown in importance for monitoring the burden of disease in various countries. By 2015 all databases had been updated, thus making it possible to analyze information from 1990 to 2015 for most of the world’s countries, including Brazil and its 27 federal units (i.e. states), regarding pre-mature death and disability due to more than 290 diseases, inju-ries and sequelae, along with the attributable burden due to risk
factors, for 20 age groups and both sexes.9
he methodology used for the GBD consists of major advances and a shit in paradigm in epidemiological analysis on databases. An integrated approach towards diseases and deaths is proposed, with standard methodology for analysis and correction of underrre-porting of deaths and garbage code. In this manner, it becomes
possible to compare countries, regions and subnational data.5,9
he GBD study method enables users to assess burden trends,
since time series data are adjusted and comparable.5,9
hus, use of GBD estimates provides a great opportunity to move forward in assessing mortality due to NCDs, thereby sup-porting monitoring eforts and achievement of future global and
national NCD reduction targets.6
OBJECTIVE
he objective of this study was to describe the major groups of causes of death due to noncommunicable diseases (NCDs) and the ranking of the leading causes of premature death between 1990 and 2015, according to the GBD 2015 study estimates for Brazil.
METHODS
his was a cross-sectional study based on data from the GBD 2015 study and also on the methods that it used, which have
already been described in detail in another article.9
he GBD 2015 study used data on causes of death available from 195 countries, including Brazil and its 27 states. Information on causes of death was gathered from vital registration systems, mor-tality surveillance systems, surveys, hospital records, police records and verbal autopsies. he GBD uses methodologies for correcting underreporting of deaths and garbage code. Correction of the codes uses evidence from the medical literature, expert opinions and statis-tical techniques to designate each item to the most probable causes
of death.9 In Brazil and its 27 federal states, the source of mortality
data is the Mortality Information System (Sistema de Informação
Sobre Mortalidade, SIM).5
59.6%
25.6%
14.8%
Communicable, maternal, neonatal and nutritional diseases Noncommunicable diseases
Injuries
that estimates of the number of deaths from each cause do not add
up to more than 100% of deaths in a given year.9-11
Ater producing estimates for the number of deaths from each of the 249 fatal outcomes included in the list of causes of the GBD 2015 study, the years of life lost (YLLs) due to premature death were calculated. For every death due to a particular cause, the number of years lost was estimated based on the highest life expectancy in
the deceased individual’s age group.9,11
he GBD study used a cause list that placed 249 causes of death within a four-level hierarchy. he irst level divided causes into three groups: communicable, maternal, neonatal and nutri-tional conditions; NCDs and injuries. he second level consisted of 20 major causes of diseases such as neonatal disorders, cardio-vascular diseases and traic injuries. he third level subdivided level 2 into types such as neonatal preterm birth complications, cerebrovascular disease and traic injuries; and the fourth level further subdivided those types in some cases, for example: isch-emic stroke and hemorrhagic stroke; and pedestrian road injuries, cyclist road injuries, motorcyclist road injuries, motor vehicle road
injuries and other road injuries.9
In the present study, the following NCDs were selected: car-diovascular diseases (I00-I99), respiratory diseases (J30-J98), neo-plasms (C00-C97) and diabetes mellitus (E10-E14). he study used the concept of premature mortality, as previously used by WHO and the UN, respectively in the Global Plan for NCDs (2013) and in the Sustainable Development Goals (SDG) for NCDs (2015), which take premature deaths to be those occurring before the age of 70 years. he 20 leading causes of death were analyzed using the level 3 aggregation of causes of death from the GBD 2016 study, in the age group from 30 to 69 years. he results were compared between the years 1990, 2005 and 2015.
There was no need to submit this study to a research eth-ics committee, since it was conducted on a public-domain sec-ondary database, without nominal identification, in accordance with Decree No. 7,724 of May 16, 2012, and Resolution No. 510 of April 7, 2016.
RESULTS
Figure 1 shows the relative distribution of deaths according to the three major groups of causes of death in Brazil for both sexes and the whole population. In 1990, proportional mortality due to NCDs corresponded to 59.6% of deaths (95% uncertainty inter-val, UI: 58.97-60.7); injuries, 14.8% (95% UI: 14.5-15.12); and communicable, maternal, neonatal and nutritional diseases, 25.6% (95% UI: 24.49-26.29). In 2015, proportional mortal-ity due to NCDs had increased to 75.8% (95% UI: 75.05-77.30); injury deaths had decreased to 12.4% (95% UI: 11.97-12.79); and communicable, maternal, neonatal and nutrition diseases had reduced to 11.8% (95% UI: 10.3 to 12.5).
Considering the total numbers of deaths for all ages, there was an increase of 49% in the absolute number over the period, while deaths due to NCDs increased by 89.7% and corresponded to 1.029 million deaths in 2015. As this is proportional mortality, this increase also relects population growth and changes in age structure.
he age-standardized death rates for all NCDs for the total population displayed a reduction from 818.6/100,000 (1990) (95% UI: 803.9-834.7) to 611.3/100,000 (2015) (95% UI: 589.8-633.9),
representing a reduction of 25.3% between 1990 and 2015 (Table 1).
Regarding the four groups of NCDs prioritized in the Brazilian and global NCD plans, cardiovascular diseases accounted for 424,058 deaths in 2015, with a rate reduction of 40.5% from 429.5/100,000 inhabitants (1990) (95% UI: 421.1-438.1) to 256/100,000 (2015) (95% UI: 246.3-268.3).
75.8%
12.4%
11.8%
Communicable, maternal, neonatal and nutritional diseases Noncommunicable diseases
Injuries
Figure 1. Proportions of numbers of deaths according to causes of death.
Level 1 analysis, Brazil 2015 Level 1 analysis, Brazil 1990
A
Neoplasms accounted for 236,345 deaths in 2015, and the rates went from 142.7/100,000 inhabitants (1990) (95% UI: 139.2-149.1) to 133.5/100,000 (2015) (95% UI: 127.9-140.4), i.e. they remained stable over the period. Chronic respiratory diseases accounted for 79,651 deaths in 2015, with a rate reduction of 28.9% from 69.9/100,000 inhabitants (1990) (95% UI: 67.8-71.9) to 49.7/100,000 (2015) (95% UI: 47.3-52.3). Diabetes mellitus accounted for 62,466 deaths in 2015, and the rates went from 35.9/100,000 inhabitants (1990) (UI: 34.8-37) to 37.5/100,000 (2015) (UI: 35.6-39.3), i.e. they remained stable
over the period (Table 1).
At state level, cardiovascular diseases predominated in all 27 federal states and there were reductions in rates between 1990 and 2015, ranging from 16.4% in Tocantins to 47.9% in Rio de Janeiro. he highest rate in 2015 was 353.2/100,000 inhabitants in Maranhão. Chronic respiratory diseases declined in most states, with the largest reduction in Minas Gerais (41.2%). he highest rate in 2015 was recorded in Acre: 77.5/100,000 inhabitants. In contrast, diabetes mellitus increased in most states, with Piauí showing the highest change (84.9%). Some states presented reductions in rates, and the most signiicant reductions were in São Paulo (28.5%) and in the Federal District (27.1%). he highest diabetes rate in 2015 was in Maranhão: 69.6/100,000 inhabitants. he level of neoplasms remained stable in most states and the highest rate in 2015 was in Amazonas: 155.1/100,000 inhabitants. here were reductions in total NCDs in most states between 1990 and 2015. he
high-est rate was in Paraíba: 697.3 per 100,000 inhabitants (Table 2).
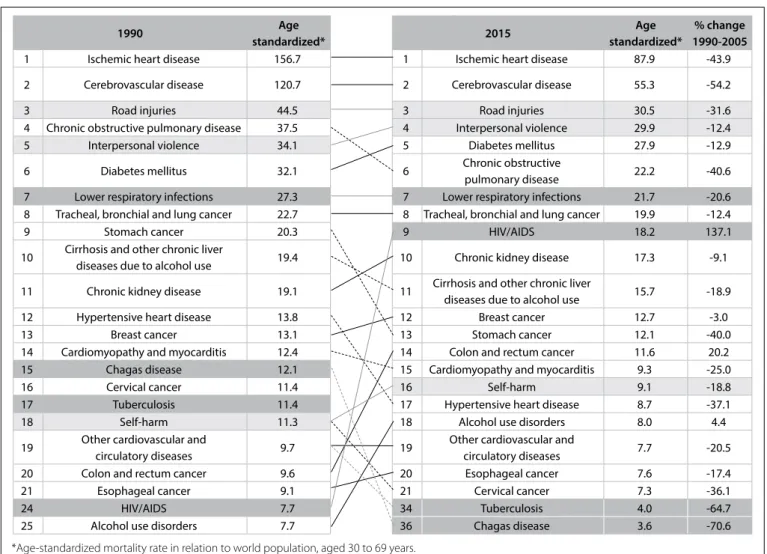
In the ranking of the 20 leading causes of premature death according to age-standardized rates (at 30 to 69 years of age) for the years 1990 and 2015, NCDs comprised 15 of them in 2015. At the third level of analysis according to the GBD approach, isch-emic heart diseases led throughout the period from 1990 to 2015, with a 43.9% reduction in rates over this period. Cerebrovascular
diseases were in second place in the ranking and reduced by 54.2% over the period. Road injury was in third place both in 1990 and in 2015, and interpersonal violence rose from ith to fourth place over the same period. Diabetes went from sixth to ith place in the ranking of causes of premature death in 2015, and was followed by chronic obstructive lung diseases (COPD), which fell from fourth to sixth place over the same period. Lower respiratory infections remained in seventh place and lung cancer remained in eighth
place over the period. HIV/AIDS increased from 24th place in 1990
to ninth in 2015. Also in 2015, chronic kidney disease was in 10th
place, cirrhosis and other chronic liver diseases in 11th, breast
can-cer in 12th, stomach cancer in 13th, colorectal cancer in 14th
(show-ing growth of 20% in its rate), cardiomyopathy 15th, self-harm in
16th, hypertensive heart disease in 17th, alcohol use disorder in 18th,
other cardiovascular disease in 19th, esophageal cancer in 20th and
cervical cancer in 21st position. Also noteworthy were the
consid-erable reductions in tuberculosis from 17th position in 1990 to 34th
in 2015 and Chagas disease from 15th to 36th (Figure 2).
DISCUSSION
It is evident that NCDs were addressed as a problem of health sur-veillance in Brazil between 1990 and 2015. Based on the results from this study, the burden of noncommunicable diseases has continuously gained in importance, followed by violence, while the biggest improvements came from the sharp reductions in the burden of communicable, maternal, neonatal and nutritional diseases. Age-standardized mortality rates for NCDs presented higher rates throughout the period but with declining trends for cardiovascular diseases and chronic respiratory diseases, while cancer and diabetes showed stable rates between 1990 and 2015 in Brazil.
Regarding premature mortality (at 30 to 69 years of age), NCDs accounted for 15 of the top 20 leading causes. Ischemic
Causes of death
Number of deaths Age-standardized death rates (per 100,000)
1990 2015 % change
1990-2015 1990 2015
% change 1990-2015
All causes 911,317 (896,944-925,847)
1,357,434
(1,312,612-1,400,906) 49.0
1,102.2 (1085.9-1118.6)
786.2
(761.2-810.3) -28.7 B - Noncommunicable diseases 542,832
(532,149-554,906)
1,029,499
(992,362-1,068,244) 89.7
818.6 (803.9-834.7)
611.3
(589.8-633.9) -25.3 B.1 - Neoplasms 105,275
(102,761-109,195)
236,345
(226,265-248,290) 124.5
142.7 (139.2-149.1)
133.5
(127.9-140.4) -6.5 B.2 - Cardiovascular diseases 267,634
(262,150-273,226)
424,058
(407,250-444,686) 58.4
429.5 (421.1-438.1)
256
(246.3-268.3) -40.4 B.3 - Chronic respiratory diseases 41,272
(40,138-42,445)
79,651
(76,015-83,698) 93.0
69.9 (67.8-71.9)
49.7
(47.3-52.3) -28.9 B.8.1 - Diabetes mellitus 23,802
(23,109-24,527)
62,466
(59,420-65,474) 162.4
35.9 (34.8-37)
37.5
(35.6-39.3) 4.4
Table 1. Age-standardized mortality rates for all causes of death and noncommunicable diseases (NCDs) and percentage changes, for
heart diseases presented the highest burden, followed by cerebro-vascular diseases, which occupied the second place in the rank-ing. Road injuries were in third place, followed by interpersonal violence, while HIV/AIDS appeared in ninth position.
he data shown here demonstrate the rapid epidemiological transition that Brazil has been undergoing, which has resulted
in a high burden of noncommunicable disease.12 hese changes
stem from the underlying demographic transition, with signii-cant decreases in fertility and birth rates, increased life expectancy, an increased proportion of elderly people, rapid urbanization,
eco-nomic and social growth and unhealthy lifestyles.7,12
Noncommunicable diseases are one of the major public health problems because of their contribution towards high numbers of premature deaths and loss of quality of life. hey lead to high
degrees of limitations and incapacity to conduct activities of daily living, and also have an economic impact on families, communi-ties and society.3,7,12,13
he burden of disease in Brazil shows the presence of increas-ingly pressing problems such as road injuries and interpersonal violence, which are the third and fourth leading causes of
prema-ture death.14,15 Another inding is the dramatic success in reducing
the burden of communicable, maternal, neonatal and nutritional diseases. his reduction has been particularly signiicant in rela-tion to the rapid nutrirela-tional transirela-tion, which has almost elimi-nated malnutrition in less than 30 years. However, this transition has also led to a situation in which more than half of the popula-tion is overweight and one ith is obese, consequent to changes
in dietary patterns and the sedentary nature of modern life.12,16,17
Region/states Cardiovascular diseases
Chronic respiratory
diseases Diabetes mellitus Neoplasms
Noncommunicable diseases 1990 2015 % Change 1990 2015 % Change 1990 2015 % Change 1990 2015 % Change 1990 2015 % Change Brazil 429.5 256.0 -40.4 69.9 49.7 -28.9 35.9 37.5 4.4 142.7 133.5 -6.5 818.6 611.3 -25.3 North
Acre 363.0 252.2 -30.5 79.8 77.5 -2.9 29.2 42.6 45.6 121.0 126.3 4.4 740.6 649.7 -12.3 Amapá 313.0 256.3 -18.1 54.5 52.2 -4.2 27.2 39.0 43.6 134.2 144.3 7.5 656.7 636.0 -3.2 Amazonas 363.4 236.9 -34.8 59.2 50.6 -14.5 34.2 43.7 28.0 154.1 155.1 0.7 749.1 629.9 -15.9 Pará 388.8 275.4 -29.2 61.0 56.1 -8.0 26.4 47.0 77.8 123.2 122.2 -0.8 733.0 632.9 -13.7 Rondônia 463.5 269.6 -41.8 83.3 61.6 -26.0 34.7 44.9 29.2 143.0 121.8 -14.8 869.0 630.0 -27.5 Roraima 373.1 234.9 -37.0 56.5 40.3 -28.7 46.6 52.7 13.1 139.3 129.1 -7.4 766.0 600.4 -21.6 Tocantins 389.6 325.8 -16.4 69.3 50.2 -27.6 31.2 49.4 58.2 106.2 119.0 12.1 727.6 685.7 -5.8
Northeast
Alagoas 459.1 312.4 -32.0 64.5 50.5 -21.8 50.3 68.1 35.3 104.8 103.0 -1.7 836.5 676.4 -19.1 Bahia 394.0 280.9 -28.7 61.6 53.8 -12.7 44.2 55.7 26.0 114.1 127.0 11.3 750.2 662.0 -11.8 Ceará 355.4 286.4 -19.4 51.5 44.0 -14.6 24.0 43.2 80.3 116.1 144.2 24.2 663.5 655.1 -1.3 Maranhão 497.0 353.2 -28.9 59.3 41.5 -30.0 49.6 69.5 40.0 129.3 119.2 -7.8 904.2 729.8 -19.3 Paraíba 386.0 318.0 -17.6 53.6 48.8 -8.9 40.9 64.3 57.3 99.2 124.9 25.9 708.7 697.3 -1.6 Pernambuco 426.1 291.4 -31.6 62.6 63.7 1.7 43.7 57.2 31.0 114.3 122.5 7.1 806.1 676.8 -16.0 Piauí 391.0 320.0 -18.2 53.9 37.3 -30.9 28.6 52.8 84.9 102.1 111.3 8.9 699.9 652.1 -6.8 Rio Grande do Norte 319.4 245.5 -23.1 34.8 32.5 -6.6 38.2 56.0 46.8 109.9 125.6 14.3 620.8 590.1 -4.9 Sergipe 368.2 267.5 -27.4 55.5 43.6 -21.4 50.3 64.6 28.2 112.3 119.2 6.2 728.3 643.9 -11.6
Southeast
Espírito Santo 443.3 254.9 -42.5 64.2 41.8 -34.9 28.7 33.0 15.2 141.8 128.2 -9.6 809.5 588.8 -27.3 Minas Gerais 436.8 240.9 -44.8 86.1 50.7 -41.2 32.9 29.2 -11.2 142.1 130.0 -8.5 845.1 587.7 -30.5 Rio de Janeiro 491.0 255.9 -47.9 72.0 44.7 -37.9 48.1 40.4 -16.0 156.9 135.3 -13.7 911.6 615.2 -32.5 São Paulo 427.5 229.9 -46.2 62.0 41.8 -32.7 34.1 24.4 -28.5 156.7 132.7 -15.3 825.5 559.2 -32.3
South
Paraná 486.3 261.8 -46.2 87.7 62.6 -28.6 28.7 37.4 30.3 160.2 147.1 -8.2 898.1 641.4 -28.6 Rio Grande do Sul 435.7 238.9 -45.2 93.5 61.0 -34.8 26.3 28.6 8.6 187.3 160.0 -14.6 873.3 611.6 -30.0 Santa Catarina 445.1 234.3 -47.4 98.9 58.2 -41.1 31.3 31.6 1.1 164.3 144.6 -12.0 872.7 590.2 -32.4
Center-West
Federal District 350.0 187.0 -46.6 53.0 33.4 -37.1 33.4 24.4 -27.1 142.6 117.9 -17.3 708.1 476.6 -32.7 Goiás 412.6 259.8 -37.0 103.2 68.7 -33.5 25.9 30.7 18.8 136.4 125.2 -8.3 818.0 620.8 -24.1 Mato Grosso 427.1 274.3 -35.8 71.3 60.9 -14.5 29.3 42.2 44.3 135.7 132.3 -2.6 800.7 648.3 -19.0 Mato Grosso do Sul 431.2 278.3 -35.5 66.0 50.9 -22.8 25.5 31.8 24.5 135.5 131.6 -2.9 790.3 629.4 -20.4
Table 2. Age-standardized mortality rates for noncommunicable diseases (NCDs) and percentage change according to Brazilian states,
he burden of NCDs encompasses individuals in all socio-economic strata and, more intensely, vulnerable groups such as
the elderly and those with low levels of education and income.1,3
hus, over the last few decades, Brazil has gone from the typi-cal mortality proile of a young population to a picture of more complex and costly diseases that are typical of the more advanced
age groups.12
NCDs constitute the largest health problem in Brazil.7,12
Estimates for this country have indicated that the losses of labor productivity and decreases in family income resulting from just three NCDs combined (diabetes, heart disease and stroke) con-tributed a loss of US$ 4.18 billion to the economy between 2006
and 2015.3 he direct costs correspond to the expenses involved
in medical assistance, medicines, hospitalizations, examinations, procedures, physiotherapy and rehabilitation. he indirect costs are linked to losses in production and income, productivity, jobs and absenteeism. he intangible costs are diicult to estimate and refer
to family income, informal care and other matters.18
his increase in the burden of NCDs is directly linked to some negative efects from the globalization process, rapid urbaniza-tion, sedentary life and high-calorie diets, along with tobacco and
alcohol consumption.1,7,13,19,20 hese behavioral risk factors have an
impact on the major metabolic risk factors, such as overweight/ obesity, high blood pressure and increased blood glucose, lipid and cholesterol levels, and these may result in diabetes, cardiovascular
disease, stroke and cancer, among other diseases.1,12,19,20
Also in Brazil, NCDs predominate as the main cause of mor-tality, especially cardiovascular diseases. However, the incidence of cardiovascular diseases and consequent mortality have been
declining over the last few decades.12 Cardiovascular diseases
result from metabolic risk factors, such as high blood pressure, inadequate diet, smoking, physical inactivity and other risk
fac-tors.1,20 Analysis on mortality trends in Brazil between 2000 and
2011 has shown that, despite an increase in the overall number of deaths due to cardiovascular diseases, the age-adjusted mortality
rates for these diseases declined by 24%.20 Healthcare delivered
Figure 2. Leading 20 causes of death: age-standardized mortality rate (30 to 69 years of age), rank and percentage change, for both
sexes; Brazil, from 1990 to 2015.
1990 Age
standardized* 2015
Age standardized*
% change 1990-2005
1 Ischemic heart disease 156.7 1 Ischemic heart disease 87.9 -43.9 2 Cerebrovascular disease 120.7 2 Cerebrovascular disease 55.3 -54.2
3 Road injuries 44.5 3 Road injuries 30.5 -31.6
4 Chronic obstructive pulmonary disease 37.5 4 Interpersonal violence 29.9 -12.4 5 Interpersonal violence 34.1 5 Diabetes mellitus 27.9 -12.9 6 Diabetes mellitus 32.1 6 Chronic obstructive
pulmonary disease 22.2 -40.6 7 Lower respiratory infections 27.3 7 Lower respiratory infections 21.7 -20.6 8 Tracheal, bronchial and lung cancer 22.7 8 Tracheal, bronchial and lung cancer 19.9 -12.4
9 Stomach cancer 20.3 9 HIV/AIDS 18.2 137.1
10 Cirrhosis and other chronic liver
diseases due to alcohol use 19.4 10 Chronic kidney disease 17.3 -9.1 11 Chronic kidney disease 19.1 11 Cirrhosis and other chronic liver
diseases due to alcohol use 15.7 -18.9 12 Hypertensive heart disease 13.8 12 Breast cancer 12.7 -3.0 13 Breast cancer 13.1 13 Stomach cancer 12.1 -40.0 14 Cardiomyopathy and myocarditis 12.4 14 Colon and rectum cancer 11.6 20.2 15 Chagas disease 12.1 15 Cardiomyopathy and myocarditis 9.3 -25.0
16 Cervical cancer 11.4 16 Self-harm 9.1 -18.8
17 Tuberculosis 11.4 17 Hypertensive heart disease 8.7 -37.1 18 Self-harm 11.3 18 Alcohol use disorders 8.0 4.4 19 Other cardiovascular and
circulatory diseases 9.7 19
Other cardiovascular and
circulatory diseases 7.7 -20.5 20 Colon and rectum cancer 9.6 20 Esophageal cancer 7.6 -17.4 21 Esophageal cancer 9.1 21 Cervical cancer 7.3 -36.1
24 HIV/AIDS 7.7 34 Tuberculosis 4.0 -64.7
25 Alcohol use disorders 7.7 36 Chagas disease 3.6 -70.6
by Brazil’s universal public healthcare system, which focuses on
primary prevention, has contributed towards this achievement.20
Reductions in heart disease mortality rates have varied accord-ing to socioeconomic status. A trend analysis on all heart diseases in the city of São Paulo from 1996 to 2010 showed that the decline in the risk of death presented a variable gradient: faster for people living in the wealthiest area and slower for people living in the
more deprived neighborhoods.21 Stroke mortality trends in Brazil
(1979-2009) have shown declines for all stroke subtypes.22 he risk
of death due to stroke is decreasing in all regions, but the fastest decline in mortality rates is in the wealthiest area, thus
contribut-ing to a situation of increascontribut-ing inequality.23
Cancer is already the second highest leading cause of death in most countries and it has been predicted that it will reach irst place
over the coming years.1 In Brazil, over the years studied here, there
was stability in the overall rate, but studies have shown distinct
trends according to cancer type, age, social status and sex.15,24-26
Among men, there has been an increase in mortality due to pros-tate and colorectal cancer, and a reduction in lung cancer. Among women, breast, lung and colorectal cancer mortality rates have
increased, while cervical and stomach cancer rates have declined.12,27
he incidence of diabetes is growing and it is already among the top ten causes of death worldwide, besides being an important cause of death due to cardiovascular disease. he increase in the death rate due to diabetes has been driven through the growth of the elderly population, the obesity epidemic and unhealthy
life-styles.28,29 he current study showed that the rate for Brazil was
sta-ble between 1990 and 2015, although it increased in several states. Chronic obstructive pulmonary disease (COPD) is the third highest leading cause of death among adults in Brazil. Previous stud-ies in Brazil have shown reductions of mortality due to chronic
respiratory diseases,12,30 and these have been attributed to advances
in access to primary healthcare and access to medications and
reduction of smoking.12
he national plan to combat NCDs in Brazil,19,31 WHO’s Global
Plan and Sustainable Development Goals have established the target of reducing premature mortality rates or mortality among adults
under 70 years of age caused by NCDs.6 he evidence from
stud-ies shows that Brazil is on track to meet the goal, since the burden arises from diseases that are sensitive to health promotion
interven-tions and care provision.12,17 his positive inding is directly related
to implementation of highly cost-efective interventions through the National Health System (Sistema Único de Saúde, SUS), such as expansion of primary care and wide distribution of drugs to the population that is at high risk of developing cardiovascular
dis-eases, as well as measures established to control tobacco use.12,17,20
his study also draws attention to the importance of external causes of death and the magnitude of such occurrences, caused by interpersonal violence and traic accidents. hese events are
particularly frequent among young people and contribute towards
premature mortality during the productive phase.14 Also
notewor-thy are premature deaths due to HIV, and the rise of HIV in the ranking of causes of premature mortality over the last few decades.
It is important to emphasize the need to ensure quality in mor-tality estimates in Brazil. Problems regarding the quality of infor-mation about deaths have arisen in the past. hus, analysis based on the GBD study is of great use, particularly for mortality assess-ment, since it uses methods for correction of underreporting of deaths and for redistribution of garbage codes (deaths attributed to causes that may not be the real causes of death or are not properly described). However, any process of data correction needs to be regarded with caution, since assumptions made in using these meth-ods may lead to overestimation or underestimation of the degree of coverage, thereby generating bias in the estimates of mortality
coverage.32,33here is still a long way to go to reduce these causes of
death and illness. he diseases described here have a long course and require a comprehensive longitudinal approach, with dedicated
investment in self-care and bonding.34 It is therefore essential to
reduce inequities within healthcare, so as to ensure access to care for the entire population, especially the most vulnerable groups, given the higher concentration of NCDs and their risk factors in
the low-income and low-education population.1,3
SUS and universal access to healthcare in Brazil act in a pro-tective manner, especially with regard to care for the great major-ity of the population. It is important to highlight the role of SUS in achieving the results regarding reduction in mortality due to
NCDs that are presented here.12,17,20
CONCLUSION
his study shows the epidemiological transition in Brazil between 1990 and 2015, with increasing proportional mortality due to NCDs, followed by violence, and decreasing mortality due to communicable, maternal and neonatal causes within the global burden of diseases. NCDs had the highest mortality rates over the whole period, but with reductions in cardiovascular diseases, chronic respiratory diseases and cancer. Diabetes increased over this period. NCDs were the leading causes of premature deaths (30 to 69 years of age).
REFERENCES
1. World Health Organization. Global status report on noncommunicable
diseases 2010. Geneva: World Health Organization; 2011. Available from:
http://apps.who.int/iris/bitstream/10665/44579/1/9789240686458_
eng.pdf. Accessed in 2017 (Feb 6).
2. World Health Organization. Health statistics and information systems.
Estimates for 2000-2015. Available from: http://www.who.int/healthinfo/
global_burden_disease/estimates/en/index1.html. Accessed in
3. Abegunde DO, Mathers CD, Adam T, Ortegon M, Strong K. The burden
and costs of chronic diseases in low-income and middle-income
countries. Lancet. 2007;370(9603):1929-38.
4. Malta DC, Moura L, Prado RR, et al. Mortalidade por doenças crônicas
não transmissíveis no Brasil e suas regiões, 2000 a 2011 [Chronic
non-communicable disease mortality in Brazil and its regions, 2000-2011].
Epidemiol Serv Saúde. 2014;23(4):599-608.
5. Marinho F, Passos VMA, França EB. Novo século, novos desaios: mudança
no peril da carga de doença no Brasil de 1990 a 2010 [New century,
new challenges: changes in the burden of disease proile in Brazil,
1990-2010]. Epidemiol Serv Saúde. 2016;25(4):713-24.
6. World Health Organization. Global action plan for the prevention
and control of noncommunicable disease 2013-2020. Geneva: World
Health Organization; 2013. Available from: http://apps.who.int/iris/
bitstream/10665/94384/1/9789241506236_eng.pdf. Accessed in
2017 (Feb 6).
7. Malta DC, Silva Júnior JB. O plano de ações estratégicas para o
enfrentamento das doenças crônicas não transmissíveis no Brasil e a
deinição das metas globais para o enfrentamento dessas doenças até
2025: uma revisão [Brazilian strategic action plan to combat chronic
non-communicable diseases and the global targets set to confront these
diseases by 2025: a review]. Epidemiol Serv Saúde. 2013;22(1):151-64.
8. Brasil. Organização das Nações Unidas no Brasil. Objetivos de
Desenvolvimento Sustentável. Available from: http://www.itamaraty.
gov.br/images/ed_desenvsust/ODSportugues12fev2016.pdf. Accessed
in 2017 (Feb 6).
9. GBD 2015 Risk Factors Collaborators. Global, regional, and national
comparative risk assessment of 79 behavioral, environmental and
occupational, and metabolic risks or clusters of risks, 1990-2015: a
systematic analysis for the Global Burden of Disease Study 2015. Lancet.
2016;388(10053):1659-724.
10. Murray CJ, Ezzati M, Flaxman AD, et al. GBD 2010: design, deinitions,
and metrics. Lancet. 2012;380(9859):2063-6.
11. GBD 2015 Mortality and Causes of Death Collaborators. Global,
regional, and national life expectancy, all-cause mortality, and
cause-speciic mortality for 249 causes of death, 1980-2015: a systematic
analysis for the Global Burden of Disease Study 2015. Lancet.
2016;388(10053):1459-544.
12. Schmidt MI, Duncan BB, Azevedo e Silva G, et al. Chronic
non-communicable diseases in Brazil: burden and current challenges.
Lancet. 2011;377(9781):1949-61.
13. Bonita R, Magnusson R, Bovet P, et al. Country actions to meet UN
commitments on non-communicable diseases: a stepwise approach.
Lancet. 2013;381(9866):575-84.
14. Reichenheim ME, de Souza ER, Moraes CL, et al. Violence and injuries
in Brazil: the efect, progress made, and challenges ahead. Lancet.
2011;377(9781):1962-75.
15. Brasil. Ministério da Saúde. Secretaria de Vigilância em Saúde.
Departamento de Vigilância de Doenças e Agravos não Transmissíveis
e Promoção da Saúde. Saúde Brasil 2014: uma análise da situação
de saúde e das causas externas. Brasília: Ministério da Saúde; 2015.
Available from: http://bvsms.saude.gov.br/bvs/publicacoes/saude_
brasil_2014_analise_situacao.pdf. Accessed in 2017 (Feb 6).
16. Malta DC, Santos MAS, Andrade SSCA, et al. Tendência temporal dos
indicadores de excesso de peso em adultos nas capitais brasileiras,
2006-2013 [Time trend in adult obesity indicators in Brazilian state
capitals, 2006-2013]. Ciênc Saúde Coletiva. 2016;21(4):1061-9.
17. Malta DC, Oliveira TP, Andrade SSCA, Silva MMA, Santos MAS. Avanços do
Plano de Ações Estratégicas para o Enfrentamento das Doenças Crônicas
não Transmissíveis no Brasil, 2011-2015 [Progress with the Strategic
Action Plan for Tackling Chronic Non-Communicable Diseases in Brazil,
2011-2015]. Epidemiol Serv Saúde. 2016;25(2):373-90.
18. Alwan A, Maclean DR, Riley LM, et al. Monitoring and surveillance of
chronic non-communicable diseases: progress and capacity in
high-burden countries. Lancet. 2010;376(9755):1861-8.
19. Malta DC, Silva Junior JB, Morais Neto OL. Apresentação do plano de
ações estratégicas para o enfrentamento das doenças crônicas não
transmissíveis no Brasil, 2011 a 2022 [Presentation of the strategic
action plan for coping with chronic diseases in Brazil from 2011 to
2022]. Epidemiol Serv Saúde. 2011;20(4):425-38.
20. Ribeiro AL, Duncan BB, Brant LC, et al. Cardiovascular Health in Brazil:
Trends and Perspectives. Circulation. 2016;133(4):422-33.
21. Lotufo PA, Fernandes TG, Bando DH, Alencar AP, Benseñor IM. Income
and heart disease mortality trends in Sao Paulo, Brazil, 1996 to 2010.
Int J Cardiol. 2013;167(6):2820-3.
22. Lotufo PA, Goulart AC, Fernandes TG, Benseñor IM. A reappraisal of stroke
mortality trends in Brazil (1979-2009). Int J Stroke. 2013;8(3):155-63.
23. Fernandes TG, Bando DH, Alencar AP, Benseñor IM, Lotufo PA. Income
inequalities and stroke mortality trends in Sao Paulo, Brazil, 1996-2011.
Int J Stroke. 2015;10 Suppl A 100:34-7.
24. Vale DB, Sauvaget C, Muwonge R, et al. Disparities in time trends
of cervical cancer mortality rates in Brazil. Cancer Causes Control.
2016;27(7):889-96.
25. Gonzaga CM, Freitas-Junior R, Curado MP, et al. Temporal trends in
female breast cancer mortality in Brazil and correlations with social
inequalities: ecological time-series study. BMC Public Health. 2015;15:96.
26. Silva JFS, Mattos IE, Aydos RD. Tendência de mortalidade por câncer
de próstata nos Estados da Região Centro-Oeste do Brasil, 1980 –
2011 [Tendencies of mortality by prostate cancer in the states of
the Central-West Region of Brazil, 1980-2011]. Rev Bras Epidemiol.
2014;17(2):395-406.
27. Guimarães RM, Santos TSC. Distribuicao da mortalidade por cancer
de traqueia, pulmao e bronquios no Brasil segundo sexo, 1980-2010
[Mortality distribution due to tracheal, lung, and bronchial cancer by
gender, Brazil, 1980-2010]. J Bras Pneumol. 2013;39(5):633-5.
28. Barreto SM, Assis TD, Almeida SKF, Passos VMA. The increase of diabetes
mortality burden among Brazilian adults. Rev Panam Salud Pública.
29. Malta DC, Oliveira TP, Moura L, et al. Tendência da prevalência
do diabetes melito autorreferido em adultos nas capitais brasileiras,
2006 a 2012 [ Trends in self-reported diabetes among adults
in Brazilian state capitals, 2006-2012]. Epidemiol Serv Saúde.
2014;23(4):753-60.
30. Benseñor IM, Fernandes TG, Lotufo PA. Chronic obstructive pulmonary
disease in Brazil: mortality and hospitalization trends and rates,
1996-2008. Int J Tuberc Lung Dis. 2011;15(3):399-404.
31. Brasil. Ministério da Saúde. Secretaria de Vigilância em Saúde.
Departamento de Análise de Situação de Saúde. Plano de ações
estratégicas para o enfrentamento das doenças crônicas não
transmissíveis (DCNT ) no Brasil 2011-2022/Ministério da Saúde.
Secretaria de Vigilância em Saúde. Departamento de Análise de Situação
de Saúde. Brasília: Ministério da Saúde; 2011. Available from: http://
bvsms.saude.gov.br/bvs/publicacoes/plano_acoes_enfrent_dcnt_2011.
pdf. Accessed in 2017 (Feb 6).
32. Lima EEC, Queiroz BL. A evolução do sistema de registro de mortalidade
no Brasil: mudanças no peril de mortalidade, cobertura do registro
de óbitos e as causas mal deinidas de morte [Evolution of the deaths
registry system in Brazil: associations with changes in the mortality
proile, under-registration of death counts, and ill-deined causes of
death]. Cad Saúde Pública. 2014;30(8):1721-30.
33. Queiroz BL. Estimativas do Grau de Cobertura e da Esperança de Vida
para as Unidades da Federação no Brasil entre 2000 e 2010. In: Anais do
XVIII Encontro de Estudos de População da ABEP; 2012 nov 19-23; São
Paulo: ABEP. Available from: http://www.abep.nepo.unicamp.br/xviii/
anais/iles/POSTER%5B261%5D.pdf. Accessed in 2017 (Feb 6).
34. Malta DC, Merhy EE. O percurso da linha do cuidado sob a perspectiva
das doenças crônicas não transmissíveis [The path of the line of care
from the perspective of non-transmissible chronic diseases]. Interface
Comum Saúde Educ. 2010;14(34):593-606.
Sources of funding: Ministério da Saúde. Fundo Nacional de Saúde. Grant no. 25000192049/2014-14
Conlict of interest: None
Date of irst submisison: December 8, 2016
Last received: December 31, 2016
Accepted: January 5, 2017
Address for correspondence:
Deborah Carvalho Malta
Departamento de Enfermagem Materno-Infantil e Saúde Pública,
Universidade Federal de Minas Gerais (UFMG)
Av. Alfredo Balena 190 — Santa Eigênia
Belo Horizonte (MG) — Brasil
CEP 30130-100
Tel. (+55 31) 3409-9862