ISSN 0104-6632 Printed in Brazil
www.abeq.org.br/bjche
Vol. 32, No. 02, pp. 433 - 443, April - June, 2015 dx.doi.org/10.1590/0104-6632.20150322s00002876
Brazilian Journal
of Chemical
Engineering
MODELING AND SIMULATION OF THE EFFECT
OF THE FIRING CURVE ON THE LINEAR
SHRINKAGE OF CERAMIC MATERIALS:
LABORATORY SCALE AND INDUSTRIAL SCALE
M. Cargnin
1,2*, S. M. A. G. Ulson de Souza
1, A. A. Ulson de Souza
1and A. De Noni Jr.
2,31
Graduate Program in Chemical Engineering, Universidade Federal de Santa Catarina, 88040-900, Florianópolis - SC, Brazil.
E-mail: [email protected]
2
Instituto Maximiliano Gaidzinski, Rua Edson Gaidzinski 352, Cocal do Sul - SC, Brazil. Phone: + (55) (48) 3447-7734, Fax: (+55) (48) 3447-7736, 88845-000
*E-mail: [email protected] 3
Universidade do Extremo Sul Catarinense, Av. Universitária 1105, Bairro Universitário, 88806-000 Criciúma - SC, Brazil.
(Submitted: July 25, 2013 ; Revised: June 4, 2014 ; Accepted: June 4, 2014)
Abstract - Single-cycle firing is currently the most widespread method used for the production of ceramic tile. The productivity is directly related to the performance of the constituent materials of the ceramic piece during thermal cycling. Numerical tools which allow the prediction of the material behavior may be of great help in the optimization of this stage. This study addressed the mathematical modeling of the temperature profile within a ceramic tile, together with the sintering kinetics, to simulate the effect of the thermal cycle on the final size. On the laboratory scale, 80 mm x 20 mm specimens with thicknesses of 2.3 mm and 7.8 mm were prepared in order to determine the kinetic constants and validate the model. The application was carried out on an industrial scale, with 450 mm x 450 mm pieces that were 8.0 mm thick. These results show that the model was capable of predicting the experimental results satisfactorily.
Keywords: Roller kiln; Firing operation; Kinetic model.
INTRODUCTION
Tile manufacturers are constantly concerned with guaranteeing that products have consistent dimen-sions and aesthetic characteristics. In this regard, although the vast majority of quality related issues do not originate from the firing process, it is on this process that the product problem solving is focused. The stability of the above mentioned features is di-rectly related to the firing temperature and timing, as well as the type of product to be produced. Linear shrinkage is widely used as a parameter to control the size of the final product, since the quality requirements for ceramic tiles are dictated by international
stan-dards (ISO 13006), and one of these requirements relates to the dimensional variation that may occur during the production process.
order to achieve this, companies try to develop greater mass fluxes which, for the same temperature and firing time, lead to the same technical properties, especially those related to the piece size and degree of water absorption. In this regard, traditionally, the technical tool adopted in most studies is the vitrifica-tion diagram, which generates useful informavitrifica-tion for process optimization. On the other hand, vitrification in the liquid phase is the main cause of porosity re-duction, firing retraction, and the development of the ceramic property of the material (Matteucci et al., 2002). This phenomenon can be described through kinetic models, which contribute relevant informa-tion from a thermodynamic point of view. Kinetic models can also be used along with modeling and process simulations to achieve faster, more robust optimization, minimizing the laboratory and indus-trial efforts. Such models have been used in labora-tory studies to evaluate the sintering mechanisms for different types of ceramic material. Orts et al. (1993a and 1993b), for example, analyzed the effects of temperature and firing time on the densification of low porosity ceramic pieces (pavement for single-cycle firing) through a kinetic model related to the reduction in the porosity of the material. Salem et al.
(2010) also analyzed this property for a porcelain mass containing nepheline syenite and Salem et al.
(2009) studied the effect of the addition of nepheline syenite using a model based on the linear shrinkage during firing. Similar studies were carried out by Zeng et al. (1999) and Benavidez and Oliver (2001) in order to determine the advanced ceramic sintering mechanisms. In the same context, Yürüyen and Toplan (2009) studied the sintering kinetics of porcelain masses produced from glass and fly ash residue.
The aim of this study was to combine a phenome-nological model of heat transfer with a sintering kinetics model (Cargnin et al., 2011) to simulate the effects of different thermal cycle conditions (time and temperature) applied to a mass used for the pro-duction of single-cycle firing BIIa ceramic tiles on a laboratory and industrial scale. In order to do so, we adopted the phenomenological modeling of heat transport by diffusion and its boundary conditions for a ceramic plate. The influence of the thickness of the ceramic tile was also investigated experimentally and through numerical simulation.
MATHEMATICAL MODELING
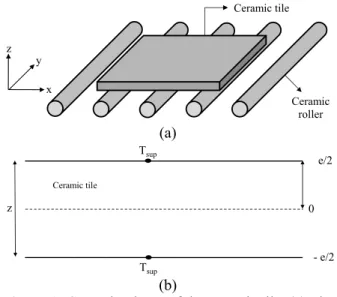
Figure 1 represents the object of study and estab-lishes the coordinates of the problem, where the ce-ramic tile is square. Dimensions “x” and “y” are the same, and much larger than the depth “z” (x, y >> z).
Therefore, we can consider the object as an infinite slab with symmetry conditions in the direction “z” for the evaluation of the temperature profile from the ceramic tile surface to the center.
z y
x
Ceramic roller Ceramic tile
(a)
z 0
e/2
- e/2 Tsup
Tsup
Ceramic tile
(b)
Figure 1: Control volume of the ceramic tile. (a) The
object under study (ceramic tile). (b) Representation of the researched control volume (infinite plane tile and symmetry condition).
According to Bird et al. (2004), the heat diffusion phenomenon in the transient state can be defined by the energy saving equation in terms of the heat flux in Cartesian coordinates, with the terms for energy generation or consumption, as shown in Eq. (1):
,
, " ,
"cd x cd y "cd z p
q
q q
T
ρc q
t x y z
∂
∂ ∂
⎛ ⎞
∂ = − + + +
⎜ ⎟
∂ ⎝ ∂ ∂ ∂ ⎠ (1)
It can be assumed that the material of the ceramic tile is isotropic, its physical properties (ρ, k, cp) are constant throughout the firing operation and the gen-eration or consumption of energy does not occur inside the ceramic tile (q = 0), that is, endothermic reactions associated with clay mineral decomposition and exothermic reactions involved in the nucleation of mullite were neglected for simplification. By ap-plying the hypothesis presented in Eq. (1), it is possi-ble to obtain a simpler equation for the phenomenon of heat diffusion in ceramic tiles for coating, as shown in Eq. (2):
2 2 p
T T
ρc k
t z
∂ = ∂
∂ ∂ (2)
tiles are at room temperature, as shown in Eq. (3). As a spatial boundary at t > 0, at the center of the tile z = 0, the condition of symmetry was established, as shown in Eq. (4). As a surface spatial condition, it was established that the heat flux received by con-vection and radiation is equal to the diffusion heat flux absorbed by the ceramic tile, as demonstrated by Eq. (5)
0;
2 2 environment
e e
t= − ≤ ≤z T =T (3)
0; 0 T 0
t z z
∂
> = =
∂ (4)
(
) (
)
0; 2
solid c g sup r g sup
e
t z
T
k h T T h T T
z
> = ∂
− = − + −
∂
(5)
where:
ksolid is the thermal conductivity of the ceramic material;
hc is the coefficient of heat transfer by convection;
hr is the coefficient of heat transfer by radiation;
Tg is the gas temperature inside the kiln;
Tsup is the temperature on the surface of the ceramic tile.
All of the differential equations which deal with the problem of heat transfer in a ceramic plate during the firing operation were numerically solved, in time and space, by the finite volume method (Maliska, 2004). In this method an interpolation function needs to be selected which can reproduce all of the effects of this physical phenomenon in the evaluation of the variables and their derivatives at the faces of the control volume. In order to obtain precise results for the numerical method, the appropriate selection of the interpolation function is essential. There are several types of interpolation functions for one-dimensional problems, the main ones being the central difference scheme (CDS), which uses a linear interpolation and is applied to strongly diffusion-dominated problems, the upwind difference scheme (UDS), used for strongly advection-dominated problems, and the WUDS scheme for combined diffusion and advection problems (Maliska, 2004). Since the transport phenomenon considered in this study for the ceramic tile is heat transfer by conduction, that is, a strongly diffusion-dominated transport, the interpolation function used was the CDS.
In order to evaluate the effect of the firing tem-perature and time on the sintering kinetics of a ce-ramic tile, the phenomenological model of heat transfer
described above was associated with a sintering ki-netics model based on studies by Orts et al. (1993a),
Salem et al. (2009) and Benavidez and Oliver
(2001), where the variation in the linear retraction during the firing process can be described by Eq. (6):
0
= = ⋅ n l
dL
R k' t
L (6)
where Rl is the retraction of the ceramic piece, dL is the difference between the initial (L0) and final (Lf)
size, t is the sintering time, k’ is a rate constant (time-n) and n is an exponent of time which is dependent on the dominant sintering mechanism. The constant k’
can be correlated with the temperature using Eq. (7) of the Arrhenius type:
0 A E R T
k' k e
−
⎛ ⎞
⎜ ⋅ ⎟
⎝ ⎠
= ⋅ (7)
where k0 is a frequency factor, EA is the activation energy, R is the ideal gas constant and T is the tem-perature of the ceramic tile.
In order to obtain the equation which describes the sintering kinetics for the ceramic tile as a func-tion of the temperature (T) and time (t), Eq. (7) needs to be substituted into Eq. (6), using the values for the linear retraction as a characteristic of the firing proc-ess, to give Eq. (8):
0 A E
n R T l
R k e t
−
⎛ ⎞
⎜ ⋅ ⎟
⎝ ⎠
= ⋅ ⋅ (8)
EXPERIMENTAL PROCEDURE
Validation of the Phenomenological Model
With the phenomenological model for heat trans-fer (Eq. (2)), and the definition of the initial condi-tions (Eq. (3)) and the shaping condicondi-tions (Eq. (4) and (5)) numerically solved, we developed a compu-tational program in FORTRAN 90 language to ob-tain the temperature of the gas and surface, as well as the temperature profile for the ceramic tile inside the laboratory roller kiln.
This procedure was validated through the use of data obtained in a study by Cantavella (1998) carried out in an industrial kiln. The physical data for the ceramic material, such as density (ρ = 1850 kg.m-3
The number of control volumes used for the numeri-cal simulation was 20 along the ceramic tile thick-ness, since the tile length was not considered in the model proposed in this article. The firing curve was represented as a set of inequalities, where the limit of use of each linear equation of this set was also de-fined. We obtained the results of the simulation and compared them to those obtained by Cantavella (1998).
Laboratory Scale
The numerical simulation analysis of the firing operation in the laboratory roller kilns was per-formed with the conformation of the bodies of the test piece by the uniaxial drying process, using a laboratory hydraulic press. The specific pressure applied was 25 MPa. The specimen dimensions were 80 mm x 20 mm and the thicknesses were 2.3 mm and 7.8 mm. The powder mass (7 g and 25 g) was determined on a Micronal digital scale, with a reso-lution of 0.01 g.
The simulation was carried out after obtaining the ceramic firing curves. The laboratory roller kiln tem-peratures were determined through the use of a 1000 mm length type-K temperature sensor and a Gulton 1200 (-70.0 to +1200 ºC) temperature recorder. Tag-ging was carried out every 50 mm along the entire sensor length, in order to obtain the temperature curve for different positions in the oven. Data was recorded for maximum temperatures between 1273 K and 1423 K, with 30 K intervals and with firing cycles of 30, 40 and 50 min (cold-to-cold). These firing curves were used to determine the sintering kinetics parameters of the ceramic tile, under differ-ent firing conditions, such as the activation energy EA (178041 J.mol-1), the time exponent n, which deter-mines the sintering mechanism, (0.26285), and the frequency factor k0 (44768 s-1) (Cargnin et al., 2011).
We also obtained the vitrification curves (linear shrinkage x water absorption) for specimens with thicknesses of 2.3 mm and 7.8 mm.
From the firing curves, several sets of inequalities were obtained for every maximum temperature and firing cycle. As in the validation process, these ine-qualities were inserted in a computational program in order to obtain the gas temperature inside the kiln (Tg(t)), the temperature of the ceramic tile surface, the temperature profile inside the tile, and the linear shrinkage, using the equation defined by Salem et al. (2009).
For the kiln analyzed, the heat transfer by convec-tion is low, since the gas flux in its interior is due to the movement of the ceramic plates. Therefore, in order
to consider the convective parcel in the model, the advance speeds of the ceramic tile were determined and found to be 6.8611x10⁻⁴ m.s-1, 5.1458x10⁻⁴ m.s-1, and 4.1167x10⁻⁴ m.s-1.
Through numerical simulation, the linear shrink-age temperature and hypothetical profiles were deter-mined according to the firing time for the 2.3 mm and 7.8 mm ceramic plates. In order to determine the standard shrinkage, the following algebraic proce-dure was adopted: from the temperature profile (T(z)), Eq. (9) was used to obtain the average tem-perature of the ceramic (Taverage). It was then possible
to determine the value of the position corresponding to the average temperature and, thus, the value for the hypothetical shrinkage at the same position.
( )
2
0 1
e
average
T T z dz
z
=
∫
(9)The values obtained numerically for the linear shrinkage were compared with experimental data for the model validation.
Industrial Scale
The industrial phase of this study was carried out in an Enaplic continuous roller kiln 92.50 m in length and 2.68 m in width in the modules of the heating zone and 3.08 m in width in the modules of the firing zone. The kiln has 26 heating modules up to the end of the firing zone. Thermocouples were placed above and below the roller planes, in order to monitor and maintain the firing curve established for this operation. The firing process operated with a total firing time of 33 min and maximum tempera-ture of 1162 ºC (1435 K). The dimensions of the ceramic tiles at the entrance of the kiln were 481.38 mm in length, with a square geometry and thickness of 8 mm. 15 ceramic tiles were selected, with the dimensions previously cited and without decoration, to obtain the value for the linear shrinkage during firing. Before the firing, the sides of each ceramic tile were identified and then immediately measured with an analog Mitutoyo caliper (0.02 mm resolu-tion). The ceramic tiles were placed in a same posi-tion of the kiln to minimize the linear shrinkage ef-fect. After the firing, the tiles were measured, and the values for the linear shrinkage were obtained. These values were compared to simulation results.
considered for the solution over time (Δt) (Maliska, 2004). The tests adopted to verify the influence of the computational network and of the time interval used in the numerical solution were carried out on the ceramic tile with a thickness of 8 mm (0.008 m). For the symmetry condition, the thickness of the domain inserted in the numerical algorithm was 4 mm (0.004 m).
Test were performed for the networks with 10 vol-umes ((Δz = 0.0004 m), 20 volumes ((Δz = 0.0002 m), 30 volumes (Δz = 0.00013 m), 40 volumes (Δz = 0.0001 m) and 50 volumes (Δz = 0.00008 m) along the thickness. The network with 20 volumes was adopted for this task for the thickness of the com-putational domain, and gave the same result as that for the most refined network, requiring a lower com-putational effort and, consequently, less time to ob-tain the results.
As to the influence of time on the temperature profile for the ceramic tile, it was verified that the Δt
value does not alter the behavior of the temperature profile for the ceramic tile as the convergence of the numerical solution limits its value. In the finite vol-umes method, when an explicit formulation is used, the value of Δt is limited when the coefficients of the equations start to result in negative values (Maliska, 2004). In order to avoid the problem of the conver-gence of the computational code developed in this study, the value used for the time interval was 0.04 s.
RESULTS AND DISCUSSION
Validation of the Phenomenological Model
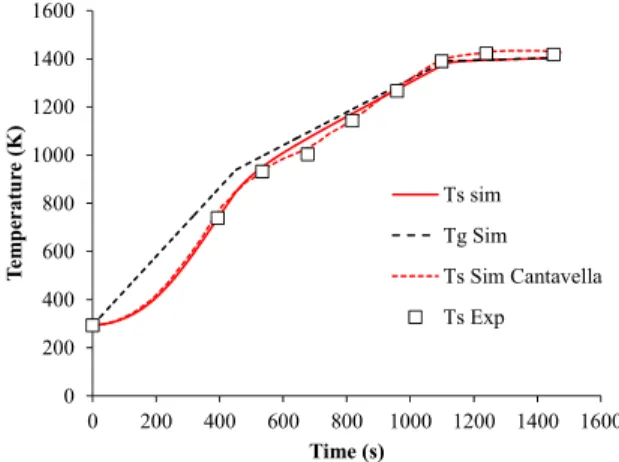
Figure 2 presents the numerical results for the temperatures of the gas (Tg Sim) and the ceramic tile
surface (Ts Sim) obtained by this model, the surface
temperature obtained by the model developed by Cantavella (1998), and the surface temperature (Ts
Exp) measured experimentally. The numerical data obtained with the proposed model present the same behavior for the ceramic tile surface temperature as that reported by Cantavella (1998). This trend can also be observed when the results are compared with the experimental data. It should be noted that in the proposed model, the finite volume method (Maliska, 2004) is used to obtain the equations, since it is a numerical method which takes into consideration the physical part of the problem, while Cantavella (1998) used the finite difference method, which has a stronger mathematical basis. This demonstrates that the model proposed herein satisfactorily achieves the
objective of this study, even disregarding the effect of the chemical reactions associated with the con-sumption or generation of energy within the ceramic tile. However, in the work carried out by Cantavella (1998), the consumption of energy in the chemical reactions during the firing of the ceramic tiles was taken into consideration. Bearing in mind the aims of the study reported herein, this simplification does not compromise the results obtained regarding the linear retraction during firing, as discussed below.
0 200 400 600 800 1000 1200 1400 1600
0 200 400 600 800 1000 1200 1400 1600
Te
m
p
er
a
tu
re
(
K
)
Time (s)
Ts sim
Tg Sim
Ts Sim Cantavella
Ts Exp
Figure 2: Comparison of the results obtained with
the proposed model to those reported by Cantavella (1998) for the ceramic tile surface temperature.
It can be observed that there is a notable differ-ence between the atmospheric temperature inside the kiln (Tg Sim) and the ceramic tile surface
tempera-ture (Ts Sim and Ts Exp), especially at lower
tem-peratures, at the start of the heating. According to Cantavella (1998), in the lower temperature zone the heating rate is higher and the coefficient for the heat transfer by radiation is lower. Therefore, the heating of the ceramic tile occurs more slowly, resulting in the temperature difference. In the roller kiln, accord-ing to Jarque et al. (1996), the predominant mecha-nism of heat transfer is radiation.
The validation of the proposed model can be car-ried out considering the linear correlations between the temperature of the experimental surface (Ts Exp)
and the temperatures numerically determined by the proposed model (Ts Sim) and by Cantavella (1998)
(Ts Sim Cantavella). The values obtained for the
correlation coefficients are presented in Table 1.
Table 1: Correlation between the models analyzed.
Comparison between models R2
Laboratory Scale
Figure 3 represents the firing curves for the 30 min period at the different temperatures. We can see that, for all curves, there is an area of constant tempera-ture (plateau) in which the properties of the ceramic tile are consolidated. Figure 4 shows the variation in the heating rates for the three time intervals (30, 40 and 50 min), at 1393 K.
0 250 500 750 1000 1250 1500
0 250 500 750 1000 1250
Te
m
p
er
a
tu
re
(
K
)
Time (s)
1423 K 1393 K 1363 K 1333 K 1303 K 1273 K
Figure 3: Firing curves for a 30 min firing period
(cold-to-cold).
0 250 500 750 1000 1250 1500
0 500 1000 1500 2000
Te
m
p
er
a
tu
re
(
K
)
Time (s)
30 min 40 min 50 min
Figure 4: Firing curves for the laboratory roller kiln
applying different firing times at 1393 K.
The linear equations required for the mathemati-cal model in this study were determined based on the firing curves obtained under different conditions (maximum temperature and time). Table 2 shows the linear equations, the time intervals, and the linear regression coefficients for the fitting of the experi-mental data points. The fit for each firing curve inter-val has a high degree of accuracy, with correlation values between 0.9947 and 1.0000, although in the area of the firing plateau the correlation is lower, with a coefficient of 0.7500. In this case, a distortion
of the temperature results may have occurred and, consequently, of the results for the linear shrinkage of the ceramic tile.
Table 2: Equations of the firing curves for the laboratory roller kiln according to the firing time (min).
Maximum Temperature
(o
C)
Time Interval (s)
Firing Curve R2
0 ≤ t ≤ 150 T (o
C) = 1.1280t + 45.70 0.9997 150 < t ≤ 292 T (o
C) = 0.7479t + 102.83 0.9993 292 < t ≤ 370 T (o
C) = 2.1956t – 320.00 1.0000 370 < t ≤ 581 T (o
C) = 1.2474t + 30.90 0.9947 581 < t ≤ 731 T (o
C) = 2.2230t – 536.00 0.9999 1120
731 < t ≤ 875 T (o
C) = 0.2539t + 904.17 0.7500
Figure 5 presents the results obtained for the nu-merical simulation of the firing process in the labora-tory roller kilns. The conditions adopted for the simulation were 1393 K and the time interval corre-sponding to the firing plateau. This was extracted from the 30 min cold-to-cold time internal. In the roller kilns analyzed the predominant heat transfer phenomenon is radiation, since the flow of the gas stream in the kiln is slow.
0 200 400 600 800 1000
0.00 0.02 0.04 0.06 0.08 0.10
0 200 400 600 800 1000 1200 1400 1600
0 200 400 600 800 1000
Time (s)
L
inear s
h
ri
n
k
age
(
Rl
)
T
em
p
erat
u
re (
K
)
Time (s)
Ts Sim Tg Sim Tg Exp Ls C Sim Ls S Sim
Figure 5: Numerical simulation of the firing curve
for a laboratory roller kiln and the linear shrinkage behavior of the ceramic tile according to the kinetic model. Total firing time of 30 min, with a maximum temperature of 1393 K and ceramic tile thickness of 2.3 mm.
The behavior of the linear shrinkage (Rl S Sim
and RlC Sim) is compatible with the variation in the
to the intense formation and viscosity reduction of the liquid phase. During the period corresponding to the firing plateau, the linear shrinkage rate is lower. From this stage onward, time is a determinant pa-rameter in relation to the final shrinkage of the ce-ramic tile. It can be noted that the behavior of the linear shrinkage of the tile surface (RlS Sim) is
simi-lar to that of its center (RlC Sim), with small
varia-tions (ΔRlS-C = 0.0003665), which can be considered
negligible.
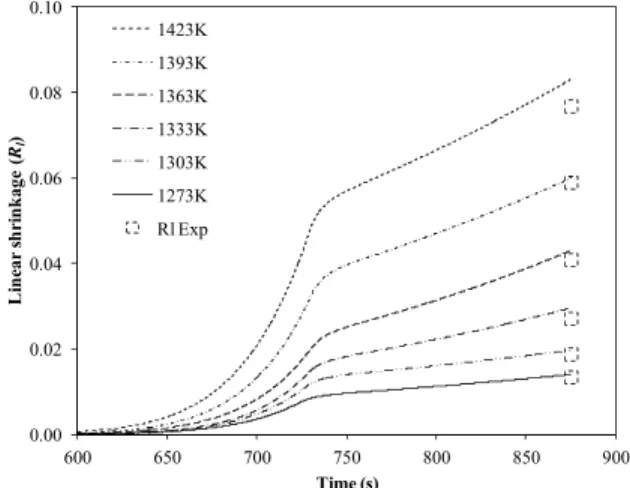
The numerical simulations were also carried out for other firing conditions (time and temperature). It was possible to verify the reproduction of the value for the linear shrinkage by the kinetic model (Cargnin et al., 2011). Figure 6 shows the numerical results for the linear shrinkage at distinct firing tem-peratures, for a total time of 30 min and a ceramic tile thickness of 2.3 mm. The numerical results ob-tained demonstrate that the kinetic model (Cargnin et al., 2011) provides a satisfactory fit with the experi-mental data points between the temperatures of 1273 K to 1393 K. On reaching 1423 K, there is a significant deviation between the experimental (Rl Exp = 0.07681)
and the simulated (Rl Sim = 0.08301) values. A
re-duction in the linear shrinkage rate can be observed, due to the significant increase in the quantity of liquid phase formed. These results may also be influ-enced by the value of the time exponent (n) in the model, since for a temperature of 1150 °C its value
1150 C
(n ° = 0.1529) differs significantly from those
observed at lower temperatures (Cargnin et al., 2011).
0.00 0.02 0.04 0.06 0.08 0.10
600 650 700 750 800 850 900
L
ine
a
r s
h
ri
nka
ge
(
Rl
)
Time (s)
1423K 1393K 1363K 1333K 1303K 1273K Rl Exp
Figure 6: Numerical simulation of the linear shrinkage
of the ceramic tile during the firing operation for a 30 min period and thickness of 2.3 mm.
Figure 7 shows the simulated results obtained for the linear shrinkage, with a maximum temperature of
1393 K applying different firing time intervals (30, 40 and 50 min) and tile thicknesses (2.3 mm and 7.8 mm). The behaviors of the linear shrinkage curves are similar, demonstrating that the shorter the firing time the less the shrinkage of the ceramic tile will be. The ceramic tile thickness also influences the linear shrinkage, which decreases with increasing thick-ness. The temperature variation inside the 7.8 mm-thick tile is much higher than that observed for the thinner ceramic piece. Thus, the temperature in the center is lower than at the surface, providing less linear shrinkage in the ceramic tile, as demonstrated in Figure 8.
0 0.01 0.02 0.03 0.04 0.05 0.06 0.07 0.08
600 750 900 1050 1200 1350 1500
L
in
ear
s
h
ri
n
k
age
(
Rl
)
Time (s)
2.3 mm 7.8 mm Rl Exp
Figure 7: Simulation of the linear shrinkage of the
ceramic tile after different firing times (maximum temperature = 1393 K).
1384 1386 1388 1390 1392 1394 1396 1398 1400
0,050 0,051 0,052 0,053 0,054 0,055 0,056 0,057 0,058 0,059 0,060 0,061
-1,00 -0,75 -0,50 -0,25 0,00 0,25 0,50 0,75 1,00
T
em
p
era
tu
re
(
K
)
Line
a
r shr
inkage
(
Rl
)
Dimensionless thickness
7,8 mm 2,3 mm
Figure 8: Comparison between the temperature
pro-file and the hypothetical propro-file for the retraction of ceramic tiles with different thicknesses.
The numerical results for the linear shrinkage (Rl
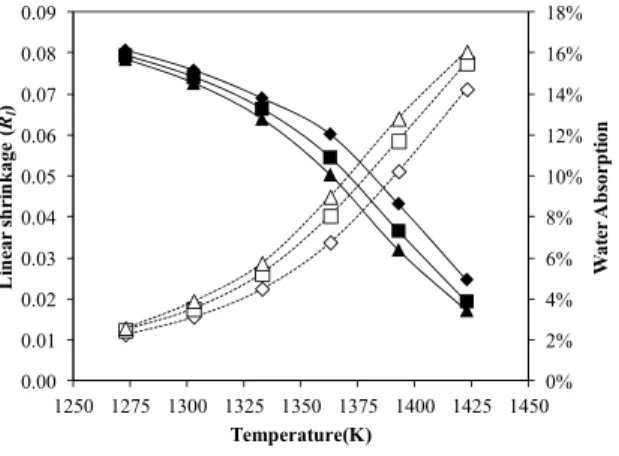
high correlation coefficients were obtained for the 2.3 mm (R2 = 0.9913) and 7.8 mm (R2 = 0.9912) thick-nesses, as seen in Figure 9. This behavior has also been verified by Salem et al. (2009). The highest values calculated for the shrinkage differ from those of the experimental data. The dotted line in Figure 9 repre-sents the maximum limit of linear shrinkage adopted industrially, demonstrating that the model tends to reproduce industrial conditions. The vitrification curves presented in Figures 10 and 11 show that, in order to reach the technical characteristics of a BIIa product maintaining the maximum linearity (Rl =
0.072), it is necessary to operate the kiln with a tem-perature of 1393 K and a firing cycle of 50 min (cold-to-cold) for both tile thicknesses (2.3 mm and 7.8 mm).
0.00 0.02 0.04 0.06 0.08 0.10
0.00 0.02 0.04 0.06 0.08 0.10
Rl
Si
m
RlExp
2.3 mm 7.8 mm Limite Industrial
Industrial Limit
Figure 9: Comparison of the experimental and
simu-lated values for the retraction of the ceramic tiles with different thicknesses (2.3 mm: R2 = 0.9913; 7.8 mm: R2 = 0.9912).
0% 2% 4% 6% 8% 10% 12% 14% 16% 18%
0.00 0.01 0.02 0.03 0.04 0.05 0.06 0.07 0.08 0.09
1250 1275 1300 1325 1350 1375 1400 1425 1450
W
a
te
r A
b
so
rp
ti
o
n
L
inear
s
h
ri
nk
age
(
Rl
)
Temperature (K)
Rl 30 Rl 40 Rl 50 AA30 AA40 AA50
Figure 10: Vitrification curve for the 2.3 mm-thick
specimen.
0% 2% 4% 6% 8% 10% 12% 14% 16% 18%
0.00 0.01 0.02 0.03 0.04 0.05 0.06 0.07 0.08 0.09
1250 1275 1300 1325 1350 1375 1400 1425 1450
Wa
te
r A
b
so
rp
ti
o
n
Li
n
ea
r s
h
ri
n
k
a
g
e
(
Rl
)
Temperature(K)
Rl 30 Rl 40 Rl 50 AA30 AA40 AA50
Figure 11: Vitrification curve for the 7.8 mm-thick
specimen.
Industrial Scale
The linear equations, obtained following the ex-perimental procedure adopted on the laboratory scale, are shown in Table 3, along with each time interval and the linear regression coefficients. The values for the correlation coefficients were very high, showing that the temperatures calculated for any time interval, as well as for any position along the thickness of the ceramic tile, were in good agreement with the ex-perimental data.
Table 3: Equations of the firing curves for the industrial roller kiln according to the firing time (min).
The temperatures of the gas (TgSim), the tile
sur-face (Ts Sim) and the center of the tile (Tc Sim) were
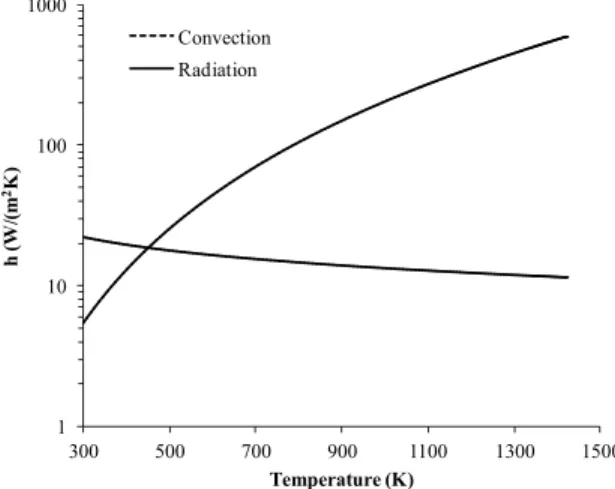
obtained, as shown in Figure 12. The numerical solu-tion obtained has the same behavior as that observed in the results reported by Cantavella (1998), and thus other situations can be simulated, such as different firing conditions. The difference between the tem-perature of the gas inside the kiln and the ceramic tile surface at the lowest temperatures, that is, at the beginning of the heating, is due to the higher heating rate for convection compared with radiation, as shown in Figure 13. The gas flow inside the kiln was 3.14 m.s-1. According to Jarque et al. (1996), the
Maximum Temperature
(o
C)
Time Interval (s)
Firing Curve R2
0 ≤ t < 367 T(o
C) = 1.5242t + 25.00 0.9956 367 ≤ t < 684 T(o
C) = 1.0554t + 196.93 0.9992 684 ≤ t < 740 T(o
C) = 0.3688t + 666.79 1.0000 1162
740 ≤ t ≤ 1062 T(o
predominant mechanism of heat transfer in industrial roller kilns is radiation.
0 200 400 600 800 1000 1200 1400 1600
0 200 400 600 800 1000 1200
T
em
p
erat
u
re
(
K
)
Time (s)
Tc Sim
Ts Sim
Tg Sim
Tg Exp
Figure 12: Numerical simulation of the firing curve
for an industrial roller kiln with a maximum tem-perature of 1162 ºC (1435 K).
1 10 100 1000
300 500 700 900 1100 1300 1500
h (
W
/(
m
2K)
Temperature (K)
Convection Radiation
Figure 13: Heat transfer coefficients (convection and
radiation) as a function of temperature.
Besides obtaining the numerical results for the behavior of the temperature of the ceramic tile dur-ing the firdur-ing operation in an industrial roller kiln, the proposed model is also capable of estimating the dimensional behavior of the ceramic tiles, that is, to predict the linear shrinkage. According to the labora-tory results obtained with the sintering kinetics model used by Salem et al. (2009, 2010) and evalu-ated in the first part of this study, it is possible to predict, numerically, the final dimensions of the ce-ramic tile after the firing process.
New firing conditions were simulated in order to verify the capacity of the model to approximate the results obtained at the industrial plant. Figure 14 shows the firing curve (TgSim) simulated considering
the experimental data and the behavior of the linear
shrinkage of the surface (RlS Sim) and of the center
(RlC Sim) of the ceramic tiles. The numerical results
obtained for these variables, at a maximum tempera-ture of 1152 ºC (1425 K), were, respectively, linear shrinkages of 0.0742 for the surface and 0.0628 for the center of the ceramic tile. In order to determine the linear shrinkage of the ceramic tile, firstly, the av-erage temperature (Taverage) was determined through
the integration of the variation of the temperature as a function of the thickness (T(z)), as shown in Eq. (9).
0.00 0.02 0.04 0.06 0.08 0.10
1250 1300 1350 1400 1450
700 750 800 850 900 950 1000
L
ine
a
r s
h
ri
nk
ag
e
(
Rl
)
Te
m
p
er
a
tu
re
(
K
)
Time (s)
Tg Sim Rl S Sim Rl C Sim Rl Exp Rl Sim
Figure 14: Comparison between the simulated linear
shrinkages for the surface (RlS = 0.0742) and center
(Rl C = 0.0628) of the ceramic tile, the simulated
aver-age value (Rl Sim = 0.0663) and the experimental
value (Rl Exp = 0.0668) obtained in an industrial plant.
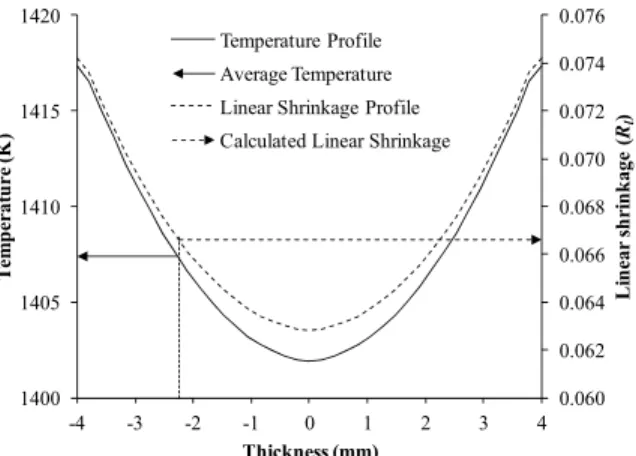
The methodology used to determine the average value for the linear shrinkage of the ceramic tile is represented by Figure 15, similar to Fig. 5. The domain is determined considering the average temperature, or the position, of the tile, and the corresponding value for the linear shrinkage is found. For the case in question, the average value obtained for the tem-perature of the ceramic tile was 1407 K. This is the temperature corresponding to a distance of 2.3 mm from the center of the tile. At this point, the simu-lated shrinkage and, therefore, the shrinkage attrib-uted to the piece, was 0.0668. Assuming that the initial size is 481.38 mm, it can thus be determined that the final size will be 449.22 mm.
The numerical results obtained for the final size of the product show a relative error of 0.043% in rela-tion to the experimental result.
0.060 0.062 0.064 0.066 0.068 0.070 0.072 0.074 0.076
1400 1405 1410 1415 1420
-4 -3 -2 -1 0 1 2 3 4
L
ine
a
r s
hr
inka
g
e
(
Rl
)
T
em
p
er
a
tu
re (
K
)
Thickness (mm)
Temperature Profile Average Temperature Linear Shrinkage Profile Calculated Linear Shrinkage
Figure 15: Determination of average linear
shrink-age of the ceramic tile considering the avershrink-age tem-perature of the domain.
It can be said that the model (coupling tempera-ture and linear shrinkage) is appropriate for applica-tion to the condiapplica-tions of industrial firings and repro-duces the trends observed in the dimensional charac-teristics of ceramic tiles. This tool could aid in the optimization of the firing curve, as well as the firing operation as a whole.
CONCLUSIONS
The firing operation conditions in continuous roller kilns and their influence on the ceramic tile sintering kinetics were analyzed on a laboratory and industrial scale. This was carried out through the mathematical modeling of the heat transfer by con-duction in the ceramic tiles, and the use of a kinetic model for the linear shrinkage during firing to ana-lyze the sintering process under different conditions, i.e., laboratory and industrial.
The results obtained from the numerical simula-tion of the linear shrinkage demonstrated a good agreement with the experimental laboratory data, which verified the influence of the firing time and temperature. It was also possible to analyze the linear shrinkage according to the tile thickness. We found that the ceramic tile with a thickness of 7.8 mm re-tracted less than that with a thickness of 2.3 mm, since the central areas do not reach the same temperature as the more superficial areas. This dif-ference in temperature allows the physical trans-formation of the material to occur with lower
intensity, resulting in lower bulk densities, greater water absorption, and lower linear shrinkage.
The industrial process used to produce ceramic tiles can be evaluated through numerical simulation, based on experimental results obtained in tests car-ried out at an industrial plant. This evaluation was carried out with operation in the steady-state regime, that is, the industrial kiln was completely loaded with ceramic tiles. The firing curve was obtained and the values for the final dimensions of the products, without the decorative layer, were determined in order to obtain the values for the linear shrinkage. The results presented by the mathematical model show that there is a significant difference in the lin-ear shrinkage that occurs at the surface and that at the center of the ceramic tile, due to the differences in their temperatures. The simulated value for the linear shrinkage of the tiles was similar to the value obtained experimentally. These results indicate that the proposed model can be used to simulate and to optimize the conditions of this industrial operation, serving as a practical tool for application by compa-nies active in this field.
ACKNOWLEDGMENTS
We are grateful to Eliane SA Revestimentos Cerâmicos for allowing access to their installations, and to Maximiliano Gaidzinski Institute for the fi-nancial support of this study.
NOMENCLATURE
cp Specific heat of the ceramic tile (kJ.kg-1.K-1)
EA Activation energy (J.mol-1)
hc Coefficient of heat transfer by convection (W.m-2.K-1)
hr Coefficient of heat transfer by radiation (W.m-2.K-4)
k Thermal conductivity (W.m-1.K-1)
ksolid Thermal conductivity of the ceramic tile (W.m-1.K-1)
q”cd,i Heat flows by conduction, where i = x, y, z (W.m-2)
q Terms for energy generation or
consumption (W.m-3)
R Ideal gas constant (Pa.m3.mol-1.K-1)
Rl Linear shrinkage (dimensionless)
t Sintering time (s)
Tsup Temperature on the surface of the ceramic tile (K)
Tg Gas temperature inside the kiln (K)
Taverage Average temperature of the ceramic tile (K)
x, y Dimensions of the ceramic tile (mm)
z Thickness of the ceramic tile (mm)
Greek Letters
ρ Density of the ceramic tile (kg.m 3
)
REFERENCES
Benavidez, E. R., González Oliver, C. J. R., Uso de métodos dilatométricos para el cálculo de la energía de activación asociada al sinterizado de compacto cerámico. In: Jornadas SAM, Misiones, Anais Jornadas SAM, CONAMET, 859-866 (2001). (In Spanish).
Bird, R. B., Stewart, W. E., Lightfoot, E. N., Trans-port Phenomena. 2nd Edition, John Wiley & Sons, New York (2004).
Cantavella, V. S., Simulación de la deformación de baldosas cerámicas durante la cocción. Tese Dou-torado, Universitat Jaume I de Castelló, Castellón (1998). (In Spanish).
Cargnin, M., De Souza, S. M. A. G. U., De Souza, A. A. U., De Noni Jr. A., Determinação de paráme-tros cinéticos da sinterização de revestimentos cerâmicos de monoqueima do tipo BIIa. Cerâ-mica, 57, 344, 461-466 (2011). (In Portuguese). Ferrer, C., Llorens, D., Mallol, G., Monfort, E.,
Mo-reno, A., Optimización de las condiciones de fun-cionamiento em hornos monoestrato. III Medida de gradientes transversales de temperatura. Técnica
Cerámica, 227, 653-662 (1994). (In Spanish). Jarque, J. C., Moreno, A., Enrique, J. E., Barba, A.,
Optimización de las condiciones de funciona-miento en Hornos monoestrato (IV): Mecanismos de transmisión de energía calorífica. Técnica Ce-rámica, 247, 566-572 (1996). (In Spanish). Maliska, C. R., Transferência de Calor e Mecânica
dos Fluidos Computacional. 2ª (Ed.), LTC, Rio de Janeiro (2004). (In Portuguese).
Matteucci, F., Dondi, M., Guarini, G., Effect of soda-lime glass on sintering and technological proper-ties of porcelain stoneware tiles. Ceramics In-ternational, 28, 873-880 (2002).
Orts, M. J., Amorós, J. L., Escardino, A., Gozalbo, A., Feliu, C., Kinetic model for the isothermal sintering of low porosity floor tiles. Appl. Clay Sci., 8, 2/3, 231-245 (1993a).
Orts, M. J., Escardino, A., Amorós, J. L., Negre, F., Microstructural changes during the firing of stone-ware floor tiles. Applied Clay Science, 8, 2/3, 193-205 (1993b).
Salem, A., Jazayeri, S. H., Rastelli, E., Timellini, G., Dilatometric study of shrinkage during sintering process for porcelain stoneware body in presence of nepheline syenite. Journal of Materials Process-ing Technology, 209, 3, 1240-1246 (2009).
Salem, A., Jazayeri, S. H., Rastelli, E., Timellini, G., Kinetic model for isothermal sintering of porce-lain stoneware body in presence of nepheline syenite. Thermochimica Acta, 503-504, 1-7 (2010). Zeng, W., Gao, L., Gui, L., Guo, J., Sintering kinetics
of-Al2O3 powder. Ceramics International, 25, 8,
723-726 (1999).