Reliability Evaluation of Reinforced Concrete Pipes
in Crack Opening Limit State
Avaliação da Coniabilidade de Tubos de Concreto
Armado no Estado Limite de Fissuração
J. L. SILVA a
M. K. EL DEBS b
A. T. BECK c
a Department of Structural Engineering, São Carlos Engineering School, São Paulo University, [email protected],
Av. Trabalhador São-Carlense, 400, CEP: 13566-590, São Carlos, Brasil;
b Department of Structural Engineering, São Carlos Engineering School, São Paulo University, [email protected], Av. Trabalhador São-Carlense, 400,
CEP: 13566-590, São Carlos, Brasil;
C Department of Structural Engineering, São Carlos Engineering School, São Paulo University, [email protected], Av. Trabalhador São-Carlense, 400,
CEP: 13566-590, São Carlos, Brasil;
Abstract
Resumo
Structural reliability theory is used in this paper to verify the capability of Brazilian code on design of concrete structures (NBR 6118:2003) concerning the evaluation of crack width in reinforced concrete pipes. Two limit state equations are deined in terms of crack opening. The First Order Second Moment and Monte Carlo simulation methods are used in the reliability analysis. In an initial reliability analysis, problem parameters that have the largest contributions in failure probabilities are identiied. A parametric analysis is performed in these variables, in order to study their inluence in failure probabilities. The study shows that the formulation of NBR 6118:2003 leads to non-uniform reliability, for a constant safety factor. This means that the unitary safety coeficient speciied by the code for the cracking limit state does not relect the uncertainty in the tubes resistance parameters.
Keywords: Pipe, Reinforced Concrete, Reliability, Crack.
Com a teoria da coniabilidade avaliam-se as duas formulações apresentadas pela norma de projeto de estruturas de concreto NBR 6118:2003 para a estimativa da abertura de issuras em tubos de concreto armado. Os métodos de coniabilidade FOSM (método de
primeira ordem e segundo momento) e o método de simulação de Monte Carlo com amostragem por importância são utilizados. Uma primeira análise de coniabilidade revela as variáveis de projeto com maior contribuição nas probabilidades de falha. Uma análise para
-métrica é realizada nestas variáveis, de maneira a identiicar a inluência destas na coniabilidade dos tubos. O estudo mostra que as formulações da NBR 6118:2003 levam a valores não uniformes para o índice de coniabilidade, para um mesmo fator de segurança. Isto signiica que o coeiciente de segurança unitário especiicado em norma para o estado limite de issuração não relete a incerteza nos parâmetros de resistência do tubo.
1. Introduction
The structural design of buried pipes must meet ultimate and service limit states, veriied from the internal forces. The dificulty in the eval
-uation of these internal forces is due to the fact that they depend on ground pressure over pipe walls, and this pressure depends on the form of installation (by ditches, landill or driven) and on the settle
-ment of the pipe (form of base and compaction of lateral earth ill). In the design of buried pipes, the Marston-Spangler’s procedure is usually employed (ZAIDLER [1]). This procedure involves de
-termining the resultant of vertical operating loads in the pipe, using an equivalence factor that correlates the behavior of the pipe in the ield and in standard test situations.
Amongst existing standard tests, the diametral compression test is one of the most widely used, due to its simplicity. This test is shown schematically in Figure 1.
An equivalence factor αeq is used to determine the diametral
compression force F in the standard test, to produce the same
bending moments in the tube as the resultant of vertical loads acting on the pipe in situ:
where:
q is the resultant of vertical loads of soil; qm is the resultant of variable vertical loads;
αeq is the equivalence factor;
γ
is the safety factor.According to NBR 8890:2003 [2], the safety factors applied to the vertical load expression are given by
γ
=
1
,
0
for the crack -ing limit state andγ
=
1
,
5
for the ultimate limit state.The ultimate (collapse) load is the maximum force achieved in the diametral compression test, which leads to the ultimate limit state for the pipe. The service load is one for which a crack with open
-ing of 0,25 mm will appear in the pipe, with a length of 300 mm or more, which corresponds to the service (cracking) limit state. According to the force resisted in the diametral compression test, NBR 8890:2003 [2] divides the pipes in classes, according to the cracking and ultimate load of the pipe. The code sets the require
-ments and tests for the acceptance of simple and reinforced cir
-cular pipes destined for pluvial waters and sewage drainage. NBR 6118:2003 [3] presents two formulas for calculating the characteristic value of crack opening. The aim of this work is to evaluate the reliability of these semi-empirical formulations for circular reinforced concrete pipes. Speciically, pipes used in pluvial water drainage and reinforced with welded steel meshes are addressed in the study. First, the main mechanical and geo
-metrical parameters that inluence reliability of the pipes are evaluated. Afterwards, a parametric analysis is realized in these variables.
This study is motivated by the absence of reliability analyses in the literature dealing with the cracking limit state of circular
reinforced concrete pipes.
2. Crack opening limit state
The veriication of crack opening can be made following proce
-dures indicated in NBR 6118:2003 [3]. This code provides the fol
-lowing expressions to determine the magnitude of crack opening: The parameters in eq. (2) and (3) have the following notation:
φ is the wire diameter of the reinforcing steel mesh;
η is the adhesion coeficient of the reinforcing wire mesh in tension;
Es is the steels elasticity modulus;
fctm is the average concrete resistance in tension;
wae ws are the asystematic and systematic cracking, respective
-ly;
s
σ
is the tensile stress in the reinforcement mesh in tension, which can be calculated from:where:
d is the section height;
Md is the distributed moment corresponding to the cracking load,
The smallest value between wa and ws is used in the evaluation
of crack opening. This value must be limited to 0.25 mm, which corresponds to the cracking load in the diametral compression test. It is noted that there is reasonable uncertainty in the deini
-tion of this parameter, to which the NBR 6118:2003 design code [3] refers to as an “order of magnitude” value.
2.1 Internal forces
The pipe is designed to withstand the diametral compression test. In this situation, the pipe is subject to an uniformly distrib
-uted load along its axis. Considering a state of plane strain, the pipe can be deined through a band of unit width, as shown in Figure 2.
The pipe is analyzed at two reference sections: the crown/base and lank sections, where internal forces and displacements are maximum. Using the elastic theory applied to thin rings, the in
-ternal forces sketched in Figure 3 are obtained.
3. Structural reliability
The fundamental problem of structural reliability can be formulated from the relationship between load action effect S and resistance
R. The failure event occurs when
R
− <
S
0
orR S
/
<
1
.FREUDENTHAL et al. [4] and ANG & TANG [5] deine the failure
probability as the integral over the domain of the product of func -tions
F
R(
s
)
andf
S(
s
)
, as shown in Equation 6 and Figure4. The failure probability deined in Equation 6 assumes indepen
-dence between the S and R variables.
The black area in Figure 4 represents the failure probability pF,
which is proportional to the region of interference between the re
-sistance and load effect curves. The bigger this interference area is, the greater the failure probability.
Generalizing for a problem involving n random variables, the failure As is the area of the reinforcing wire mesh in tension, per linear
meter;
r
ρ
is the geometric rate of the reinforcement wire with respect toarea Acr.
where:
Acr is the area of concrete that involves the wire of the steel
mesh (NBR 6118:2003 [3]);
Asi is the area of the wire of the reinforcement mesh submitted
to tension.
In Brazil, the reinforcement steel meshes have only been produced with corrugated wire. In the absence of precise indications for the value of
η
, it is recommended to use for evaluation ofprobability is evaluated by Equation 7, where
f
X(
x
)
is the joint probability density function and Df is the failure domain, deined bylimit state equation g(X), written in function of design variables X.
Methods used to evaluate equation 7 are differentiated by the ap
-proximations made in evaluating
f
X(
x
)
and Df. The joint densityfunction
f
X(
x
)
is determined on the basis of existing informa-tion, basically the marginal distributions functions (for instance,
)
(
s
f
S ef
R(
r
)
) and the correlation coeficient between pairs ofvariables ( ).
The First Order Second Moment met od (FOSM) has the following main characteristics:
a) the limit state equation is approximated by a linear function; b) construction of the joint function
f
X(
x
)
is based on secondorder moments (mean and covariance); that is equivalent to assume variables with normal distribution, possibly correlated. The First Order Reliability Method (FORM) distinguishes itself from FOSM because all the available statistical information on the ran
-dom variables is used. The limit state equation is still approximated by a linear function.
The failure probability can also be evaluated by means of Monte Carlo simulation. The Monte Carlo method is largely used because of its simplicity. It consists in a repetition of deterministic solutions, based on samples generated in accordance to the probability dis
-tributions of the problems random variables. It is common to use the Monte Carlo method to verify other approximate solutions, like FOSM and FORM.
In the Monte Carlo method, it is also possible to use techniques to reduce the number of required samples, especially when failure prob
-abilities are small. One of these techniques is called importance sam
-pling, which translates the sampled points towards the failure domain, avoiding excessive simulation away from the failure domain. From the failure probabilities deined in equations 6 and 7, one can deine the reliability index β, given by: 1
(
p
F)
−β = −Φ
. Inthis expression, 1
(.)
−Φ
is the inverse of the Standard Gaussian cumulative distribution function.The reliability index β can be compared to the so-called central safety fac -tor (FS), following equations 8 and 9 (ref. [6]). These equations apply to
a situation involving two correlated Gaussians basic variables: resistance and load effect. In equations 8 and 9, FS is the relationship between the
means of resistance and load effect. The reliability index β is the ratio between the mean and the standard deviation of the safety margin.
In these equations:
R
m
is the mean resistance;R
σ
andσ
S are the resistance and load effect standard devia-tions, respectively;
R
v
andv
S are the R and S coeficients of variation, respective-ly;
RS
ρ
is the correlation coeficient between R and S.It can be noticed that the relationship between β and FS is strongly non-linear, and depends on the statistical moments of R and S.
4. Methodology of analysis
An initial reliability analysis was performed to reveal the most im
-portant parameters in the reliability of the concrete pipes. After this study, parametric analyses were performed, varying the parameters of the most inluential variables. These analyses consist in evalu
-ation of the central safety factors FS associated reliability indexes
4.1 Limit state equations
According to the formulation presented in NBR 6118:2003 [3] to estimate crack opening in reinforced concrete structures, two limit state functions are obtained. From these equations, it is possible to evaluate the probability of a given concrete pipe not reaching the minimum cracking load, once speciied the pipes class.
From the expressions of NBR 6118:2003 [3] that indicate the force necessary to cause mean crack opening in the diametral compres
-sion test, the following limit state equations (EEL) are obtained in terms of the force F applied in the test:
where:
and:
Rm is the mean radius of the pipes circular cross-section;
C is the constant that varies according to the bending moments
diagram in the diametral compression test. It is equal to 0.318 if the rounding of bending moments in the crown are not considered (EL DEBS [8]);
F is the minimum force for a crack opening of 0.25 mm, as sug
-gested in NBR 8890:2003 [2], for a speciied pipe class.
The F1 and F2 terms represent two resistance conditions for the
cracking limit state of reinforced concrete pipes.
In order to perform the reliability analysis in the cracking limit state, the following assumptions were considered:
a) Until the crack opening of 0.25 mm, bending moments grow linearly with the load. This assumes no signiicant load redistributions due to nonlinear behavior. This hypothesis is reasonable when working with service loads.
b) For a preliminary evaluation, all random variables are assumed to follow a normal distribution.
c) The basic variables are considered non-correlated, because no correlation information is available.
d) Expressions 12 and 13 were determined for the crown section, where bending moments are more critical in relation to the appearance of cracks, as shown in Figure 3.
4.2 Data used in reliability analysis
In the design of reinforced concrete pipes of nominal diameters less than 800 mm, usually circular reinforcement is used. In this study, a pipe with nominal diameters of 800 mm is considered. Based on information from a Brazilian manufacturer, pipes of 800 mm have the following characteristics: the walls thicknesses (h)
have standard value of 72 mm, the sections useful height (d) has
a mean of 45 mm and the concrete used in pipe production has characteristic compression strength (fck) of 35 MPa.
Concrete variability is deined in accordance with NBR 12655:1996 [9]. Following this code, concrete resistance depends on prepara
-tion condi-tions, and the following values are obtained for the stan
-dard deviation of concrete strength: 4 MPa; 5.5 MPa and 7 MPa. According to NBR 8890:2003 [2], the axial force to be resisted by the pipe in the diametral compression test, or minimum cracking load for pluvial drainage use, is 32 kN/m.
The values of crack opening, the conformation coeficient for the tensile reinforcement surface and the diameter of the reinforce
-ment mesh wire are: w = 0,25 mm; η = 2,25 eφ = 7,1 mm,
respec-tively.
Since not all random variable statistics can be observed from ex
-perimental data, it is necessary to adopt literature values and the authors experience to infer such statistics.
5. Results and discussion
5.1 Preliminary reliability analysis
In a preliminary reliability analysis, the following random variables are considered: useful height (d), concrete compression strength
(fc), pipe wall thickness (h), diametral compression force in the
standard test (F) and steels elasticity modulus (Es). Table 1 shows
the parameters used for each of the problems random variable. The FOSM method is used in this study to obtain reliability indexes. Sub-products of this analysis are sensitivity coeficients, which indicate which variables give the most contribution to the evaluated failure probability. Table 2 shows, for each limit state equation, the design points, the sensitivity coeficients, the reliability indexes and the failure probabilities evaluated. Since the purpose of this investigation is to evaluate safety and reliability, both limit state functions are consid
equation (EEL1 and EEL2) for the data shown in Table 1. Note that there is no inluence of variable fc in EEL2, because this variable
does not belong to this equation (equation 13).
In EEL1 the most important variables are useful height (d) and concrete compression resistance (fc). In EEL2 the most important
variables are useful height (d) and pipe wall thickness (h).
5.2 Parametric analysis
The sensitivity coeficients obtained in the preliminary reliability analysis revealed that the largest contribution to pipe failure prob
-ability is due to useful height and concrete strength random vari
-ables. Parametric analyses are carried out in these variables, by varying the standard deviation of these variables. The First Order Second Moment method (FOSM) and Monte Carlo simulation with importance sampling are used in this analysis.
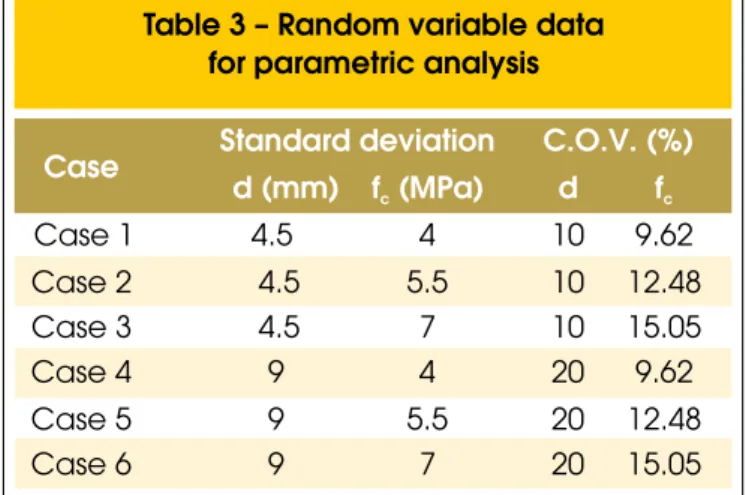
According to the variances of useful height (d) and concrete
strength (fc), the parametric analysis is composed of 6 cases, as
shown in Table 3. For all cases, the pipe wall thickness (h) has a
ixed standard deviation of 7.2 mm.
Tables 4 and 5 summarize the reliability analysis results for each limit state equation, EEL1 and EEL2, respectively. The evaluated reliability parameters are: reliability index and failure probability evaluated by FOSM (
β
FOSM, pF,FOSM) and by Monte Carlo sim-ulation with importance sampling (
β
MCAI, pF,MCAI); the centralsafety factor and reliability index evaluated from equations 8 and 9. The Monte Carlo simulation uses 1000 sampling points.
The two formulas provided in NBR 6118/2003 for evaluation of crack opening represent a series system, where failure is charac
reliability index variation as measured by FOSM, by Monte Carlo simulation or by equation 9.
Comparing the reliability indexes presented in Tables 4 and 5, it is observed that βFOSM and βMCAI are greater than βequation9. This, how
-ever, was not observed in Table 4 for the cases 1, 2 and 3 of the Monte Carlo simulation.
According to results presented in Tables 4 and 5, an increase in the coeficients of variation of d and fc, causes decrease in βFOSM,βMCAI and βequation9, as could intuitively be expected. It is also observed in
Table 4 that the variation in reliability index is more sensitive to the uncertainty in d, as observed in cases 4, 5 and 6.
It is valid to emphasize that the reliability indexes obtained in this study relect the variability of the random variables in each case, which does not occur with the central safety factor, which remained constant for EEL1 and EEL2. Generally, specifying only the central safety factor to the de
-signer will lead to variations in reliability indexes. The associated reliabil
-ity index should be supplied, because this allows the uncertainty to be properly taken into account. This conclusion can also be found in other structural engineering applications, as in AOKI [10] and SILVA [11]. The design points in physical space are shown in Figure 6 for EEL1 and EEL2. In this igure,
µ
X represents the mean point, X1* and X2* are the design points associated to EEL1 and EEL2, respective-ly. The lines that pass through X1* and X2* are the failure surfaces. Figure 6 shows that limit state equation EEL2 better represents the crack limit state in this analysis. Of course, this conclusion is limited to the pipe coniguration investigated in this study.
Results presented in Tables 4 and 5 can be compared with recom
-mendations by the Eurocode 1 [12] and CEB [13]. Eurocode 1 recommends reliability index values of: 1.5 for service limit state and 3.8 for ultimate limit state. The CEB [13] also presents some suggestions in accordance with required safety classes, as shown in Table 6. The values presented in this table can be used as ref
-erence in structural design, that is, the structure is designed or veriied so that its reliability matches the suggested values. In a comparison tio the suggested values, the following conclusions can be stated:
a) in all analysis, EEL1 satisies the Eurocode 1 [11] suggestion for service limit state; the same is not true for EEL2;
b) analysis cases 1, 2 and 3 (Table 4) satisfy safety levels 1 and 2 as recommended by the CEB [13], which is not true for EEL2 and cases 4, 5 and 6.
6. Conclusions
This paper presents a contribution to the study of reinforced con
-crete pipes in the crack opening limit state, a topic not extensively covered in the literature.
In the formulation of NBR 6118:2003 [3] for evaluation of charac
-teristic values of crack opening in reinforced concrete pipes, the most important variables are useful height, concrete compressive strength and pipe wall thickness.
This study showed that for the same central safety factor, the for
-mulations of NBR 6118:2003 lead to distinct reliability indexes, depending on the uncertainty in the important random variables. Hence, design based on a central safety factor does not guarantee uniform reliability. The same is true for the design of concrete pipes in the crack opening limit state. The safety coeficient established in design code for this limit state (
γ
=
1
,
0
) does not relect the uncertainty in resistance parameters of the tube.7. Acknowledgements
Sponsorship of this research project by CAPES and CNPq is greatly acknowledged by the authors.
8. References
[02] Brazilian Association Standards. NBR 8890:
Concrete pipes for circular section for pluvial waters and sanitary sewers –requirements and test methods.
Rio de Janeiro, 2003. (in Portuguese).
[03] Brazilian Association Standards. NBR 6118: Design
of concrete structures.Rio de Janeiro, 2003.
(in Portuguese).
[04] FREUDENTHAL, A. M.; GARRELTS, J. M. & SHINOZUKA, M.. The Analysis of Structural Safety. Journal of the Structural Division, ASCE, Vol. 92, No ST1, February, p. 267-325, 1966.
[05] ANG, A.H-S & TANG, W.. Probability concepts in engineering planning and design. Volume II: Decision, Risk and Reliability.Jonh Wiley & Sons. New York. 562p, 1984.
[06] SILVA, J. L.. Application of ruin probability in pile foundations projects. Engineering School of Sao Carlos, University of Sao Paulo. Dissertation (MSc.), 103p, Sao Paulo, 2006. (in Portuguese).
[07] BECK, A. T.. Computer-aided teaching of structural reliability. XXVIII Iberian Latin-American Congress on Computational Methods in Engineering, Porto - Portugal, 2007.
[08] EL DEBS, M. K.. Structural project of reinforced concrete circular pipes. 1ª edition. Sao Paulo: IBTS, 2003. (in Portuguese).
[09] Brazilian Association Standards. NBR 12655: Concrete – Preparation, Control and Receiving - Procedure.Rio de Janeiro, 1996. (in Portuguese). [10] AOKI, N.. Failure Probability and of permissible load
of pipe foundation.Military Magazine of Science and
Technology. Vol. XIX, pp. 48-64, Brasil, 2002. (in Portuguese).
[11] SILVA, J. L. & AOKI, N.. Simple determination of the ruin probability of columns group of a reinforced concrete building. Congress of Bridges and
Structures, ABPE, Rio de Janeiro, 2005. (in Portuguese). [12] EUROCODE 1. Basis of Design and Actions on
Structures. Comité Européen de Normalisation (CEN/TC250/SC1), ENV 1991-1, 1993.