Behaviour under cyclic loading of strengthened beams
Comportamento de vigas reforçadas sob ação de
carregamento cíclico
Abstract
Resumo
This work presents a study on the behavior of reinforced concrete beams strengthened in bending by the addition of concrete and steel on their tension side and having expansion bolts as shear connectors at the junction between the beam and the jacket, subjected to a cyclic loading. The experimental program included tests on six full scale reinforced concrete beams, simply supported, initially with rectangular cross section 150 mm wide and 400 mm high, span of 4000 mm and total length of 4500 mm. All the beams, after receiving two cycles of static loading in order to cre-ate a pre-cracking condition, were strengthened in bending by partial jacketing and then subjected to cyclic loading until the completion of 2x10⁶ cycles or the occurrence of fatigue failure. Following the cyclic loading, the beams that did not fail by fatigue were subjected to a static load up to failure. The main variables were the beam-jacket interface condition (smooth or rough), the lexural reinforcement ratio in the beam and in the jacket, and cyclic load amplitude. On the basis of the obtained test results and the results of previous studies of similar beams tested only under static loading, the behavior of the strengthened beams is discussed and a proposal for the beam-jacket connection design is presented, for the cases of predominantly static and cyclic loading.
Keywords: lexural strengthening, partial jacketing, fatigue, beams, cyclic loading.
Este trabalho apresenta estudo sobre o comportamento de vigas de concreto armado reforçadas à lexão, pela adição de concreto e barras de aço na região tracionada e chumbadores de expansão na ligação viga-reforço, submetidas a carregamento cíclico. O programa experimental incluiu ensaios em seis vigas de concreto armado em escala real, simplesmente apoiadas, inicialmente com seção transversal retangular com 150 mm de largura e 400 mm de altura, comprimento entre os apoios de 4000 mm e comprimento total de 4500 mm. Todas as vigas, depois de receber dois ciclos de carga estática, de modo a criar uma condição de pré-issuração, foram reforçadas à lexão por encamisamento parcial e, em seguida, submetidas a uma carga cíclica até ao inal de 2x10⁶ ciclos ou da ocorrência de ruptura por fadiga. Após a aplicação das cargas cíclicas, as vigas que não romperam por fadiga foram submetidas a uma carga estática até a ruptura. As principais variáveis foram a condição de interface de ligação entre viga e reforço (lisa ou rugosa), a taxa de armadura de lexão na viga e no reforço, e amplitude do carregamento cíclico. Com base nos resultados obtidos nos ensaios e em estudos anteriores de vigas semelhantes testadas apenas com carga estática, é feita uma discussão do comportamento dessas vigas reforçadas e apresentada uma proposta para dimensionamento da ligação viga-reforço, para os casos de carregamento predominantemente estático e cíclico.
Palavras-chave: reforço à lexão, encamisamento parcial, fadiga, vigas, concreto armado.
a Saneamento de Goiás S/A, Departamento de Estruturas, Goiânia, GO, Brasil;
b COPPE, Universidade Federal do Rio de Janeiro, Programa de Engenharia Civil, Rio de Janeiro, RJ, Brasil; c Universidade Federal Fluminense, Departamento de Engenharia Civil, Niteroi, RJ, Brasil;
d Universidade Federal de Goiás, Departamento de Engenharia Civil, Goiânia, GO, Brasil.
Received: 25 Aug 2016 • Accepted: 23 Mar 2017 • Available Online: 11 Dec 2017
A. P. R. VAZ a
I. A. E. SHEHATA b
L. C. D. SHEHATA c
R. B. GOMES d
1. Introduction
Strenghtening reinforced concrete beams by adding concrete and steel bars presents the advantages of relatively low cost and no need for a highly qualiied workforce, making it an interesting alter -native when it is possible to increase the cross-section dimensions of the element to be strengthened.
The effectiveness of strenghtening by jacketing relies on the ef-iciency of the connection between the beam and the jacket. The roughness and cleanness of the surface that will receive the new concrete are essential factors for that eficiency. According to [2], the shear strength of an interface between two concretes increas-es with increasing roughnincreas-ess.
It is a consensus that an adequate curing of the new concrete is needed in order to minimize its initial shrinkage and ensure good bonding between concretes of different ages [3] and there is evi -dence that interfaces with greater roughness have shear strength less affected by differential shrinkage of the two concretes [4]. The shear strength of the interface between the two concretes can be increased with the use of reinforcement crossing it in two ways: dowel action, which corresponds to the lexural strength combined with axial tension, and by the production of normal stress at the interface, which is an indirect effect mobilized by the relative dis-placement between the joint. In case of cyclic loading, increas-ing the ratio of this reinforcement not only decreases the interface damage resulting from such loading, minimizing the loss of stiff-ness of the strengthened element, but also increases the number of cycles it can withstand.
One of the main factors that can reduce the interface shear strength is the effect of cyclic actions, which cause a decrease in the stiffness of the element, associated to a greater propaga-tion of cracks, leading to strains in the structural elements larger than those veriied under short-term static loading, and to different stress redistribution. In view of this, beams that, under static load-ing exhibit lexural failure, when subjected to cyclic loadload-ing, can present shear failure or failure by loss of bond between concrete and reinforcement [5]. It should be noted that the number of cycles the structure supports, as well as the degree of interface damage,
is directly related to the amplitude of the cyclic loading to which the structure is subjected.
Although conventional reinforcement, which is attached to the ele-ment to be strengthened by means of adhesives, is usually used in practice, in this work, the use of the expansion bolts was cho-sen due to its easier ixation, without adhesives, leading to greater speed in the execution of strengthening.
Literature review carried out by Vaz [1] shows that there is not much research on the behavior of strengthened reinforced con-crete beams by addition of concon-crete and steel bars and, among the researches reviewed, the ones described in [7], [8], [9], [10], [11] can be cited. From them, only one included beams with cyclic load-ing [8] and two included beams with expansion bolts at the beam-jacket connection ([10], [11]). In view of the practicality of using expansion bolts at the beam-jacket connection, an experimental study was developed aiming to contribute to the understanding of the behavior of beams strengthened with this technique when they are subjected to cyclic loading. This study, detailed in [1], is sum-marized here.
2. Experimental program
2.1 Characteristics of the beams and test methods
The main variables of the 6 tested beams were:
n ratio of tensile longitudinal reinforcement of the beams before (1,09% or 0,483%) and after strengthening (0,401%, 0,541%, 1,00% or 1,31%);
n the beam-jacket interface condition (rough or smooth);
n the cyclic load amplitude.
The beams with no strengthening had rectangular cross-sections 150mm wide and 400mm high and a total length of 4500mm. The beams were simply supported, with a distance of 4000mm be-tween the centers of the supports (one roller and one pinned). The concentrated loading was applied at midspan. The beams were designed to have lexural failure, with yielding of longitudinal ten-sile steel, having suficient transversal reinforcement to guarantee such a failure. Figure 1 and table 1 show the dimensions and rein-forcement of the beams before strengthening.
Figure 1
Before strengthening, the beams were pre-cracked. This proce-dure consisted in the application of static loading at the middle of the span until the strains of the bending reinforcement at midspan were around 2.0 ‰. Next, the beams were unloaded, and prepared to be strengthened.
On the lateral faces of the regions that would become beam-jacket interfaces, the surface concrete was removed (depth about 15mm) using a chisel, exposing the reinforcement (tensile longitudinal and transverse) and coarse aggregates. On the lower face, where, in practice, this would be more dificult to do, the cover was not totally removed and the surface was only chipped to make it rough. This procedure was used for beams V1R to V4R, while for beams V5R and V6R the beam surface was left as it was (smooth). Although more sophisticated methods can be used in laboratory ([12] and [13]), the roughness index R was measured by the sand
patch method. After roughening the lower surface of the beams, this method was used in three different regions along the lengths of the beams. Table 2 gives the values of R found and their mean Rm. For cases with R ≥ 1,5mm, according to [13], the surface can be classiied as rough.
The strengthening consisted of a reinforced concrete jacket with a trapezoid-shaped cross-section, geometrically equal to the one used in beams of previous work ([10] and [11]), exempt that the width of the lower part of the V5R and V6R jacket measured 180mm instead of 150mm. This difference in V5R and V6R was due to the fact that, prior to strengthening, no concrete surface layer was removed from these beams in the region that would be the beam-jacket interface.
On the sides of the that region, 9.5 mm diameter expansion bolts similar to those used by Santos [10] and Simões [11] were installed,
Figure 2
Expansion bolts
Table 1
Dimensions and reinforcement of the beams before strengthening
Beam (mm)b (mm)h (mm)d (mm)d’ As
(mm2) (%)r
As’
(mm2) r
’ (%)
Asw/S (mm2/
mm)
rsw
(%)
V1 and
V2 150 400 369 27 603 1.09 100 0.182 0.670 0.447
V3 to
V6 150 400 386 27 280 0.483 100 0.174 0.670 0.447
Asw – cross-section area of shear reinforcement in length s;
s – spacing of shear reinforcement;
As – cross section area of longitudinal tensile reinforcement;
As´ – cross section area of longitudinal compression reinforcement;
r – geometrical ratio of longitudinal tensile reinforcement;
r’– geometrical ratio of longitudinal compression reinforcement;
rsw – geometrical ratio of transverse reinforcement.
Table 2
Roughness index R values and their mean R
mBeam R
(mm)
Rm
(mm) Beam
R (mm)
Rm (mm)
V1
1.50
1.54 V3
1.52
1.54
1.52 1.55
1.59 1.56
V2
1.57
1.55 V4
1.47
1.52
1.59 1.58
and with the same 150mm spacing (igure 2). They served both for positioning the jacket reinforcement and improving the perfor-mance of the beam-jacket connection. The ratio of expansion bolts in the beam-jacket connection (rw) was 0.329% for beams with rough surface and 0.298% for those with smooth surface (larger beam-jacket interface area). Considering the yield stress of expan-sion bolts of the 540MPa, leads to rwfy values of 1.78 MPa or 1.61 MPa for rough and smooth surface, respectively.
Figure 3 gives details of the reinforcement in the jackets and Table 3 the reinforcement of the strengthened beams of this study and of similar beams of previous works ([10] and [11]).
After about 30 days from casting the jackets, cyclic loading was started, with a frequency of 2Hz or 3 Hz and loads ranging from about 25% to 50%, 30% to 60% or 35% to 70% of the theoretical bending failure load. The beams were subjected to cyclic loading until the occurrence of fa-tigue failure or completion of a total number of 2x10⁶ cycles. The beams
that resisted to 2x10⁶ loading cycles, without having a fatigue failure,
were unloaded and, then, subjected to a inal static load up to failure. For testing, the beams were simply supported (one roller and a pinned support) having a span of 4000mm. They were loaded at mid-span using a 500kN capacity jack connected to a load/dis-placement control system.
Figure 3
Reinforcement in the jackets of beams V1R to V6R
Table 3
Dimensions and reinforcement of the strengthened beams
Current work Main steel
(f in mm) dR As
(mm2)
AsR
(mm2) (%)rR (%)rT
Beam Jacket
V1R 3f16,0 4f6,3 and 2f8,0 374 603 225 0.401 1.48
V2R 3f16,0 6f8,0 372 603 302 0.541 1.62
V4R 2f10,0 and 1f12,5 4f8,0 and 2f16,0 402 280 603 1.00 1.47
V3R, V5R, V6R 2f10,0 and 1f12,5 4f8,0 and 3f16,0 409 280 804 1.31 1.77
Earlier works Main steel
(f in mm) d
R
As (mm2)
AsR
(mm2) (%)rR (%)rT
Beam Jacket
VR1 [10] 3f16,0 6f8,0 372 603 302 0.541 1.62
VR2 [11] 2f10,0 and 1f12,5 4f8,0 and 2f16,0 402 280 603 1.00 1.47 VR3 [11] 2f10,0 and 1f12,5 4f8,0 and 3f16,0 409 280 804 1.31 1.77 b = 150mm; h = 470mm; d´= 27mm; As´= 100mm
2
During the static loading tests, concrete strains were measured at four levels of a section at 130mm from the midspan (igure 4), by means of a demec gauge with 100 mm length gage and a smaller division of 0.001mm. Strains of the longitudinal tensile reinforce-ment were measured using electrical resistance strain gauges
stuck on the bars of the beams and the jackets, at midspan and at a section 960mm from midspan (igure 5). The vertical displace-ments of the beams were measured using two strain gauge dis-placement transducers, at sections 150mm apart from the mid-span and at each side of the loading region. The relative horizontal
Figure 4
Position of bases for demec gauge measurements
Figure 5
displacements at the beam-jacket connection were measured with strain gauge displacement transducers placed at the section at 960mm from midspan and at the end of the jacket using aluminium devices (igure 6).
2.2 Materials
CA-50 and CA-60 steel bars were used as reinforcements of beams and jackets. The transverse reinforcement of the beams and of the jackets had 8.0 mm and 5.0 mm diameter, respectively. The longitudinal compression reinforcement of the beams consist-ed of 8.0 mm diameter bars, as well as the longitudinal
reinforce-ment of jackets together with 6.3 mm bars. The longitudinal tensile reinforcement of beams V1 and V2 and some of the jackets had 16.0 mm diameter. Bars of 10.0 mm and 12.5 mm diameter were used as longitudinal tensile reinforcement of beams V3 and V6. Samples of each type of bar were tested and the average values of yield stress and tensile strength obtained were, respectively, 655 MPa and 739 MPa (5.0 mm), 596 MPa and 767 MPa (6.3 mm), 607 MPa and 748 MPa (8.0 mm), 522 MPa and 641 MPa (10.0 mm), 555 MPa and 688 MPa (12.5 mm), 562 MPa and 686 MPa (16.0 mm).
The concrete mix was chosen aiming a compressive strength of 30 MPa at 28 days. For each concrete batch cylindrical specimens
Figure 6
were moulded for the compression, tensile and modulus of elastic-ity tests. The mean values obtained in the tests related to con-cretes of the beams and jackets were, respectively: 34.0 MPa and 33.0 MPa for compression strength, 3.60 and 3.57 MPa for splitting tensile strength and 26.0 GPa for modulus of elasticity.
3. Results and discussion
Table 4 summarizes the experimental results of the tested beams. The theoretical bending failure load values of the strengthened beams, Pu,theo, used in this table were determined using fc and fy obtained in the material tests (gc=gs=1) and are given in table 5.
3.1 Cracks and load
In the strengthened beams, some cracks on the jackets were ob-served during the two static loading cycles before the cyclic load-ing. During the cyclic loading, other lexural cracks appeared in the jacket up to about the irst 100 000 cycles for the beams V1R, V2R, V3R and V5R, 70 000 cycles for the V4R and 5000 cycles for the V6R. Besides theses cracks, in V4R and V6R, with a load variation between 25% to 50% of Pu,theo and higher rRfy values (5,69MPa and 7,39MPa), shear cracks appeared in the regions near the sup-ports and horizontal cracks in the beam-jacket connection. Beam V6R, that failed by fatigue of the expansion bolts at beam-jacket
Table 4
Loading and results of the tested beams
Initial static loading (before strengthening)
Beam rR (%) rT (%) Pcr (kN) Pmax (kN) δi (mm) εs,i (‰) εs,ires (‰) δres,i (mm)
V1 V1R 0.401 1.48 25 60 8.73 1.78 0.383 2.31
V2 V2R 0.41 1.62 25 60 8.88 1.72 0.368 2.00
V3 V3R 1.31 1.77 20 35.4 8.58 1.99 0.527 2.43
V4 V4R 1.00 1.47 15 35.3 8.96 2.09 0.602 2.95
V5 V5R 1.31 1.77 20 35.6 7.66 2.08 0.497 2.09
V6 V6R 1.31 1.77 20 35.5 7.68 1.97 0.481 2.15
Final static loading (strengthened)
Beam Pu,exp
(kN) (mm)δu,exp
εsu,exp (‰)
Maximum relative displacement
(mm) Failure
mode
Beam Jacket S1 S2 S3
V1 V1R – – – – – – –
Steel fatigue 1.865.825
cycles
V2 V2R 193 33.8 46.7 50.52 – 0.081 0.058 Flexure
V3 V3R 180 18.1 2.24 2.59 0.754 0.051 9.85 Shear at
beam-jacket interface
V4 V4R 186 25.3 – – 0.641 0.04 0.444 Flexure
V5 V5R 173 28.6 2.02 2.20 1.34 0.843 6.57 Shear at
beam-jacket interface
V6 V6R – – – – – – – Bolts fatigue
875.280 cycles
rR – tgeometric ratio of longitudinal tensile reinforcement of jacket; rT – total geometric ratio of longitudinal tensile reinforcement of strengthened beam;
δi – vertical displacement corresponding to the maximum load Pmax in the initial static test; δres,i – residual vertical displacement at the end of the initial
static test; δres – residual vertical displacement at the end of cyclic loading; δu,exp – vertical displacement at failure load of beams that did not have
fatigue failure;
εs,i – longitudinal reinforcement strain of the beam corresponding to the maximum load in the initial static test; εs,res – residual strain of longitudinal
reinforcement of the beam at the end of initial static test; εs,max – maximum strain of longitudinal reinforcement of the beam during cyclic loading;
εu,exp – maximum strain of longitudinal reinforcement of the beam or jacket at failure load of the beams that did not have fatigue failure;
Pcr – load corresponding to the irst visible cracks during initial static test; Pu,exp – experimental failure load of the beams that did not have fatigue failure.
Cyclic loading (strengthened)
Beam Pmin/Pu,teo (%) Pmax/Pu,teo (%) εs,max (‰) εs,res (‰) δres (mm)
V1 V1R 33 64 2.36 – –
V2 V2R 19 40 1.28 0.352 1.74
V3 V3R 22 42 1.57 0.345 2.52
V4 V4R 24 58 1.64 – 4.54
V5 V5R 21 42 1.37 0.301 2.21
connection, presented the greatest number of shear cracks during the cyclic loading. In V1R, with lower longitudinal reinforcement ratio in the jacket (rRfy=2,29MPa) and a load variation between 32% and 64% of Pu,theo, these horizontal and shear cracks did not appear. It had failure by fatigue of the main steel of the jacket and showed only bending cracks and with greater width.
During the inal static test, beams V2R and V4R, that had bend -ing failure, presented similar crack-ing patterns. The beams V3R and V5R, which had shear failure at the beam-jacket connection, presented smaller number of lexural cracks than the other beams. The theoretical and experimental values of bending strength of the strengthened beams of this and previous researches ([10] and [11]), calculated with experimental values of concrete compressive strength and steel yield stress and parabola-rectangle diagram for normal compression stresses in concrete, are presented in table 5. The experimental maximum values of normal stresses and the variation of these stresses in the longitudinal tensile reinforcement at the beginning of cyclic loading, obtained from the measured
steel strains, and also the calculated ones are given in table 6. Table 5 shows that only the beams of this study that had shear failure at the beam-jacket connection had a
ratio smaller than one (0.85 and 0.80) and that the beam with the smooth beam-jacket interface had the lowest ratio. For the beams of previous work [11] similar to those of this study, but subjected to a static loading only, with shear failure at the beam-jacket connection, this ratio was 1.07 and 1.00. Comparing V3R with VR3 [11] (rT = 1.77% and rR = 1.31%, with rough
beam-jacket interface and shear failure at this connection), it is found that the V3R had a resistance capacity 21% smaller. However, this re-duction cannot be attributed only to cyclic loading, since V3R had
rRfy 11% lower. Taking this into account, the reduction of strength
due to cyclic loading becomes 12%.
In beams with rT = 1.62% and rR = 0.541% (V2R of this study and VR1[10]), which had bending failure, the cyclic loading did not af -fect the resistance capacity, since the difference between the ex-perimental failure loads of beams with only static loading and with
Table 5
Experimental and theoretical failure loads of strengthened beams of [1] and previous work [10] and [11]
Static loading Rough beam-jacket interface Cyclic loading Rough beam-jacket interface Cyclic loading Smooth beam-jacket interface
Beams rR
(%) rT (%) rRfy
(MPa) rTfy
(MPa) Pu,exp (kN) Pu,teo (kN)
Pu,exp/ Pu,teo
Pu,exp (kN)
Pu,teo (kN)
Pu,exp/ Pu,teo
Pu,exp (kN)
Pu,teo (kN)
Pu,exp/ Pu,teo
V1R 0.401 1.48 2.29 8.46 – – – – – – Steel fatigue
VR1 [10] 0.541 1.62 2.97 8.92 186 156 1.19 – – – – – –
V2R 0.541 1.62 3.12 9.33 – – – 193 168 1.15 – – –
VR2 [11] 1.00 1.47 6.11 8.98 205 192 1.07 – – – – – –
V4R 1.00 1.47 5.69 8.29 – – – 186 177 1.05 – – –
VR3 [11] 1.31 1.77 8.29 10.8 229 230 1.00 – – – – – –
V3R 1.31 1.77 7.39 9.98 – – – 180 212 0.85 – – –
V5R 1.31 1.77 7.39 9.98 – – – – – – 173 216 0.80
V6R 1.31 1.77 7.39 9.98 – – – – – – Bolts fatigue
Flexure Shear at the beam-jacket interface Fatigue
Table 6
Maximum normal stresses and variation of these stresses in the longitudinal tensile reinforcement at the
beginning of cyclic loading, obtained from measured and calculated steel strains
Beams rRfy
(MPa) rTfy (MPa)
Pmin/ Pu,teo (%)
Pmáx/ Pu,teo
(%)
σs,max
(MPa) σs,max,calc (MPa)
Δσs (MPa)
Δσs,calc
(MPa) σsR,max
(MPa) σsR,max,calc
(MPa)
ΔσsR (MPa)
ΔσsR,calc (MPa)
V1R 2.29 8.46 32 64 299 366 155 183 477 494 231 247
V2R 3.12 9.33 20 40 187 234 100 117 225 317 102 159
V4R 5.69 8.29 25 56 265 304 152 167 330 380 174 209
V3R 7.39 9.98 21 42 172 213 87 107 253 269 116 135
V5R 7.39 9.98 21 42 173 213 98 107 225 269 111 135
static loading after the cyclic one corresponds almost to the differ-ence between the values of rTfy of these beams.
The V1R (rT = 1.48% and rR = 0.401%) had the highest Pmin/Pu,theo and Pmax/Pu,theo ratios of the tested beams (32% and 64%) and, con-sequently, larger variations of normal stress in the reinforcement in the jacket (causing fatigue in that reinforcement) and of verti-cal displacement. This beam had σsR,max= 477MPa ≈ 0,79 fy and
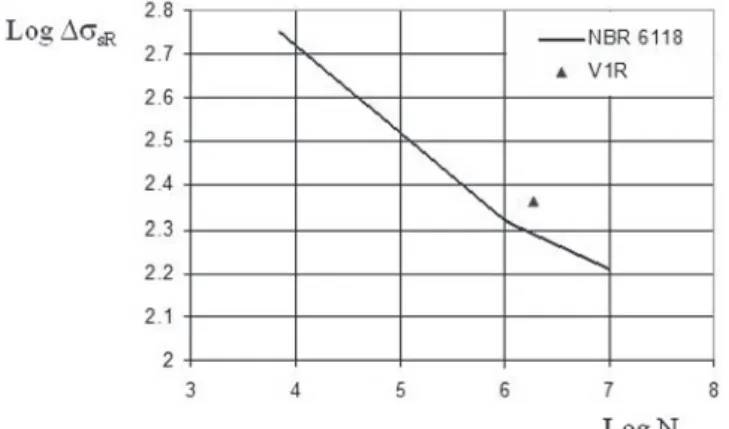
DσsR=231MPa. In igure 7, it can be seen that, for the number of
cycles veriied in V1R (1 865 825), there was a variation of normal stress in the reinforcement greater than the limit given by the re-lationship between Dσs and the number of cycles N of ABNT NBR 6118:2014 [14]. Due to the low steel ratio used in the jacket, the shear stress variation at the beam-jacket interface was low and there was no slipping at that connection.
3.2 Reinforcement strains
For the static load before the cyclic one, in general, the ratios be-tween the strains of the reinforcement in the jacket (bottom layer) and in the beam varied between 1.2 and 1.4, values that would be expected according to a state II analysis, but in beam V1R these ratios ranged from 1.5 to 1.7.
During cyclic loading, except for V2R, the measured maximum and minimum strains of the longitudinal tensile steel, as a function of number of cycles, for beams that did not have fatigue failure did not show a stabilization tendency. Beam V6R, that had fatigue failure of the expansion bolts, had a differentiated behavior, presenting a sudden decrease in the strains of the longitudinal reinforcement of the jacket and, at the same time, a sudden increase in the strains of the longitudinal reinforcement of the beam, when N was equal to about 600 000 cycles (igure 8).
Table 7 lists the values of the maximum strains of the longitudinal tensile reinforcement of jackets and beams measured during cyclic loading, as well as the variation of these strains and the residual strains at the end of loading. These values depend on Pmin ⁄ Ptheo and Pmax ⁄ Ptheo and on rT.
The strains of longitudinal reinforcement in the jacket measured during the inal static loading at midspan of V2R are compared with the ones of beam VR1[10] in igure 9, and those of beams V3R and V5R compared with the ones of V3R [11] in igure 10. The curves of beams VR1[10] and V2R are practically coincident for load values up to 50kN; for higher loads, the curve of V2R, with ρTfy about 5% higher, show smaller strains.
In igure 10, it can be seen that, for the same load, beam V5R, with smooth beam-jacket interface, presented smaller strains than
V3R, with rough surface, and that the strains curve of V3R is close to that of VR3 [11], and although the two beams had the same kind of failure, the excessive slipping at the beam-jacket interface of V3R prevented the longitudinal reinforcement of the jacket from having strains higher than εy* (strain corresponding to fy when a
steel bilinear normal tensile stress-strain diagram with plateau is considered) and caused V3R to fail at a lower load than VR3 [11], for which strains larger than the yielding one were measured (about 8.5‰).
3.3 Longitudinal force, shear stress and slipping
at the beam-jacket connection
The longitudinal force TR, and, from it, the shear stress at the beam-jacket interface t, was calculated using the strains measured in the longitudinal reinforcement of the jacket at midspan. Table 8 shows TR,max and DTR during cyclic loading, obtained from measured and calculated strains. The sum of the jacket longitudinal reinforce-ment forces at midspan of each beam obtained from the measured strains, for different levels of the inal static loading, is in table 9 and igure 11 gives these longitudinal forces as a function of the applied load for beams V3R, V5R and V6R, together with the ones of VR3 [11], with the same tensile longitudinal reinforcement ra -tio. This igure shows the variation that the measured strains may have as a result of cracking, since, from equilibrium condition at
Figure 7
Comparison between the relationship between N
and
Dσ
sRaccording to ABNT NBR 6118:2014 [14]
and the one of the beam with steel fatigue failure
Figure 8
midspan, for a given load, beams with same longitudinal steel ratio must have the same value of TR.
Table 10 lists the values of horizontal force at the beam-jacket con-nection (static loading) and the variation of that force during cyclic loading for beams that had shear failure at the beam-jacket con-nection, and also for V4R.
On the basis of the TR,max and DTR values for beams V5R and V6R given in table 10, and considering that the longitudinal force at beam-jacket connection is resisted only by the expansion bolts (24 bolts in all, disregarding the two bolts at midspan), the equations (1.0a) and (1.0b) that give the expansion bolt shear force variation,
DTR,ch, as a function of the number of cycles could be deduced. The one that gives logDTR,ch as a function of logN (1.0a) is of the type commonly used for shear connectors [15] and the one that gives
DTR,ch as a function of logN (1.0b) is its equivalent. The same ex -pression was assumed for smooth and rough interfaces, in view of the little difference between the strengths of beams V3R and V5R, and TR,ch is given in newtons.
(1a)
or
(1b)
These expressions can be written in the form of shear stress varia-tion in the bolts (in MPa), that is
(2a)
or
(2b)
It should be noted that, for N=1, this variation is approximately equal to 0.4fy and that, according to Tresca failure criteria (which is more conservative than the Von Mises one), the shear stress limit would be 0.5fy. This lower resistance can be explained by the stress con-centration due the existence of thread in the expansive bolts and by the fact that the expansive bolts are not subjected to pure shear.
Figure 9
Load - maximum longitudinal steel strain curves for
beams VR1 [10] and V2R
Figure 10
Load - maximum longitudinal steel strain curves for
beams VR3 [11], V3R and V5R
Table 7
Maximum strain of the longitudinal tensile reinforcement of jacket and beam and strain variation during
cyclic loading and residual strain at the end of loading
Beam rR
(%) (%)rT
Pmin/ Pu,teo
(%)
Pmax/ Pu,teo
(%)
εsR,max
(‰)
ΔεsR
(‰) εsR,res
(‰) ε(‰)s,max
Δεs
(‰) εs,res
(‰)
V1R 0.401 1.48 32 64 2.36+ 1.15+ – 1.49+ 0.777+ –
V2R 0.541 1.62 20 40 1.28 0.532 0.352 1.04 0.539 0.244
V4R 1.00 1.47 25 56 1.64+ 0.863+ – 1.41+ 0.842+ –
V3R 1.31 1.77 21 42 1.57 0.576 0.345 1.09 0.501 0.235
V5R 1.31 1.77 21 42 1.37 0.769 0.301 1.08 0.579 0.229
V6R 1.31 1.77 27 54 1.49* 0.836* – 1.24* 0.781* –
Figure 12 shows the relationship between the shear resis-tance at the connection, τR, and ρw fy given by the expression
tR = 0,4 ρw fy and those of beams VR2 and VR3 of [11] and V3R
and V5R. All of them had longitudinal shear failure at the beam-jacket interface during monotonically increasing load, but VR2 and VR3 [11] had not been previously subjected to cyclic loading. Beam V4R was also included, although it had bending failure, because shear failure at the beam-jacket connection was imminent. The τR
values of V4R, V3R and V5R are those of residual shear strength after cyclic loading. This igure shows that, with the exception of V4R, which did not have failure at the beam-jacket connection, the expression tR = 0,4 ρw fy leads to values of tR smaller than or approximately equal to the ones of the beams analyzed, for both beams tested only statically and for those subjected to cyclic load-ing before the static one (residual resistant shear stress).
Figures 12 and 13 suggest that the beam-jacket connections pro-vided with expansion bolts can be designed considering
e
(3)
where N is the expected loading cycles, Dt is obtained from the longitudinal forces values at the connection TRmax and TRmin calcu-lated at stage II, for maximum service load (permanent loads +
frequent variable loads) and minimum (permanent loads), respec-tively, and fyd = fy ⁄ 1,15.
The maximum displacements between beam and jacket, in the
Figure 11
Load - T
Rcurves of beams VR3 [11], V3R, V5R and
V6R, with same reinforcement ratio
Table 8
Jacket main steel maximum force T
R,maxand force variation
D
T
Runder cyclic loading, obtained from
measured and calculated steel strains
Beam rR
(%) (%)rT
Pmin (kN)
Pmax (kN)
TR,max (kN)
TR,max,calc (kN)
TR,max,calc/
TR,max DTR
(kN) D(kN)TR,calc D TR,calc/
DTR
V1R 2.29 8.46 50 100 79.2 89.8 1.13 40.2 44.8 1.11
V2R 3.12 9.33 34 68 58.0 73.1 1.26 30.4 36.5 1.20
V4R 5.69 8.29 45 100 186 201 1.08 102 111 1.09
V3R 7.39 9.98 45 90 179 196 1.10 84.6 98.2 1.16
V5R 7.39 9.98 45 90 167 196 1.18 87.2 98.2 1.13
V6R 7.39 9.98 58 116 218 253 1.16 120 127 1.06
Table 9
Longitudinal force and nominal shear stress at the beam-jacket interface during inal static loading
Load (kN)
TR (kN) t (MPa)
V1R+ V2R V4R+ V3R V5R V6R V1R+ V2R V4R+ V3R V5R V6R+
0 0 0 0 0 0 0 0 0 0 0 0 0
20 8.83 17.9 30.7 33.2 19.1 36.3 0.017 0.0330 0.0571 0.0618 0.0321 0.0611
40 26.3 36.3 70.6 75.2 48.5 73.9 0.049 0.0680 0.131 0.140 0.0814 0.124
60 43.6 56.0 110 120 92.2 110 0.081 0.104 0.206 0.224 0.155 0.186
80 60.0 72.2 151 163 125 150 0.112 0.134 0.282 0.305 0.210 0.252
100 71.5 82.4 185 202 162 190 0.133 0.153 0.346 0.376 0.272 0.320
120 – 104 – 244 202 234 – 0.194 – 0.454 0.339 0.395
140 – 133 – 291 241 – – 0.247 – 0.541 0.405 –
150 – 142 – 315 262 – – 0.267 – 0.586 0.439 –
160 – 144 – 335 290 – – 0.299 – 0.624 0.487 –
170 – 161 – 356 333 – – 0.299 – 0.662 0.561 –
173 – 161 – 361 335 – – 0.299 – 0.673 0.563 –
180 – 161 – 383 – – – 0.299 – 0.712 – –
193 – 161 – – – – – 0.299 – – – –
beams V2R and V4R, that had bending failure, were 0.260 mm and 0.641 mm, respectively. In beams V3R and V5R, with shear failure at the beam-jacket connection, displacements of 0.754 mm and 1.34 mm were registered in the position S1 and 9.85 mm (V3R) and 6.57 m (V5R) in the position S3. Figure 14 shows the relationship between load and slipping at the beam-jacket connec-tion of beams VR3 [11] and V3R and V5R, where plateaus indicate the effect of the expansive bolts used in the connection. Observ-ing in igure 14 the curves of beams with rough beam-jacket inter -face, V3R, and VR3 [11], it can be seen that, for the same relative displacement value, VR3 [11], which had no cyclic loading, had a higher load.
4. Conclusions
There are few experimental studies on shear strength of concrete connections under cyclic loading and, in the literature review [1], no study on connections with expansion bolts was found. According to the MC 2010 (FIB, 2013), in the design of interfaces subjected to
cyclic loading, it is recommended a reduction to about 40% of the static resistance, if cracks are likely to occur at the connection. In view of the advantages of the bending strengthening by adding concrete and steel bars and expansion bolts at the beam-jacket connection, the experimental study described here was developed aiming to investigate the behavior of beams strengthened accord-ing to this technique, under unidirectional cyclic loadaccord-ing with differ-ent amplitudes.
The comparison between similar strengthened beams, with rough beam-jacket interface, tested only statically with those that had cy-clic loading before the static one showed that cycy-clic loading had no negative inluence on the strength capacity of beams with bending failure (V2R, V4R).
The beams with shear failure at the beam-jacket connection, unlike the similar ones tested under only static loading, the larger rela-tive displacements veriied at the beam-jacket connection of the beams tested with cyclic loading prevented the longitudinal tensile reinforcement from having strains larger than that corresponding to the beginning of yielding. From the beams that differed only by
Figure 12
Relationship between
t
Rand
r
wfyaccording to expression
t
R= 0,4
r
wfyand those of beams VR2 and VR3
[11] and the residual shear stress of V4R, V3R and V5R
Table 10
Values of T
R,maxand
D
TRcorresponding to static and cyclic loading
Only static loading During cyclic loading Static load after cyclic
Beam rR (%) rT (%) TR,max (kN) DTR (kN) TR,max*(kN)
VR2 [11] 1.00 1.47 370 – –
V4R 1.00 1.47 – 111++ 348
VR3 [11] 1.31 1.77 490 – –
V3R 1.31 1.77 – 98.2++ 401
V5R+ 1.31 1.77 – 98.2++ 385
V6R+ 1.31 1.77 – 127+ –
+ ssmooth interface; T
R,max* after cyclic;
the condition of the beam-jacket interface (V3R and V5R), the one with smooth interface had resistance practically equal to the one with rough interface.
Tests of strengthened beams and direct shear tests of connections between concretes with expansions bolts previously carried out with no cyclic loading showed that the design of the connections should consider
(4)
On the other hand, to cover the cases of static and cyclic loads, it
was veriied that it is possible to consider for shear stress variation at the connections
(5)
As far as the beam-jacket relative displacements is concerned, it was veriied that, for the same load, beam with cyclic loading has greater displacement than the similar beam with only increasing monotonic loading.
Figure 13
Shear stress variation in beam-jacket interface as a function of the number of cycles given by
equation (2.0b)
Figure 14
5. References
[1] VAZ, A. P. R.. Comportamento de vigas reforçadas sob ação de carregamento cíclico. Tese de D. Sc., COPPE/ UFRJ, Rio de Janeiro, RJ, 2012.
[2] GOHNERT, M. Horizontal shear transfer across a roughened surface. Cement and Concrete Composites, v. 25, n.3, (Apr), pp. 379-385, 2003.
[3] CLIMACO, J. C. T. S.; REGAN, P. E. Evaluation of Bond strength between old and new concrete in structural repairs. Magazine of Concrete Research, v. 53, n.6, (Dec), pp. 377-390, 2001.
[4] BEUSHAUSEN, H., ALEXANDER, M. G. Bond strength de -velopment between concretes of different ages. Magazine of Concrete Research, v. 60, n.1, (Feb), pp. 65-74, 2008. [5] MATTOCK, A. H. Shear transfer in concrete having reinfor
-cement at an angle to the shear plane, ACI Special Publica-tion SP-42, American Concrete Institute, pp. 17-42, 1974. [6] LIEW, S. C., CHEONG, H. K.. Flexural behavior of jacketed
RC beams. Concrete International, v. 13, n. 12, (Dec), pp. 43-47, 1991.
[7] PIANCASTELLI, E. M. Comportamento do reforço à lexão de vigas de concreto armado, solicitando a baixa idade e executando inclusive sob carga. Dissertação de M. Sc., UFMG, Belo Horizonte, Minas Gerais, 1997.
[8] CHEONG, H. K.; MacALEVEY, N. Experimental behavior of jacketed reinforced concrete beams. ASCE Journal of Struc -tural Engineering, v. 126, n. 6, (Jun), pp. 692-699, 2000. [9] BORJA, E. V. Estudo do comportamento de vigas de
concre-to armado reforçadas à lexão e esforço cortante. Disserta-ção de M. Sc., UFPE, Recife, Pernambuco, 2001.
[10] SANTOS, E. W. F. Reforço de vigas de concreto armado à lexão por encamisamento parcial. Dissertação de M. Sc., COPPE/UFRJ, Rio de Janeiro, RJ, 2006.
[11] SIMÕES, M. L. F. Reforço à lexão de vigas de concreto ar -mado por encamisamento parcial. Dissertação de M. Sc., COPPE/UFRJ, Rio de Janeiro, RJ, 2007.
[12] SANTOS, P. M. D., JÚLIO, E. N. B. S., SILVA, V. D. Corre-lation between concrete-to-concrete bond strength and the roughness of the substrate surface, Construction and Buil-ding Materials, v. 21, n.8, (Aug), pp. 1688-1695, 2007. [13] FÉDÉRATION INTERNATIONALE DU BÉTON, FIB Model
Code for concrete structures 2010, 2013. Lausanne, Swit-zerland.
[14] ASSOCIAÇÃO BRASILEIRA DE NORMAS TÉCNICAS, 2014. ABNT NBR-6118:2014: Projeto de Estruturas de Con-creto – Procedimento. Rio de Janeiro, RJ, Brasil.
![Figure 3 gives details of the reinforcement in the jackets and Table 3 the reinforcement of the strengthened beams of this study and of similar beams of previous works ([10] and [11]).](https://thumb-eu.123doks.com/thumbv2/123dok_br/18861407.417993/4.892.72.822.268.659/figure-details-reinforcement-jackets-reinforcement-strengthened-similar-previous.webp)


![Figure 12 shows the relationship between the shear resis- resis-tance at the connection, τ R , and ρ w f y given by the expression t R = 0,4 ρ w f y and those of beams VR2 and VR3 of [11] and V3R and V5R](https://thumb-eu.123doks.com/thumbv2/123dok_br/18861407.417993/11.892.357.813.121.575/figure-shows-relationship-shear-resis-resis-connection-expression.webp)
