ISSN 0104-6632 Printed in Brazil
www.abeq.org.br/bjche
Vol. 25, No. 04, pp. 743 - 749, October - December, 2008
*To whom correspondence should be addressed
Brazilian Journal
of Chemical
Engineering
PRODUCTION OF
15
N-ENRICHED
NITRIC ACID (H
15
NO
3
)
C. R. Sant Ana Filho
1*, J. A. Bendassolli
1, A. L. R. M. Rossete
1,
S. M. S. Piedade
2and C. V. Prestes
11
Centro de Energia Nuclear na Agricultura, CENA, Universidade de São Paulo, USP, Avenida Centenário 303, C.P. 96, CEP: 13.400-970, Piracicaba - SP, Brazil.
E-mail: [email protected], E-mail: [email protected]
2
Departamento de Ciências Exatas, Escola Superior de Agricultura Luiz de Queiroz, Universidade de São Paulo, USP, Avenida Pádua Dias 11,C.P. 9,
CEP: 13418-900, Piracicaba - SP, Brazil.
(Received: August 20, 2007 ; Accepted: February 18, 2008)
Abstract - Techniques that employ 15N have proved to be an important tool in many areas of the agronomic and biomedical sciences. Nevertheless, their use is limited by methodological difficulties and by the price of compounds in the international market. Nitric compounds (15NO
3-) have attracted the interest of researchers. However, these compounds are not currently produced in Brazil. Thus, in the present work H15NO3 was obtained from the oxidation of anhydrous 15NH3. The method we used differs from the industrial process in that the absorption tower is replaced with a polytetrafluoroethylene-lined, stainless-steel hydration reactor. The process output was evaluated based on the following parameters: reaction temperature; ratio of reagents; pressure and flow of 15NH3(g) through the catalyst (Pt/Rh). The results showed that, at the best conditions (500 ºC; 50 % excess O2; 0.4 MPa; and 3.39 g.min-1 of 15NH3), a conversion percentage (N-15NH3 to N-15NO3-) of 62.2 %, an overall nitrogen balance (N-15NH3 + N-15NO3-) of 86.8 %, and purity higher than 99 % could be obtained.
Keywords: Nitric compounds; Catalyst; Reactor; Stable isotope.
INTRODUCTION
Nitrogen is considered to be a limiting factor for primary production, both on land and in the aquatic environment, since it is the main component of enzymes that control the biochemical reactions in which carbon is reduced and oxidized (Schelsinger, 1991). In most studies involving stable isotopes (tracer), isotopes of light elements are used, such as nitrogen and its isotopes, which have great importance in biological systems studies, and also take part in most geochemical reactions (Fritz and Fontes, 1989).
Under natural conditions, nitrogen has two stable isotopes, 14N and 15N, with isotopic abundances of 99.73 and 0.37% in atoms, respectively (Weast, 1998). The existence of the heavy nitrogen isotope
(15N) allows the production of compounds enriched in this isotope, characterized by having isotopic abundances above those naturally found. These compounds, in turn, allow the isotopic technique to be used in many research studies, and allow many of the aspects involved in the nitrogen cycle to be elucidated, in both the agronomic (soil-plant-atmosphere system) (Trivelin et al., 2002) and biomedical fields (Dichi et al., 1998).
The isotopic technique that uses 15N as tracer basically consists of supplying the organism under study with a chemical compound in which the isotopic ratio (15N/14N) of the compound under consideration is different from that naturally found, and then evaluating the isotope's distribution in the system under study. In many research studies
Brazilian Journal of Chemical Engineering
agronomic and biomedical fields, nitrogen compounds highly enriched in the isotope have to be used, due to the isotopic dilution of the systems under study (Knowles and Blackburn, 1993). Until recently, these compounds were not produced in Brazil and South America, due to difficulties of a methodological nature. Such compounds had to be imported from the United States, Europe, or Asia at high prices, which varied proportionally depending on enrichment and type of compound. H15NO3 (50%
m/v solution) enriched at 95 % in atoms of 15N has a FOB price on the order of U$90.00 (ninety dollars) per gram on the international market.
Consequently, the production of 15N-labeled nitric compounds is being requested by researchers to be used in agronomic investigations, particularly for factors that allow information to be obtained on the nitrogen cycle. Within this context, we could highlight the marked mobility of nitrogen, with emphasis on the occurrence of losses caused by volatilization (loss in gaseous forms), biological immobilization, erosion, and leaching.
The technology of isotopic separation and production of 15N-enriched compounds is not shared by other countries, due to economic or even strategic factors. In this respect, some studies have been developed in Brazil (Maximo et al., 2000; Bendassolli et al., 2002; Bendassolli et al., 1988; Bendassolli et al., 1989; Bendassolli, 1991; Tavares et al., 2006; Maximo et al., 2005; Oliveira, 2000; Tavares, 2005).
From the above, considering the control over the
methodology of isotopic separation and the importance of making other 15N-enriched nitrogen compounds available for the country's researchers at lower-than-FOB prices, the objective of this study was the production (in batches) of 15N-enriched H15NO3, and to evaluate the parameters (reaction
temperature, ratio between reagents, system pressure and flow of 15NH3(g) through the catalyst) involved in
the process.
EXPERIMENTS
Gases (O2, N2, NH3) and Isotope (15N)
Oxygen (O2) 5.0 (99.999 %) and commercial
nitrogen (N2) (97 to 98 %) were used. The tests,
aimed at evaluating the parameters involved in the
process, were performed using NH3 (1,8 g) with
natural isotopic abundance (0.366 % in atoms of
15
N), and purity in the order of 99 % (2.0). Anhydrous 15NH3 enriched to 90 % in atoms of 15N
(Bendassolli, et al., 2002), was used as an isotopic source for the production of H15NO3.
H15NO3 Production Process
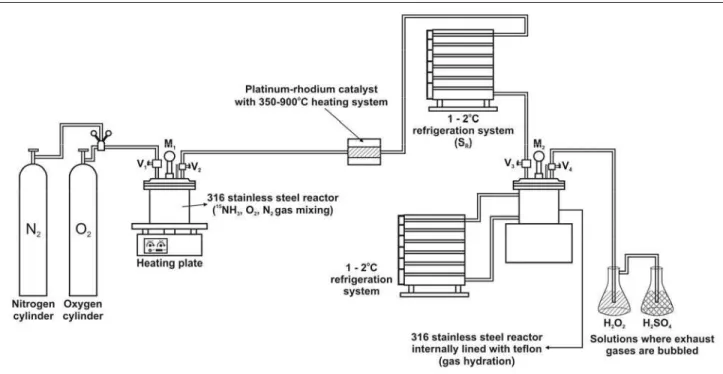
The complete H15NO3 production system is
represented schematically in Figure 1, while Figure 2 shows in detail the gas loading system in the mixing reactor.
Production of N-Enriched Nitric Acid (H NO3) 745
Brazilian Journal of Chemical Engineering Vol. 25, No. 04, pp. 743 - 749, October - December, 2008
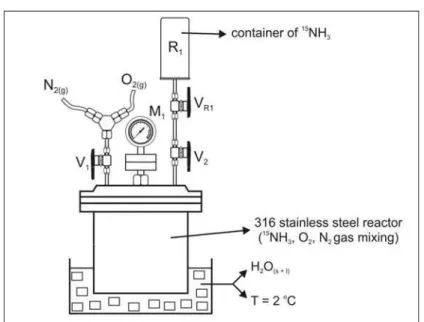
Figure 2: Gas loading system (15NH3, O2, N2) into the reactor
Figure 2 shows the stainless steel reactor (3 L) containing two inlets (V1 and V2). The O2 and N2
were admitted via V1, while the V2 valve admitted
the previously-enriched anhydrous 15NH3. Initially,
prior to transferring the reagent gases into the reactor, its internal pressure was reduced by refrigeration (2oC) to facilitate gas admission. Then the R1 container containing anhydrous 15NH3 was
connected to the V2 valve and VR1 and V2 were
opened, transferring the gas into the reactor. The container was weighed and the mass (g) of 15NH3
determined.
Using this value and the stoichiometric ratio (eq.
1), we determined the amount (mols) of O2 to be
transferred into the mixing reactor. This amount was
admitted by V1 and controlled by the reactor's
pressure gauge, using the ideal gas equation. When needed, the inert gas N2 was added (V1) into the
same reactor in order to maintain pressure in the system at the desired conditions.
2 (l)
H O
15 15
3(g) 2(g) 3(aq)
NH + 2 O → H NO (1)
Next, the mixture of gases (15NH3, O2, and N2) in
the mixing reactor was heated to 110 ºC on a hot plate (Figure 1) for 10 minutes. At the same time, the catalyst was heated in an infrared oven equipped with a temperature controller. After heating both parts of the system, V2 was opened and the gases
were conducted through a stainless steel pipe (diameter ¼ inch) until reaching contact with a fine screen (8g), disposed in several layers, consisting of platinum (90 %) and rhodium (10 %). In this step,
the anhydrous 15NH3 was catalytically oxidized and
converted into 15NO, according to Ostwald's
industrial method (Tageder and Mayer, 1980). The velocity of the catalytic reaction is very rapid, giving conversion in a short contact time (3.10-4s) (Swaddle, 1997).
Next, the 15NO containing excess O2, needed for
the oxidation process, was cooled by a cooling coil (SR) (Figure 1), using H2O as cooling fluid. As the
resulting gases cool down, the 15NO formed reacts with the O2 present in excess, forming 15NO2. This
reaction is a slower oxidative process, but equilibrium is favored by a reduction in temperature (Shreve and Brink, 1977). In this process, the formation of 15N2O4 may occur.
Finally, the V3 valve was opened, displacing the
gases into the stainless steel reactor (2 L) at a
constant flow, where most of the 15NO not yet
oxidized to 15NO2 was then converted by the excess
O2. Next, when the pressures at the M1 and M2
manometers became equal, two procedures were employed to evaluate the effectiveness of the production process. In the first procedure, which used a complete flow of gases, valve V4 was opened
and the gases were exhausted (30 minutes), passing through a recovery system. Finally, valves V4, V3,
and V2 were closed, in this order. In the second
procedure, which used partial flow of gases, valves V3 and V2 were closed, in this order, and valve V4
was opened, causing only the hydration reactor gases to be exhausted, passing through a recovery system. Finally, valve V4 was closed, and the gases that were
in the mixing reactor, containing mainly anhydrous
15
Brazilian Journal of Chemical Engineering
In the reactor, 15NO2 was absorbed in H2O,
forming H15NO3 at a variable concentration,
depending on the evaluated parameters. The process used here is different from the industrial method (Tageder and Mayer, 1980) with respect to the replacement of the absorption tower with a stainless steel reactor (internally lined with polytetrafluoroethylene) containing refrigerated H2O
(2 oC), in order to hydrate the 15NO2. This absorption
reaction is favored because of the reduced volume in the production system and the use of high pressure values (0.80 to 1.2 MPa), according to Le Chatelier's
principle (Shreve and Brink, 1977). In the reactor, the reactions of 15NO2 absorption in H2O and
15
NO
oxidation with residual O2 were processed
simultaneously (Cekinski, 1990).
After absorption, the exhaust gases, possibly containing gases such as N2, residual O2, 15NO, and 15
NO2, underwent an oxidation process using H2O2,
at the exit of the hydration reactor. These exhaust gases may also contain possible traces of 15NH3 not
converted in the process, which is neutralized in a 2.5 mol L-1 H2SO4 solution.
At the end of the process, the hydration reactor was opened and the solution (H15NO3) contained inside it
was transferred to a proper reservoir (amber flask); the N content (N-NH4+ and N-NO3-) was then determined
by distillation and titration (Trivelin et al., 1973). This procedure was also used to analyze the solutions obtained from the recovery system, in order to obtain the overall nitrogen balance (in relation to initial
15
NH3). The isotopic determination (% in atoms of 15N)
to verify the isotopic abundance of the final product was performed in an ATLAS MAT model CH4 mass spectrometer (Mulvaney, 1993).
Experimental Design
The process output for H15NO3 production was
verified based on the following parameters: reaction temperature (350 to 900 ºC); ratio between reagents
(Stoichiometric, 25, 50, and 100 % excess O2) and
flow of gases (total or partial).
The best conditions regarding reaction temperature, ratio between reagents, and flow of gases were used to evaluate process output in relation to the following parameters: flow of NH3 through the catalyst (0.02;
0.04; 0.20; 0.62; and 3.39 g.min-1) and system pressure (0.2; 0.34; 0.49; 0.64; and 0.78 MPa).
The tests were conducted with three replicates, according to a completely randomized experimental design, in factorial combination. The means were submitted to statistical analysis (Tukey 5 %).
Finally, tests were run with three replicates, aimed at the production of H15NO3 enriched at 90 %
in atoms of 15N, at the best conditions for the
(physicochemical) parameters evaluated.
RESULTS AND DISCUSSION
The statistical analysis of data on temperature and reagent amounts showed an effect of these factors and their interactions on the H15NO3 production
process. Table 1 presents data on mean conversion output (N-NH3 to N-NO3-) and overall nitrogen
balance (in relation to initial NH3), as a function of
reaction temperature and excess amount of O2, using
total flow of gases in the mixing reactor. The best results were obtained at temperatures of 500, 600, and 900 ºC for 50 and 100 % excess O2. Although no
statistical differences were observed among the results, the increase in reaction temperature was disadvantageous, due to the fact that during the tests a reduction in catalytic activity was verified: the catalyst had a usable life of 150 batches (tests). This phenomenon, defined as deactivation, is a strong chemisorption of reagents and impurities on the active sites of the catalyst, causing changes on the metal surface. Therefore, the best conditions for the production system were obtained when a temperature of 500 ºC was used for 50 and 100 % excess O2.
Table 1: Conversion output (N-NH3 to N-NO3-) and overall N balance (in relation to initial N-NH3) as a
function of parameters 'reaction temperature' and 'excess amount of O2', using total flow of gases.
Conversion (%) Overall N balance (%)
Excess amount of O2 (%) Excess amount of O2 (%)
T
(ºC) 0 25 50 100 0 25 50 100
400 20.4 aB 25.6 aBC 21.7 aBC 21.7 aC 45.8 aA 49.7 aA 43.7 aAB 41.7 aAB
500 17.0 cB 32.7 bAB 41.7 abA 47.5 aA 33.6 bA 40.7 abAB 48.6 aA 51.2 aA
600 35.8 abA 31.5 bAB 41.9 aA 45.4 aAB 38.7 aA 35.2 aBC 43.6 aAB 47.7 aA
700 19.0 aB 23.0 aBC 19.8 aC 15.9 aC 32.2 aA 25.9 aC 34.2 aBC 28.4 aB
800 20.2 aB 17.4 aC 16.9 aC 18.9 aC 35.4 aA 31.5 aBC 29.3 aC 30.0 aB
900 27.5 bAB 41.2 aA 32.5 abAB 33.8 abB 33.5 aA 41.3 aAB 33.5 aBC 45.1 aA
Production of N-Enriched Nitric Acid (H NO3) 747
Brazilian Journal of Chemical Engineering Vol. 25, No. 04, pp. 743 - 749, October - December, 2008
It was also verified that the mean overall nitrogen balance results (Table 1) at 500 ºC and O2 excess
values between 50 and 100 % showed a 2 % difference, which is equivalent to R$20.00 per batch, when enriched 15NH3 is used (90 % in atoms of 15N),
while the addition of 50 % excess O2 has an
additional cost of R$0.16. Therefore, the best conditions were obtained when 100 % excess O2 was
used at 500 ºC. Under these conditions, the conversion of 47.5 % was possible, and an overall nitrogen balance of 51.2 % was achieved. The difference to complete the nitrogen mass balance refers to actual losses, which might be related to the ineffectiveness of the 15NO2 hydration step and the
influence of residence time of the gases with the catalyst's active metal (Pt), causing undesirable reactions in the process (N2 and N2O formation).
The temperature variation (400 to 900 ºC) results indicated a low conversion output for temperatures of 400, 700, and 800 ºC, using total flow of gases in the mixing reactor. The low conversion obtained at 400 ºC can be attributed mainly to the ineffectiveness of the 1st oxidation (NH3 to NO), as
demonstrated by the overall nitrogen balance values (Table 1).
In order to maintain high pressure in the system, a partial flow of gases was used in the mixing reactor. The mean conversion and overall nitrogen balance results as a function of the amount of O2 (0, 25, 50,
and 100 % excess O2) and reaction temperature (350,
500, 650, and 800 ºC), with three replicates, are presented in Table 2.
It can be seen that the best results (conversion and overall nitrogen balance) were obtained at temperatures of 500 and 650 ºC for 0 and 50 % excess O2, without statistical differences. However,
with regard to the means (Table 2), the best system operation condition was observed with the use of 50
% excess O2 at 500 ºC, since the use of high
temperatures in the catalysis oven may increase the catalyst's deactivation rate (usable lifetime). Another important fact that justifies the best conditions herein defined was the 5 % difference in the mean overall nitrogen balance results (Table 2) for excess O2
values between 0 and 50 %. This difference is equivalent to R$51.00 per batch, using enriched
15
NH3 (90 % in atoms of 15
N), while the addition of
50 % excess O2 in the production reaction costs
R$0.16. At the best conditions, a conversion of 55.2 % was possible, and an overall nitrogen balance of 82.9 % was achieved. The difference to complete the mass balance refers to actual losses in the system, which were lower (about three times) than those
obtained under total flow of gases. The reasons for these losses were an ineffective 2nd oxidation (NO to NO2) and the occurrence of undesirable reactions
(production of N2 and N2O), considering that no NH3
was quantified in the gases exhausted from the hydration reactor.
By comparing the results in Tables 1 and 2, decreases in conversion output and overall nitrogen balance can be observed when low temperatures (350 to 400 ºC) as well as high temperatures (700 and 800 ºC) were used, in both gas flow conditions at the mixing reactor. However, at intermediate temperatures (500, 600, and 650 ºC), superior results were observed, especially at 500 ºC, where the highest process output was obtained. This result was obtained using partial flow of gases in the mixing reactor, with the addition of 50 % excess O2 in the
reaction (eq. 1).
Using the best conditions (temperature of 500 ºC, 50 % excess O2 and partial flow of gases) established
in the process and a mean mass of 1.8g NH3 (0.366
% in atoms of 15N), tests were carried out with three replicates to evaluate process output as a function of NH3 flow through the catalyst and production system
pressure. The gases were conducted with exhaust time of 30 minutes (hydration reactor).
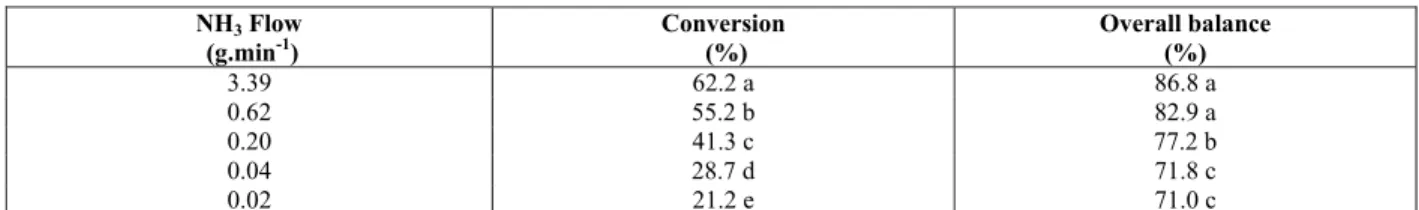
Under these conditions, there was an influence on conversion output and on overall nitrogen balance as a function of NH3 flow (0.02; 0.04; 0.20; 0.62; and
3.39 g.min-1) through the catalyst. The results
obtained (Table 3) demonstrated a significant difference (P<0.05) in conversion output for all times evaluated. However, it can also be observed that there were no statistical differences for overall nitrogen balance results at flow values of 0.62 and 3.39 g.min-1, which were statistically different from other values. Consequently, the best conversion
results were obtained using a NH3 flow of 3.39
g.min-1. Under this condition, a conversion of 62.2 %
was possible, and an overall nitrogen balance of 86.8 % was achieved. Flow rates higher than 3.39 g.min-1 were not studied due to operational limitations of the system (piping diameter).
An influence of pressure (0.20 to 0.78 MPa) on
conversion output was also verified. The results obtained did not show significant differences (P<0.05) for pressure values from 0.20 to 0.64 MPa, for which
mean conversion output was 55.2 ± 2.3 %, achieving an overall balance of 82.9 ± 1.7 %. However, there was a statistical difference at a pressure value of 0.78 Mpa;
Brazilian Journal of Chemical Engineering
Table 2: Conversion output (N-NH3 to N-NO3-) and overall N balance (in relation to initial N-NH3) as a
function of parameters 'reaction temperature' and 'excess amount of O2', using partial flow of gases.
Conversion (%) Overall N balance (%)
Excess amount of O2 (%) Excess amount of O2 (%)
T
(ºC) 0 25 50 100 0 25 50 100
350 14.3 aC 14.5 aC 15.1 aC 11.4 aB 66.9 bC 67.4 abC 69.2 aB 73.6 aA
500 47.4 abA 43.0 bA 55.2 aA 42.1 bA 77.7 abAB 74.8 bAB 82.9 aA 76.9 abA
650 49.0 aA 47.9 aA 48.6 aA 45.2 aA 83.7 aA 81.3 aA 79.8 aA 79.2 aA
800 33.3 abB 29.2 bB 38.4 abB 41.3 aA 72.5 abBC 69.6 bBC 77.7 aA 78.3 aA
Measurements followed by different lower case letters in the rows and upper case letters in the columns are statistically different by Tukey test at the 5 % probability level
Table 3: Conversion output (N-NH3 to N-NO3-) and overall N balance (in relation to initial N-NH3) as a
function of NH3 flow through the catalyst (Pt/Rh).
NH3 Flow (g.min-1)
Conversion (%)
Overall balance (%)
3.39 62.2 a 86.8 a
0.62 55.2 b 82.9 a
0.20 41.3 c 77.2 b
0.04 28.7 d 71.8 c
0.02 21.2 e 71.0 c
Means followed by different letters are different by Tukey test at the 5 % probability level.
The entire production process (batch) involving all steps described, using 1.8g anhydrous 15NH3, was
performed in 60 min. Therefore, based on the best conversion result (62.2 %) and using previously enriched 15NH3, the production line has a daily
capacity to obtain 1,020 mL of 0.05 mol L-1 H15NO3
solution (approximately 3.2g) enriched at 90 % in
atoms of 15N. The amounts produced (g),
corresponding to two batches, can be considered adequate, since most research studies involving the
15
N isotopic technique use compounds enriched at about 5 % in atoms of 15N. As a result, starting from 3.2g H15NO3 enriched at 90 % in atoms of 15N and
using the isotopic dilution technique, we were able to produce 62g H15NO
3 enriched at 5 % in atoms of 15
N. The isotopic enrichment of H15NO3 occurs
because of the 15N isotopic concentration in the
reagent (anhydrous 15NH3), since no isotopic
fractionation was verified in the conversion from
N-15
NH3 into N-15NO3.
CONCLUSION
The best conditions for H15NO3 production were:
catalysis oven temperature of 500 ºC; 50 % excess O2; use of partial flow of gases in the mixing reactor;
pressure of 0.4 Mpa and NH3 flow through the
catalyst of 3.39 g.min-1. Under these conditions, a
conversion of 62.2 % (N-NH3 into N-NO3
-) was possible and an overall nitrogen balance (N-NH3 +
N-NO3
-) of 86.8 % was achieved and 510 mL of 0.05 mol L-1 H15NO3 solution (90 % in atoms of 15N) per
batch were obtained, starting from 1.8g anhydrous
15
NH3.
ACKNOWLEDGMENT
To the Stable Isotopes Laboratory for technical support during the study, to Fundação de Amparo a Pesquisa do Estado de São Paulo (FAPESP) for funding the research project, to project designer João Geraldo Brancalion, and to Coordenação de Aperfeiçoamento de Pessoal de Nível Superior (CAPES) for granting a scholarship.
REFERENCES
Bendassolli, J. A., Trivelin, P. C. O., Mortatti, J. and Victoria, R. L., Síntese de NH3 anidra enriquecida
em 15N. Energia Nuclear e Agricultura, 9, No. 2, 66-93 (1988).
Bendassolli, J. A., Trivelin, P. C. O., Boareto, A. E. and Moraes Neto, B. M., Preparo de URAN-15N, com marcação isotópica independente nas fontes N-NO3, N-NH4 e N-NH2, a partir de KNO3-15N e
(NH4)2SO4-15N. Energia Nuclear e Agricultura,
10, No. 1, 55-69 (1989).
Production of N-Enriched Nitric Acid (H NO3) 749
Brazilian Journal of Chemical Engineering Vol. 25, No. 04, pp. 743 - 749, October - December, 2008
potássio enriquecido com 15N. Química Nova, 14, No. 3, 154-156 (1991).
Bendassolli, J. A., Trivelin, P. C. O. and Ignoto, R. F., Produção de amônia anidra de aquamônia enriquecida em 15N a partir de (15NH4)2SO4.
Scientia Agrícola, 59, No. 3, 595-603 (2002).
Cekinski, E., Tecnologia de produção de
fertilizantes. IPT, São Paulo (1990).
Dichi, I., Dichi, J. B., Frenhani, P. B., Corrêa, C. R., Angeleli, A. Y. O., Bicudo, M. H., Man, R., Victória, C. R. and Burini, R. C., Utilização do metabolismo protéico (15N-glicina) na detecção precoce de agravamento da atividade da doença em pacientes portadores de retocolite ulcerativa inespecífica. Arquivos de Gastroenterologia, 35, No. 3, 175-180 (1998).
Fritz, P. and Fontes, J.C., Handbook of environmental isotope geochemistry. Elsevier Science Publishers, Amsterdam, New York (1989).
Knowles, R. and Blackburn, T.H., Nitrogen isotope techniques. AcademicPress, San Diego(1993). Maximo, E., Bendassolli, J. A. and Trivelin, P. C. O.,
Enrichment of 15N by Coupling Three Systems of Ion-Exchange Chromatography Colums. Proceedings of 3th International Conference on Isotope, Vancouver, Canada (2000).
Maximo, E., Bendassolli, J.A., Trivelin, P. C. O., Rossetti, A.L.R.M., Oliveira, C.R. and Prestes, C.V., Produção de sulfato de amônio duplamente marcado com os isótopos estáveis 15N e 34S. Química Nova, 28, No. 2, 211-216 (2005).
Mulvaney, R. L., Mass Spectrometry. In: KNOWLES, R. and BLACKBURN, T.H. (Ed.) Nitrogen Isotope Techniques. Academic Press, San Diego (1993).
Oliveira, C. R., Maximo, E. and Bendassolli, J. A., Amino Acid Synthesis (Alanine 15N). Seventh international symposium on the synthesis and applications of isotopes and isotopically labelled compounds, Dresden,Deutschland (2000). Schelsinger, W. H.,Biogeochemistry: an analysis of
global change. Academic Press, San Diego (1991).
Shreve, R. N. and Brink Jr., J. A., Indústria de processos químicos. Guanabara Dois, Rio de Janeiro (1977).
Swaddle, T. W., Inorganic chemistry and industrial and environmental perspective. Academic Press, San Diego (1997).
Tageder, F. and Mayer, L., Métodos de la industria química. Editora Reverté S.A, Barcelona (1980). Tavares, C.R.O., Síntese do glifosato marcado com
nitrogênio-15. Doctoral Thesis, Universidade de São Paulo, São Paulo (2005).
Tavares, C. R. O., Bendassolli, J. A., Coelho, F., Sant’Ana Filho, C. R. and Prestes, C. V., 15N-labed glycine synthesis. Anais da Academia Brasileira de Ciências, 78, No. 3, 1-9 (2006). Trivelin, P. C. O., Matsui, E. and Salati, E., Preparo
de amostras para análise de 15N por
espectrometria de massa. Energia Nuclear na Agricultura, p. 01-41 (1973).
Trivelin, P. C. O., Oliveira, M. W., Vitti, A. C., Gava, G. J. C. and Bendassolli, J. A., Perdas de nitrogênio da uréia no sistema solo-planta em dois ciclos de cana-de- açúcar. Pesquisa Agropecuária Brasileira, 37, No. 2, 193-201 (2002).
Weast, R. C., Handbook of chemistry and physics.