*e-mail: [email protected]
Cu(II) Adsorption on Modified Bentonitic Clays: Different Isotherm
Behaviors in Static and Dynamic Systems
Ambrósio Florêncio de Almeida Netoa*, Melissa Gurgel Adeodato Vieirab,
Meuris Gurgel Carlos da Silvaa
aDepartment of Thermofluidynamics, School of Chemical Engineering, State University of Campinas – UNICAMP, Av. Albert Einstein, 500, Cidade Universitária “Zeferino Vaz”, CEP 13083-852, Campinas, SP, Brazil bDepartment of Chemical Processes, State University of Campinas – UNICAMP,
Av. Albert Einstein, 500, Cidade Universitária “Zeferino Vaz”, CEP 13083-852, Campinas, SP, Brazil
Received: July 26, 2011; Revised: September 16, 2011
Cu (II) removal equilibrium from aqueous solutions using calcined clays “Bofe” and “Verde-lodo” has been studied by batch and fixed-bed in static and dynamic systems, respectively. Analyses were performed for physicochemical characterization of clays using the techniques: X-ray fluorescence (XRF), thermogravimetry (TG), N2 adsorption (BET) and Cationic Exchange Capacity (CEC). Batch experiments were performed at a constant temperature, adjusting the pH of the solution in contact with clays. Adsorption assays in fixed bed were conducted at the flow rate determined through mass transfer zone (MTZ). Langmuir and Freundlich models were adjusted to equilibrium data. The results of characterization indicated that the temperature of 500 °C is best suited for the calcination of the clays. The maximum adsorption capacity was higher for dynamic system than fixed bed compared to static system, enhancing from 0.0748 to 0.1371 and from 0.0599 to 0.22 mmol.g-1 of clay for “Bofe”
and “Verde-lodo”, respectively.
Keywords: adsorption, heavy metal removal, bentonitic clay
1. Introduction
Clays and minerals such as montmorillonite, vermiculite, illite, kaolinite and bentonite are known as alternative materials used to adsorption of heavy metal due to several economic advantages1-9 and their intrinsic properties, such as
large specific surface area, excellent physical and chemical stability and properties structural and surface10. Other
low-cost adsorbents have been investigated, mainly using bioadsorbents, such as algae11 and chitosan12. However,
experiments carried out in fixed bed presented limited results. Bentonite clays are widely used as barriers to avoid subsoil and underground landfill water contamination by leaching containing heavy metals.
Although the results obtained in metal removal using clays are significant and promising, a better understanding of these results is still needed. Studies already performed on Brazilian calcined clay (Bofe type) in the removal of nickel13,14 have shown the need for further research on
heavy metal removal comparing adsorption capacity in both static and dynamic systems. The high load of galvanic toxic waste in the Southeast of Brazil is composed mainly of salts of cyanide and heavy metals such as copper, among others; these can be present in soluble and insoluble forms. Therefore, research on the mechanisms of removal of copper are required for remediation of this contaminant.
In order to evaluate the removal of copper using Bofe and Verde-Lodo (VL) bentonite clays as adsorbents thermally modified, the adsorption experiments were conducted using static (batch) and dynamic systems (fixed-bed). Both clays have been chosen due to their relevant adsorptive properties13
and abundance in the Brazil. Modified clays have shown enhanced adsorption capacity.
2. Experimental
2.1.
Adsorbents
2.2.
Metal adsorbate
The adsorption tests were performed using an aqueous solution in 15.74 mmol.L-1 of copper metal, prepared
dissolving appropriate amount of Cu(NO3)2·3H2O in deionized water to desired concentrations.
The Cu(II) solution pH was maintained at a level lower, minimizing the precipitation in to assure the occurrence of the adsorption process and avoiding the chemical precipitation of copper ions in the hydroxide form (Cu(OH)2). The pH of the solutions was measured with pH-meters and it was kept at set values using nitric acid and ammonium hydroxide.
2.3.
Metal speciation
Copper speciation diagrams were simulated using Hydra and Medusa softwares15 to identify the different species in
solution. Speciation was investigated considering the used stoichiometric ratio of copper salt.
2.4.
Clay characterization
The chemical composition of raw and calcined samples of Bofe and VL clays were obtained by X-ray fluorescence analysis, using samples fused in borate matrix.
Thermogravimetric analysis was carried out on a Micromeritics TGA in N2 atmosphere (50 mL/min) at a heating rate of 10 °C/min. The samples were putted in platinum pans and scanned from room temperature to 1000 °C.
The surface area was obtained by N2 physisorption at 77 K using the BET method.
The Cation Exchange Capacity (CEC) was determined in triplicate for raw and calcined samples of Bofe and VL clays. The ions concentration of Na+ displaced by the
NH4OH exchange solutions were measured by Atomic Absorption and expressed in meq (100 g)-1 of solid according
to Equation 1:
4 CEC 10 Na NH C V m f +⋅ + =
⋅ ⋅ (1)
The zero-point load of solid elements in suspension (pHzpc) was obtained using the potentiometrical titration methodology16. The titration was carried out with 0.5 M
CH3COOH and 0.5 M NH4OH. For each point of the titration, was obtained by Equation 2:
[ ] [ ]
a b
m
C C OH H
S F
A C
− +
− + −
= ⋅
⋅ (2)
For CH3COOH or NH4OH addition, S can be expressed as either by Equations 3 and 4:
[ ] a m C H S F A C + − = ⋅
⋅ (3)
[ ] b
m OH C S F A C − − = ⋅
⋅ (4)
2.5.
Batch sorption procedure
The adsorption experiments were performed using an aqueous solution of Cu(NO3)2.3H2O in fixed concentrations, with temperature controlled under constant stirring of 150 rpm. At specific time intervals, solution aliquots were removed and centrifuged. The supernatant liquid was diluted and it concentration was determined by atomic absorption spectrometry.
To evaluate the effect of contact time, the experiments were conducted using 1 g of clay per 100 mL of copper solution at 1.57 mmol.L-1 concentration. Temperature and
pH were kept at 298 K and 5.0, respectively. The samples were shaken for 300 minutes.
Equilibrium tests were performed with different concentrations of adsorbate and temperatures. For maintaining pH of the medium, solutions of 0.01 M HNO3 or 0.01 M NH4(OH) were added to adjust the pH value. The pH was monitored before and after adsorption. The following conditions were maintained for the different sets of experiments:
i) Effects of adsorbate concentration and adsorption isotherm: clay 1 g/100 mL.
ii) Thermodynamics: clay 1 g/100 mL, time 300 minutes, pH 5.0, temperature 273, 298, 323 and 348 K. Langmuir’s theoretical model17 (Equation 5) and
Freundlich’s empirical model18 (Equation 6) were adjusted
to the adsorption isotherms.
1
m eq
eq
eq
q b C
q
b C
⋅ ⋅ =
+ ⋅ (5)
( )n
eq f eq
q = K ⋅C (6)
The adsorbed amount was obtained by Equation 7:
( i f)
V C C
q m
−
= (7)
The essential characteristics of the Langmuir isotherm can be expressed by the separation factor or equilibrium parameter (RL) given by Equation 8:
0 1 1 L R b C =
+ ⋅ (8)
The parameter RL indicates the curvature of the sorption isotherm: if RL > 1, the isotherm is not favorable; if RL = 1, linear behavior; 0 < RL < 1, favorable; RL = 0, irreversible.
The thermodynamic parameters for the adsorption process ∆H (kJ.mol-1), ∆S (J(K.mol)-1) and ∆G (kJ.mol-1)
were evaluated using thermodynamic Equations 9 and 10:
(
)
ln d
G RT K
∆ = − (9)
ln(Kd) G S H
RT R RT
∆ ∆ ∆
= − = − (10)
2.6.
Column sorption procedure
Adsorption experiments were performed in a porous bed system, consisting of an acrylic column, with 14 cm of height and 1.4 cm of internal diameter. The operating conditions were based on the experimental design, considering the study conducted in batch and preliminary fixed-bed tests.
In order to determine the mass transfer zone, the amount of useful and total removal were calculated, which correspond to the capacity of metal removal until the breakthrough point (qU) and saturation point (qT), respectively. Equations 11 and 12 were obtained through the mass balance in the column using saturation data, based on its breakthrough curves, where the area below the curve (1−C/C0) until the breakthrough point is proportional to
qU, and area until the bed exhaustion is proportional to qT:
0 0 0 1 1000 b t z L U C C Q q dt m C = ⋅ = −
⋅ ∫ (11)
0 0 0 1 1000 tot t z L T C C Q q dt m C = ⋅ = −
⋅ ∫ (12)
MTZ can then be calculated based on the qU/qT ratio according to Equation 13.
1 U L T q MTZ H q = ⋅ −
(13)
MTZ has a maximum value which corresponds to the bed height (HL) and when the efficacy of mass transference increases. This value decreases until reaching the ideal condition, where MTZ is zero and the breakthrough curve is a step function.
The percentage of total removal (%RT) during adsorption was obtained considering the metal fraction in solution retained in the adsorbent solid, from total effluent used in the adsorption process until bed saturation. The amount of adsorbed metal is calculated by considering the area of the curve (1−C/C0) vs. t19 using Origin version 6.0
software.
3. Results and Discussion
3.1.
Bofe and VL clays characterization
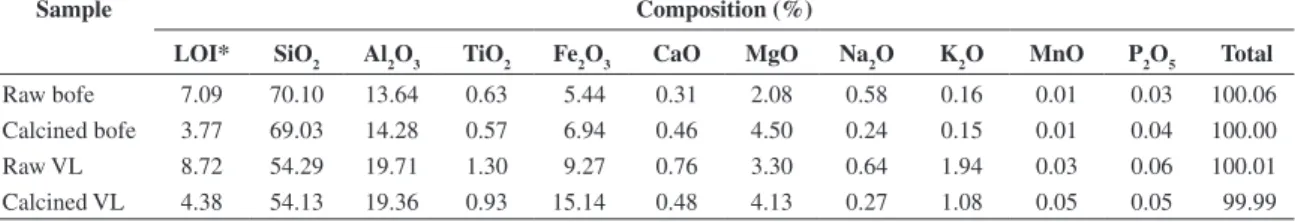
The chemical composition of the compounds raw and calcined of the Bofe and VL clays obtained by XRF are shown in Table 1. The average composition is consistent with the expected for this bentonite clay20. One can observe
that the Bofe and VL clays are a polycationic bentonite due to the presence of Ca2+, Mg2+ and Na+ cations in both raw
and calcined clay samples.
Cationic capacity result exchanges (CEC) of raw and calcined clays and superficial respective areas obtained by BET are shown in the Table 2.
Smectite clays from Paraíba generally present CEC values between 50 e 90 meq (100 g)-1 of clay20. Relatively
high CEC values of raw clays indicated that they have a high isomorphic replacement level. On the other hand, calcined smectites at 500 °C have their exchange cation capacity drastically reduced in comparation to raw CEC clays. The high value of CEC with respect to the raw clays indicates that the minerals have a high level of isomorphic substitutions. In addition, the smectite calcined at 500 °C has a lower ability to exchange cations in relation to the raw clay.
The values obtained to surface area by the BET method for raw and calcined Bofe clays were of 78.61 and 90.31 m2.g-1,
respectively, whereas for samples of VL clays the values were of 64.31 and 62.08 m2.g-1, in the same order.
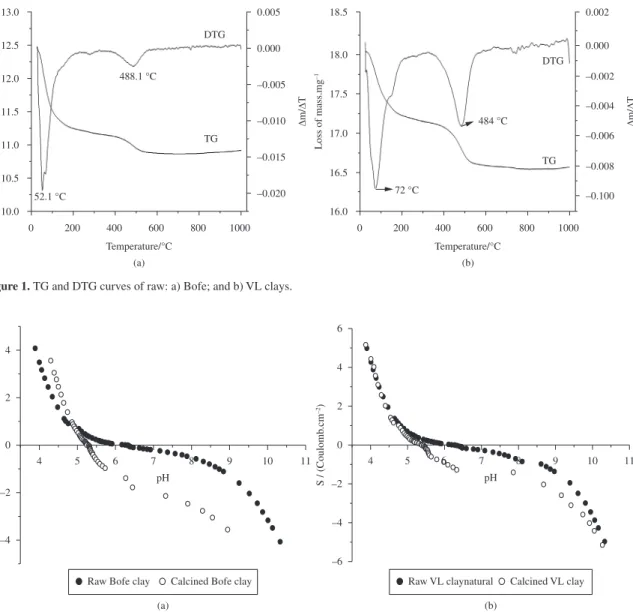
Figure 1 shows TG and DTG curves for raw Bofe and VL clays.The DTG curve presents two peaks of mass loss. The first, between 50-105 °C refers to the loss of water, volatile compounds, microorganisms and organic material; these elements do not change clay structure.Mass losses occurred for two temperatures and correspond to 4.82 and 3.57% of mass. The second peak occurring between 450-500 °C shows the loss of hydroxyl, which starts to change the clay structure. Hydroxyl loss is interesting for the process, because it prevents the chemical precipitation of copper by alkalinity and it increases the clay stability for its application in fixed-bed adsorption columns.
According to Figure 2, the pHZPC values obtained for raw and calcined clays were of 6.1 and 5.4, respectively. Thus, in order to ensure that the calcined clay surface has a null or negative charge with the aim of making more favorable the adsorption of charged positively metal ions, the adsorbate solution pH should be kept in 5.5.
Table 1. Chemical clay for Bofe and VL analyses.
Sample Composition (%)
LOI* SiO2 Al2O3 TiO2 Fe2O3 CaO MgO Na2O K2O MnO P2O5 Total
Raw bofe 7.09 70.10 13.64 0.63 5.44 0.31 2.08 0.58 0.16 0.01 0.03 100.06 Calcined bofe 3.77 69.03 14.28 0.57 6.94 0.46 4.50 0.24 0.15 0.01 0.04 100.00 Raw VL 8.72 54.29 19.71 1.30 9.27 0.76 3.30 0.64 1.94 0.03 0.06 100.01 Calcined VL 4.38 54.13 19.36 0.93 15.14 0.48 4.13 0.27 1.08 0.05 0.05 99.99
*Loss on ignition.
Table 2. Cationic clay exchange capacity (CEC) and surface area.
Sample CEC
(meq (100 g)-1)
Surface area (m2.g-1)
3.2.
Copper speciation
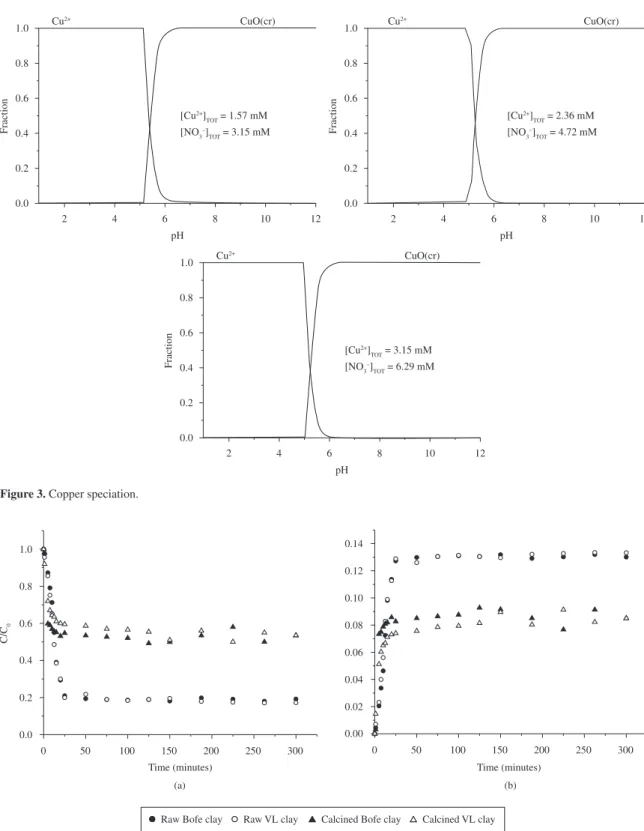
The Figure 3 shows the speciation curve of the Cu2+
ion in aqueous solution with nitrate ions at different concentrations determined through the HYDRA application. In the pH range of 4.8-5.3, the fraction of Cu2+ ions in
aqueous solution decreases and beginning the formation of copper oxide, which is precipitates. With the purpose that only the adsorption occurs, should be used a pH value below minimum precipitation, which corresponds to 5.0 for concentration of 1.57 mmol.L-1.
3.3.
Batch adsorption
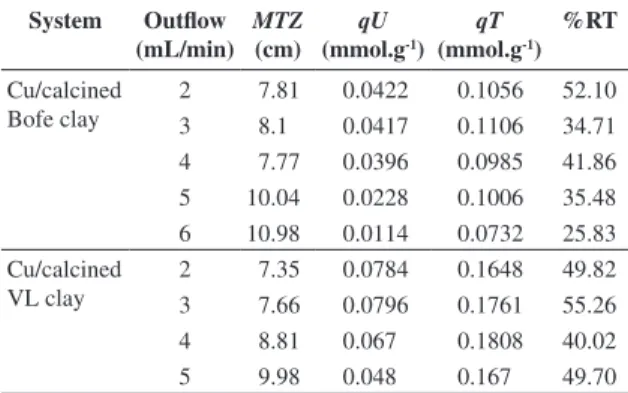
Figure 4a and b present the curve for copper adsorption kinetics on Bofe and VL clays. The adsorption of copper ions into pores of clays occurred rapidly at the first moments of the process, remaining at equilibrium over time. The reduction of the initial concentration of the ion, under the condition of this study, was around 81% in both raw clays and around 42% in both calcined clays. The maximum
adsorbed amount was around 0.13 and 0.08 mmol of copper g-1 of clay for raw and calcined clays, respectively.
Through kinetic studies at static system, it is verified that removal capacity is reduced by clay calcinations. However, in preliminary tests, raw clays could not be applied in fixed bed due to their mechanical instability. When the raw clays were in contact with copper salt solutions, the clay adsorbed a great quantity of water, expanding the volume bed due to their blade defoliation, which are dissolved and dispersed along the flow, being the clay dragged down through the column when the flow is ascendant. At a descendent flow use, a bed waterproofing was also observed.
On the other hand, clays also get steel hardness at temperatures above 180 °C20. This fact, associated with
Bofe13 and VL clay characterization results, suggest that
the calcination provides to the materials mechanical stabilization (not dissolving), getting that these do not expand or being waterproof in porous column. Therefore, the calcined Bofe and VL clays are more appropriated to be used as adsorbent for copper removal in fixed bed.
Figure 1. TG and DTG curves of raw: a) Bofe; and b) VL clays.
3.4.
Dynamic adsorption
Dynamic adsorption experiments were carried out for different flow rates, varying values from 2.0 to 6.0 mL/min for Bofe and from 2.0 to 5.0 mL/min for VL clay (Figure 5). The definition of appropriate flow rate was based on mass
transfer zone determination. The concentration values of copper adsorbate solution were 2.36 and 1.57 mmol.L-1
for adsorption on Bofe and VL clays, respectively. The breakthrough curves present distinct behaviors indicating the flow influence on diffusional resistances. The adsorption process presents strong resistance to bed saturation for the
Figure 3. Copper speciation.
Figure 4. Kinetic for copper adsorption on clays. a) Dimensionless solution concentration as a function of time, and b) Adsorbed amount
at equilibrium (C0 = 1.57 mmol L-1, d
total flow range studied, it was known by the more extended breakthrough curves and broader mass transfer zones.
Table 3 shows the valuesofMTZ, qU, qT and copper removal percentage on calcined clays. The least MTZ value (7.77 cm), as well as satisfactory values of amount of useful (qU) and total removal (qT) and total removal percentage was obtained at 4.0 mL/min for copper adsorption on calcined Bofe clay. For copper adsorption on calcined VL clay, the least MTZ value (7.35 cm) was obtained at 2.0 mL/min, but the breakthrough curve showed high resistance of saturation. Then, the most appropriate flow value for conducting the copper adsorption on calcined VL clay assays was 3.0 mL/min.
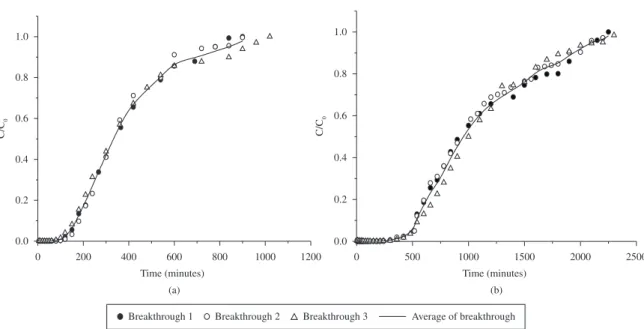
The reproducibility of adsorption experiments can be seen in Figure 6, which shows breakthrough curves resulting from three performed tests at 4.0 and 3.0 mL/min for copper removal on calcined Bofe and VL clays, respectively. These results confirms the good reproducibility of the experimental, with a 0.34 and 0.33% average deviation for copper adsorption on calcined clays Bofe and VL, respectively. The variation curves are basically due to the axial bed dispersion and this phenomenon was not considered in the study.
3.5.
Adsorption isotherms
The amount adsorbed of metal ions per mass unit of clay (qeq) gradually increases as the initial concentration of the adsorbate solution increases, in both systems (batch and fixed bed). When the initial solution has a low concentration, the ratio between the number of ions and the number of adsorptive sites available is small; consequently, adsorption depends on the initial concentration. Therefore, as the concentration of ions increases, adsorption also increases. In high concentrations of ion, each unit mass of adsorbent is subjected to a larger number of ions, which depending on
the system can present different behaviors, as can be seen in Figure 7. The Langmuir and Freundlich models were adjusted to experimental data through the Gauss-Newton nonlinear estimation method in the Statistic 7.0 for Windows® software. The regression coefficients for both
adjustments are shown in Table 4. The obtained parameters expressed by Equations 6 and 7 were associated with the process temperature.
Analyzing Figure 7 and Table 4, it can be seen that Langmuir model simulated adequately the experimental adsorption isotherm data for Bofe clay in batch and for VL clay in fixed bed system, while Freundlich empiric model described more efficiently the adsorption isotherm data for Bofe clay in fixed bed and for VL clay in batch system.
From the adsorption isotherms data, the maximum adsorbed capacities obtained in fixed bed system for both clays is higher than the results got in batch, which means that copper adsorption on Bofe and VL clays is related to
Figure 5. Breakthrough curves for: a) Cu2+/Bofe calcined clay (C
0 = 2.36 mmol.L -1, d
p = 0.855 mm), and b) Cu
2+/VL calcined clay (C0 = 1.57 mmol.L-1, d
p = 0.855 mm).
Table 3. Values for MTZ, qU, qT and %RT for copper adsorption
on calcined Bofe and VL clays.
System Outflow
(mL/min) MTZ (cm)
qU
(mmol.g-1)
qT
(mmol.g-1)
%RT
Cu/calcined Bofe clay
2 7.81 0.0422 0.1056 52.10 3 8.1 0.0417 0.1106 34.71 4 7.77 0.0396 0.0985 41.86 5 10.04 0.0228 0.1006 35.48 6 10.98 0.0114 0.0732 25.83 Cu/calcined
VL clay
Figure 6. Reproducibility of breakthrough curves for copper adsorption on calcined clays: a) Bofe, and b) VL (C0 = 1.57 mmol.L -1, dp = 0.855 mm).
Figure 7. Adsorption isotherms for copper removal on: a) calcined Bofe clay, and b) calcined VL clay, adjusted to the models Langmuir
and Freudlich.
Table 4. Langmuir and Freundlich parameters for Cu2+ adsorption on Bofe and VL clays.
System Langmuir Freundlich
qm(mmol.g–1) b (L.g–1) R2 a n R2
Cu/calcined Bofe/batch 0.0748 16.7868 0.9725 0.0752 0.3015 0.9259
Cu/calcined Bofe/fixed bed 0.1371 4.4815 0.9478 0.1111 0.3877 0.922
Cu/calcined VL/batch 0.0599 18.198 0.9288 0.0611 0.3009 0.9378
the mobility of the particles. This behavior indicates that at higher concentrations of metal solution in batch occurred a formation of the electrical double layer, i. e., ions of the Stern layer and part of the diffuse layer. They form an ionic cloud around the particle, being attracted by the electric potential, which moves along with it during the flow of the suspension21. As a result, the particles start to behave as flow
units of higher dimensions, whose radius is defined as the hydrodynamic radius of the particle, which decreases the maximum adsorbed capacity of copper on calcined clays. However, this behavior is not observed in Henry’s infinite dilution region, that is, at very low concentrations.
The Langmuir isotherm is specific for monolayer adsorption, which was the case in this study, while the Freundlich model is better applied to adsorption at heterogeneous sites on the surface of a solid, with a mechanism that has not yet been established. The Langmuir equilibrium coefficient b determines the direction to which the equilibrium adsorbate–adsorbent clay (solid phase) + Cu(II) (aqueous phase) = clay−Cu(II) moves. Higher values indicate that the equilibrium moves to the right side, with the resulting formation of the adsorbate–adsorbent complex.
The values obtained for the Freundlich constant (n) are around 0.3 and 0.4 for adsorption in batch and in fixed bed, respectively. According to Treybal,22 this range indicates
that the adsorptive characteristics of the clay are suitable for copper sorption.
The values calculated for RL (Equation 8) determined by using the Langmuir constant obtained by the nonlinear
method vs. the initial copper concentration for different systems were of 0.3076 (Cu/calcined Bofe/Batch), 0.6995 (Cu/calcined Bofe/fixed bed), 0.2907 (Cu/calcined VL/ Batch) and 0.7682 (Cu/calcined VL/fixed bed). According to the separation values, both adsorption systems can be considered favorable to copper sorption (0 < RL < 1), being more favorable to sorption conducted in batch.
3.6.
Adsorption thermodynamics
Thermodynamic data were obtained through the static method in thermostatic finite bath under constant stirring for four different temperatures (273, 298, 323 and 348 K) and correlated by the Langmuir and Freundlich isotherms. The Figure 8 shows the adsorption isotherms for 1 g clay/100 mL adsorbate solution adjusted by the Langmuir and Freundlich models, at initial copper concentrations ranging from 0.08 to 2.36 mmol.L-1.
The thermodynamic parameters ∆H, ∆S and ∆G (Equations 9 and 10) presented in Table 5 were obtained from Figure 9. The negative ∆H indicates that the process is exothermal, confirming the adsorption theory for copper adsorption on calcined VL clay. The magnitude of the enthalpy variation achieved (+24.8 kJ.mol-1) for copper
adsorption on calcined Bofe clay showed that it is an endothermic processes.
A decrease in entropy during adsorption helps the stabilization of the metal-clay complex formed (∆S < 0).
∆S values suggest a decrease in randomness at the solid/ solution interface during copper sorption on calcined VL
Table 5. Thermodynamic parameters of adsorption.
System ∆H
(kJ.mol-1)
∆S
(J(mol.K)-1)
∆G (kJ.mol-1)
273 K Troom 323 K 348 K
Cu/calcined Bofe +24.8 +151.5 -16.6 -20.3 -24.1 -27.9
Cu/calcined VL -4.81 +53.7 -19.5 -20.8 -22.2 -23.5
Troom: 298 K for Cu/calcined Bofe and 297 K Cu/calcined VL clays.
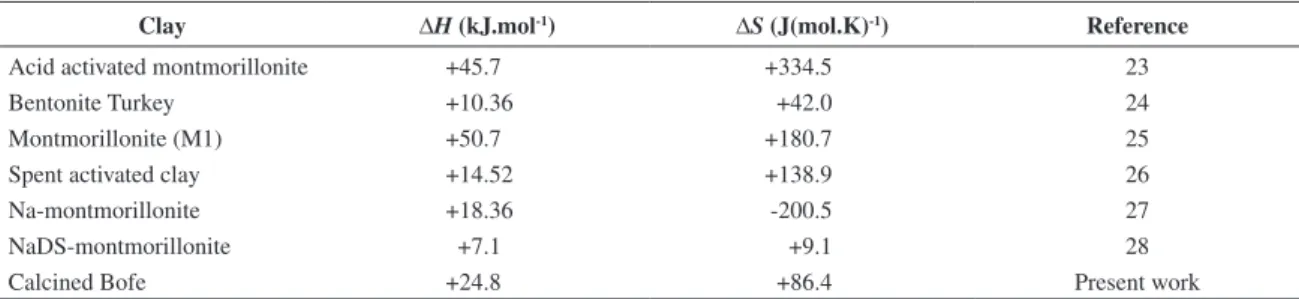
Table 6. Thermodynamic parameters data for Cu(II) in different clays.
Clay ∆H (kJ.mol-1) ∆S (J(mol.K)-1) Reference
Acid activated montmorillonite +45.7 +334.5 23
Bentonite Turkey +10.36 +42.0 24
Montmorillonite (M1) +50.7 +180.7 25
Spent activated clay +14.52 +138.9 26
Na-montmorillonite +18.36 -200.5 27
NaDS-montmorillonite +7.1 +9.1 28
Calcined Bofe +24.8 +86.4 Present work
Figure 9. Adsorbate distribution coefficient as function of
temperature.
clay compared with Bofe clay. The clays–Cu interactions occurred spontaneously and were accompanied by a decrease in Gibbs free energy (∆G < 0). The degree of spontaneity was found to decline as the process temperature rose, ranging from −16.6 to −27.9 kJ.mol-1 for the
temperature range between 273 and 348 K. Adsorption and ion exchange of Cu(II) on different clays had already been reported as endothermic23-28, as shown in Table 6. It was
likely that adsorption of Cu(II) ions on clay surface require an activation energy and rise in temperature helped more Cu(II) ions to overcome this energy barrier and get attached to the surface23.
4. Conclusions
The chemical composition of clays was not modified by calcination, but the Cation Exchange Capacity (CEC) was reduced. Adsorption results indicated that the sorption kinetics of copper ions by clays is rapid, requiring a minimum 60 minutes to reach equilibrium. The study of mass transfer parameters, as well as the breakthrough curves showed that the better appropriate operating outflow rate values, i.e. which minimizes the diffusional resistances in the bed for removal of copper by Bofe and VL calcined clays were of 4 and 3 mL/min, respectively. The breakthrough curves demonstrated that increasing the outflow rate, the breaking point, the point of saturation throughput and total removal values tend to decrease. The Langmuir isotherm model correctly represents the equilibrium data obtained from experiments in bath and in fixed bed at room temperature. At low concentrations, the removal of copper has a linear equilibrium and it does not depend on the system applied (static or dynamic). Calcination produced hydroxyl loss, preventing chemical precipitation of copper by alkalinity. The adsorption capacity (qm) increased in fixed bed, which suggests that copper adsorption on calcined Bofe and VL clays is related to the mobility of the particles. Copper adsorption on calcined VL clay is exothermic whereas on Bofe clay is endothermic. The clay-Cu interactions occurred spontaneously, being followed by a decrease in Gibbs free energy.
Acknowledgements
The authors acknowledge and thank the financial support received from CNPq and Foundation for Research Support of Sao Paulo State, FAPESP, for this research.
References
1. Ghorbel-Abid I, Galai K and Trabelsi-Ayadi M. Retention of chromium (III) and cadmium (II) from aqueous solution by illitic clay as a low-cost adsorbent. Desalination. 2010; 256:190-195. http://dx.doi.org/10.1016/j.desal.2009.06.079
2. Praus P, Turicováa M and Valáškováb M. Study of silver adsorption on montmorillonite. Journal of the Brazilian Chemical Society. 2008; 19:549-556. http://dx.doi.org/10.1590/ S0103-50532008000300025
3. Sajidu SMI, Persson I, Masamba WRL and Henry EMT. Mechanisms of heavy metal sorption on alkaline clays from Tundulu in Malawi as determined by EXAFS. Journal of Hazardous Materials. 2008; 158:401-409. PMid:18329799. http://dx.doi.org/10.1016/j.jhazmat.2008.01.087
Engineering Journal. 2008; 137:436-442. http://dx.doi. org/10.1016/j.cej.2007.06.003
5. Kubilay S, Gürkan R, Savran A and Sahan T. Removal of Cu(II), Zn(II) and Co(II) ions from aqueous solutions by adsorption onto natural bentonite. Adsorption. 2007; 13:41-51. http://dx.doi.org/10.1007/s10450-007-9003-y
6. Stathi P, Litina K, Gournis D, Giannopoulos TS and Deligiannakis Y. Physicochemical study of novel organoclays as heavy metal ion adsorbents for environmental remediation. Journal of Colloid and Interface Science. 2007; 316:298-309. PMid:17804008. http://dx.doi.org/10.1016/j.jcis.2007.07.078
7. Ouhadi VR, Yong RN and Sedighi M. Desorption response and degradation of buffering capability of bentonite, subjected to heavy metal contaminants. Engineering Geology. 2006; 85:102-110. http://dx.doi.org/10.1016/j.enggeo.2005.09.031
8. Brigatti MF, Colonna S, Malferrari D, Medici L and Poppi L. Mercury adsorption by montmorillonite and vermiculite: a combined XRD, TG-MS, and EXAFS study. Applied Clay Science. 2005; 28:1-8. http://dx.doi.org/10.1016/j. clay.2004.03.006
9. Bailey SE, Olin TJ, Bricka M and Adrian D. A review of potentially low-cost sorbents for heavy metals. Water Research. 1999; 33(11):2469 2479.
10. Chen WJ, Hsiao LC and Chen KKY. Metal desorption from copper(II)/nickel(II)-spiked kaolin as a soil component using plant-derived saponin biosurfactant. Process Biocheistry. 2008; 43:488-498. http://dx.doi.org/10.1016/j.procbio.2007.11.017 11. Kleinübing SJ, Vieira RS, Beppu MM, Guibal E and Silva
MGC. Characterization and evaluation of copper and nickel biosorption on acidic algae Sargassum Filipendula. Materials Research. 2010; 13:541-550. http://dx.doi.org/10.1590/S1516-14392010000400018
12. Meneghetti E, Baroni P, Vieira RS, Silva MGC and Beppu MM. Dynamic adsorption of chromium ions onto natural and crosslinked chitosan membranes for wastewater treatment. Materials Research. 2010; 13:89-94. http://dx.doi.org/10.1590/ S1516-14392010000100018
13. Vieira MGA, Almeida Neto AF, Gimenes ML and Silva MGC. Removal of nickel on Bofe bentonite calcined clay in porous bed. Journal of Hazardous Materials. 2010; 176:109-118. PMid:20022694. http://dx.doi.org/10.1016/j. jhazmat.2009.10.128
14. Vieira MGA, Almeida Neto AF, Gimenes ML and Silva MGC. Sorption kinetics and equilibrium for the removal of nickel ions from aqueous phase on calcined Bofe bentonite clay. Journal of Hazardous Materials. 2010; 177:362-371. PMid:20042281. http://dx.doi.org/10.1016/j.jhazmat.2009.12.040
15. Puigdomenech I. Hydra and Medusa Programs. Sweden: Royal Institute of Technology; 2004.
16. Davranche M, Lacour S, Bordas F and Bollinger JC. An Easy Determination of the Surface Chemical Properties of Simple and Natural Solids. Journal of Chemical Education. 2003; 80:76-78. http://dx.doi.org/10.1021/ed080p76
17. Langmuir I. The adsorption of gases on plane surfaces of glass, mica and platinum. Journal of the American Chemical Society. 1918; 40:1361-1403. http://dx.doi.org/10.1021/ja02242a004
18. Freundlich HMF. Uber die adsorption in lasugen. Zeitschrift fur Physikalische Chemie (Leipzig). 1906; 57A:385-470.
19. Volesky B, Weber J and Park JM. Continuous-flow metal biosorption in a regenerable Sargassum column. Water Research. 2003; 37:297-306. http://dx.doi.org/10.1016/S0043-1354(02)00282-8
20. Santos PS. Ciência e tecnologia de argilas. São Paulo: Edgard Blücher Ltda; 1992.
21. Zeta-Meter Inc. Zeta-Potential: A Complete Course in 5 Minutes. Staunton: Zeta-Meter, Inc.; 1997.
22. Treybal RE. Mass Transfer Operations. New York: McGraw Hill; 1980.
23. Bhattacharyya KG and Gupta SS. Removal of Cu(II) by natural and acid-activated clays: An insight of adsorption isotherm, kinetic and thermodynamics. Desalination. 2011; 272:66-75. http://dx.doi.org/10.1016/j.desal.2011.01.001
24. Eren E and Asfin B. An investigation of Cu(II) adsorption by raw and acid-activated bentonite: A combined potentiometric, thermodynamic, XRD, IR, DTA study. Journal of Hazardous Materials. 2008; 151:682-691. PMid:17644249. http://dx.doi. org/10.1016/j.jhazmat.2007.06.040
25. Bhattacharyya KG and Gupta SS. Adsorptive accumulation of Cd(II), Co(II), Cu(II), Pb(II), and Ni(II) from water on montmorillonite: Influence of acid activation. Journal of Colloid and Interface Science. 2007; 310:411-424. PMid:17368467. http://dx.doi.org/10.1016/j.jcis.2007.01.080
26. Weng C-H, Tsai C-Z, Chu S-H and Sharma YC. Adsorption characteristics of copper(II) onto spent activated clay. Separation and Purification Technology. 2007; 54:187-197. http://dx.doi.org/10.1016/j.seppur.2006.09.009
27. Lin S-H and Juang R-S. Heavy metal removal from water by sorption using surfactant-modified montmorillonite. Journal of Hazardous Materials. 2002; 92:315-326. http://dx.doi. org/10.1016/S0304-3894(02)00026-2
Appendix 1. Abbreviations.
A specific surface area (g.m-2)
b, qm are Langmuir coefficients representing the equilibrium constant for the adsorbate–adsorbent
equilibrium and the maximum adsorbed amount on the monolayer C0 initial concentration of the metal in the liquid phase (mmol.L-1)
Ca, Cb concentration of acid and base added, respectively (mol.L-1)
Ceq (mmol.L
-1) and q
eq (mmol.g
-1) concentration of metal ions in the liquid and solid phases, respectively
Ci, Cf the initial and final concentration of metal ion, respectively (mmol.L
-1)
Cm represent the solid content (g.L
-1)
CNa
+ ion concentration Na+ measured by atomic adsorption (mg.L-1)
VNH4+ volume of ammonium acetate 3M (mL)
f conversion factor of sodium to equivalents F Faradays constant (96,485.3399 Coulomb mol-1)
Kd adsorbate distribution coefficient (qeq/Ceq em L.g-1)
Kf, n Freundlich coefficients
m mass of adsorbent (g)
q the adsorbed mass of metal ion per gram of adsorbent (mmol.g-1)
R universal gas constant (8.314×10⁻³ kJ (K.mol)-1)
T temperature (K)