Structure and Physical Properties of the LaBiFe
2O
6Perovskite Produced by the Modiied
Pechini Method
Johny Andrés Jaramillo Palacioa, Elixir William Barrera Belloa,b, Julián Andrés Munévar Cagigasc,
Oscar Arnached, David A. Landínez-Télleza, Jairo Roa-Rojasa*
Received: March 16, 2017; Revised: March 22, 2017; Accepted: July 03, 2017
In this paper the synthesis of the LaBiFe2O6 material by the modiied Pechini method is reported. Structural, morphologic, magnetic and optic experimental studies were performed. Rietveld reinement of x-ray difraction patterns revealed that LaBiFe2O6 crystallizes in an orthorhombic perovskite
structure (space group Pnma, # 62). Scanning electron microscopy images showed the nanometric
feature of grains. X-ray dispersive spectroscopy permitted to infer the obtaining of the LaBiFe2O6
expected stoichiometry. Results of magnetic susceptibility as a function of temperature and ield
magnetization evidenced mixed ferromagnetism and superparamagnetism behavior at T=300 K.
Mössbauer spectroscopy supported the superparamagnetic and ferromagnetic responses as a result of the nanogranular morphology and anisotropy efects. Spectrum of difuse relectance suggest that
this material behaves as a semiconductor with energy gap Eg=2.13 eV.
Keywords: Modiied Pechini method, double perovskite, ferromagnetic, semiconductor
* e-mail: [email protected]
1. Introduction
The Pechini method for the synthesis of materials is a relatively new technique that, at irst, was implemented for deposition of ilms base on lead and alkaline earth titanates and niobates applied to the technology of dielectrics and capacitors1. In the last years this method has enabled synthesis BaTiO3 nanopowders2 and other perovskite-like materials3.
The biggest advantage of this method lies in its simplicity and in the almost completely independence of the process conditions of the chemistry of positive ions contained in the inal material and a low sintering temperature, resulting in obtaining powders oxides formed by nanometer sized crystals. On the other hand, this method includes some disadvantages such as the use of glycol toxic ethylene and signiicant volumes of organic reagents of the product, lack of complexes stable citrus elements such as bismuth, as well as partial or complete regeneration of certain components during pyrolysis of polymer gel, such as copper and ruthenium, among others. In order to solve some of the disadvantages of this method in the synthesis of lanthanide oxides, recently it has been
applied the so-called modiied Pechini method, by which it
has achieved a further reduction in the size of the obtained
crystals4. This method can be applied in the processes of
synthesis of simple perovskites based on lanthanum, with
crystallographic single phase, in nanometric size grains strongly coupled to form lamellar structures ranging from
sizes with tens of nanometers up to several micrometers5.
So far, there are very few reports of double perovskites
produced through this technique6-7. Double perovskites are
materials extensively studied due to the potential that their
generic formula AA’MM’O6, where A- and A’-cation, and
M- and M’-cations can be the same or diferent type, provides to modify the structure and, consequently, the physical properties of this family of compounds, by introducing
various elements in sites A and M of that formula8-9. The
novel double perovskite material LaBiFe2O6 has recently
been reported as a possible biferroic with ferromagnetic
and ferroelectric response at room temperature10. The aim
of this work is to study the crystal structure, morphology, composition, and magnetic and optic characterizations of
LaBiFe2O6 perovskite samples produced by applying the
modiied Pechini method, and to analyze the efect of the nanometric size grain on the magnetic and electric properties compare with that published for this materials synthesized by the solid state reaction technique.
2. Experimental
LaBiFe2O6 nanopowder samples were produced by
the modiied Pechini method4. Aldrich La
2O3 (99.99%), aGrupo de Física de Nuevos Materiales, Departamento de Física, Universidad Nacional de Colombia,
AA 5997, Bogotá DC, Colombia
bDepartamento de Ciencias Básicas, Universidad Católica de Colombia, Bogotá DC, Colombia cLaboratory for Muon Spin Spectroscopy, Paul Scherrer Institut, CH-5232, Villigen PSI, Switzerland
Palacio et al.
1310 Materials Research
Bi(NO2)2.5H2O (Aldrich 99.9%) and Fe(NO2)2.9H2O (Aldrich 99.99%) were added separately in hot nitric acid solutions, which was selected as chelating agent (CA). First, the lanthanum oxide was separately mixed with nitric acid and heated up to obtain a clear aqueous solution. This solution was mixed with the Fe and Bi based precursor previously dissolved in water. Then, the nitric acid is added in a 1:1 CA-to-metal molar ratio, and submitted to a strong magnetic stirring for
3 hours. For the polyesteriication process, ethylene glycol was used as esteriication agent (EA). Ethylene-glycol was
added in a 1:2 CA-EA ratio followed by slow evaporation
of water at 373 K for 15 hours in constant magnetic stirring. The organic precursor was annealed in two steps, irst at 573 K for 3 h and second at 1023 K for 1 h to obtain nanopowder with perovskite structure. The determination of the crystal structure of the LaBiFe2O6 samples were carried out by means X-ray difraction experiments through a PANalytical X’pert PRO difractometer (λCuKα=1.54064 Å). The analysis of the experimental data was performed from Rietveld reinement by using the GSAS+EXPGUI code11, through which it is possible
to obtain directly the most relevant structural parameters and the corresponding space group. In order to examine the surface morphology of the samples, Scanning Electron Microscopy (SEM) images were taken by using VEGA 3 TESCAN equipment. A semi-quantitative comparison of the nominal stoichiometry of the samples was established through application of the Energy Dispersive X-ray Spectroscopy (EDS) microprobe coupled to the electron microscope. With the purpose of analyzing the magnetic response of the material, measurements of susceptibility as a function of temperature and magnetization hysteresis curves were performed on Quantum Design MPMS magnetometer. Zero Field Cooling (ZFC) and Field Cooled (FC) procedures were carried out to determine the temperature dependence of the susceptibility on the application magnetic ields H= 500,
2000 and 10000 Oe. Hysteresis loops of magnetization as
a function of applied ields were recorded at T=50, 200 and
300 K. This solid-reacted material was previously reported
as semiconductor10, then difuse relectance measurements
were examined by means a VARIAN Cary 5000 UV-Vis-NIR spectrophotometer. Finally, Mössbauer measurements were
performed by means a 100mCi 57Co source in an Rh matrix,
which was driven at a constant acceleration in a triangular mode at room temperature. The spectra were recorded in 512 channels and the Lorentzian lines of the folded data were itted using Recoil software12. The spectrometer was
calibrated with the room temperature spectrum of α-Fe foil. All isomer shift values were expressed with respect to the centroid of this spectrum.
3. Results and Discussion
The structural analysis of the material is made from the predictions of the Structure Prediction Diagnostic Software
(SPuDS)13, which gives the most probable spatial groups and
the respective Wyckof positions of all the ions for a new material. These predictions are used as input data for the simulation of difraction patterns in the Powdercell (PCW)14,
in which it is possible to establish all the difractive planes, with their respective Miller indices and 2θ positions, for each spatial group predicted by the SPuDS. Finally, through the application of the GSAS code and its respective graphic interface EXPGUI11, the simulated patterns are compared with
the experimental difractogram in a reinement process that allows determining to which of the probable spatial groups corresponds the experimental XRD pattern. Likewise, through reinement, all the structural parameters are obtained and all the difractive planes are indexed, since the code allows the analysis of the shape and structure factors during the reinement process.
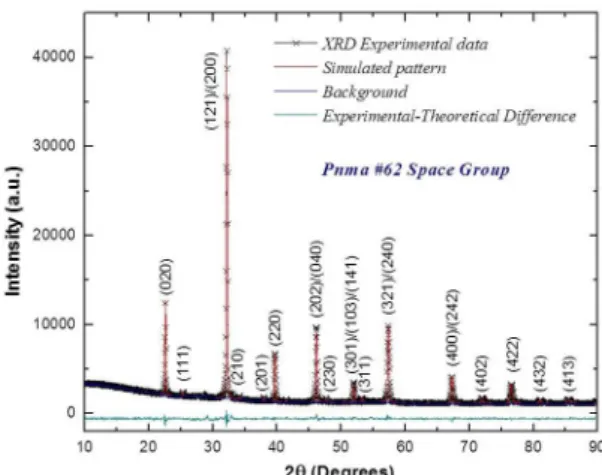
The XRD pattern for the LaBiFe2O6 samples produced
by the modiied Pechini method is exempliied in Figure 1, where symbols represents the experimental data, the red line is associated to the simulated difractogram, the blue line indicates the experimental background and the green line is the diference between the theoretical and experimental patterns. The reliability parameters associated to the reinement quality where χ2=2.81; R(F2)=0.0323; R
p=0.0306 and Rwp=0.0401. This can be said from the analysis that the LaBiFe2O6 material crystallizes in an orthorhombic perovskite, Pnma (#62) space
group, with lattice parameters a=5.5786(3) Å, b=7.8649(8)
Å and c=5.5583(7) Å, and respective angles α=β=γ=90.0°.
The appearance of the difraction peaks (111) and (311) constitutes a strong indication that the La3+ and Bi3+ cations
are placed in an orderly manner into the structure along the crystallographic directions.
Figure 1. Comparison between the reined XRD data and the
simulated pattern for the LaBiFe2O6 material.
It is expected that the Pnma space group corresponds to simple perovskites as CaTiO315. This orthorhombic structure
1311 Structure and Physical Properties of the LaBiFe2O6 Perovskite Produced by the Modiied Pechini Method
magnitude and opposite directions and corresponds to an increase of in the a=b cell parameter and doubling the
value of the c parameter when compared with the cubic
Pm 3m perovskite. The crystallization of double perovskite
materials in this structure probably occurs when the ionic radii
rA ≈ rA’. In our LaBiFe2O6 material there is a great similarity
between the ionic radii rLa3+=1.22 Å and r Bi
3+=1.24 Å. In order to properly describe the crystallographic structure the concept of Wyckof positions is used16, as
presented in Table 1.
represents a dimensionless has a typical value close to 0.9, but depends of the crystallite shape; λ=1.54056 Å is the X-ray
wavelength, β is the line broadening at half the maximum
intensity and θ corresponds to the Bragg angle. The mean size of the crystallite obtained by the Scherrer equation was τhkl=44.2 ± 4.1 nm. The crystallite size is calculated by the equation 1 as showed in Figure 3.
Another way to calculate the average crystallite size is through the equation applied by the GSAS code during the process of Rietveld reinement of XRD experimental data. This method is carried out by considering the Debye-Scherrer cone in the scattering angle 2θ. The applied expression is
(2)
where, κ≈0.9 is the Scherrer constant, λ=1.54056 Å
is the X-ray wavelength and X’= X+Ptec is the Lorentzian coeicient of particle size and anisotropy factor for the parallel crystallite size and X for the perpendicular crystallite size.
The average crystallite size given by the GSAS reinement was τ=52.2±4.2 nm, which is close to that obtained through the direct application of the Scherrer formula.
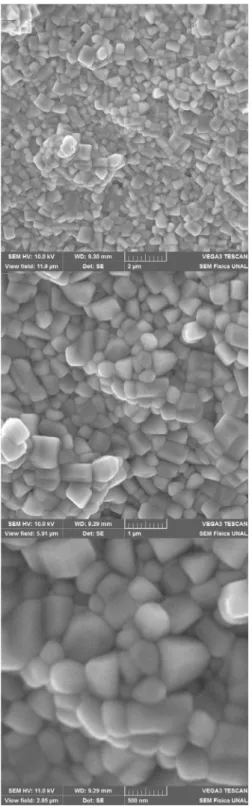
The granular surface topology of the samples is exempliied in the micrographs of Figure 4. Perfectly deined polyhedral grains of nanometric dimensions are observed in Figure 4. It is not clear necking between the grains as a result of a possible difusion, which is explained by the high sintering
temperature (1023 K) of the material after the synthesis
process by the modiied Pechini method.
The mean grain size was determined by the Average Grain Intercept (AGI) method, by drawing a set of randomly Positioned line segments on the SEM image, counting the number of times each line segment intersects a grain boundary, and inding the Intercepts ratio of length to line.
Thus, the average grain size was estimated at 373 ± 42 nm
(Figure 5), which is a much smaller size than the reported value for samples produced by solid state reaction10.
The semiquantitave stoichiometry of samples was analyzed the EDS microprobe coupled to SEM equipment. Figure 6 exempliies the EDS spectra from electron beams incident on the diferent surface grains of the samples. From the results it was established that the samples contain the stoichiometry expected from the nominal formula up in 98 %.
The magnetic susceptibility response as a function of temperature on the application of intensity ields H=500 Oe,
2000 Oe and 10000 Oe is presented in Figure 7. For each
value of intensity of applied magnetic ield H, the sample was irst cooled in absence of ield. Then H was applied and susceptibility was measured while the temperature was increased in the procedure known as ZFC recipe. In the FC prescription, the sample was cooled and measured under application of H. A strong irreversibility was observed for all values of applied ield, which is an indicative of the occurrence
sqrt{2}
√
2bar 3
¯ 3Table 1. Relevant lattice parameters for the LaBiFe2O6 complex
perovskite in the Pnma space group.
Atomic coordinates
Atom Wyckof positions x y z
La, Bi 4c 0.52003 0.25000 0.50333
Fe 4a 0.50000 0.00000 0.00000
O(1) 4c -0.00344 0.25000 0.44753
O(2) 8d 0.26671 0.04962 0.72421
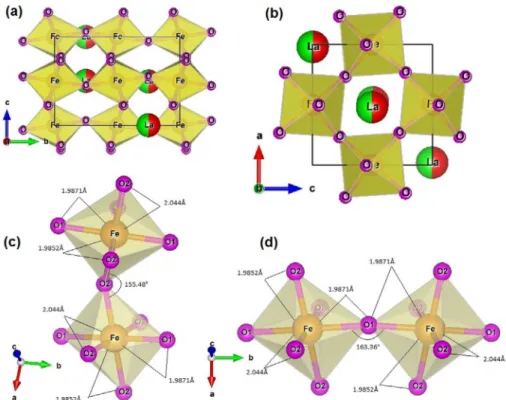
Eight oxygen atoms are sited in the ac-plane, corresponding
to the 8d Wyckof positions, and four oxygen atoms are
along the b-axis, in the 4c Wyckof positions. This splitting of the oxygen in two diferent Wyckof orbits constituted an evidence of the occurrence of a structural transition from a
cubic phase Pm 3m to the orthorhombic Pnma, since in a
cubic one Wyckof position for the oxygen atoms is suicient to describe the structure.
It is clear from the Glazer notation a-b+a- that octahedral distortions are expected with tilting in antiphase along the
a-axis and tilting in-phase along the b-axis, where a and b represents the pseudocubic sub-cell lengths17. These octahedral
distortions are easily observable in Figure 2. Figure 2a shows the FeO6 octahedra in the b-c crystallographic plane of the structure, which it should not be confused with any plane formed by the pseudocubic axes. Furthermore, Figure 2b shows the cell seen from the a-c crystallographic plane. In Figures 2a and 2b the octahedra tilting can be clearly observed.
The irregular shape of the octahedra can be analyzed from Figures 2c and 2d, where it can be determined that
the distances between Fe3+ cations and O2-anions adopt
diferent values along the octahedral axes, as follows: 1.987
Å between Fe-O(1), and 1.985 Å and 2.044 Å between
Fe-O(2). This octahedral symmetry justiies the diference between the Wyckof positions of the O(1) and O(2) anions represented in Table 1.
The mean size of the crystalline domains was analyzed by the application of the Scherrer formula, which is given by
(1)
where, τhklis the mean size of the ordered crystalline
domains (crystallite), which depends of the hkl direction; κ
Sem título1
bar 3
¯ 3 , cos hkl x b i lm = , X 18000x= r lm
Palacio et al.
1312 Materials Research
Figure 2. Structure and octahedral distortions of the LaBiFe2O6 material in the Pnma space group.
Figure 3. Mean crystallite size calculated by the Scherrer equation.
of some kind of disorder that facilitates the freezing of the domains of magnetic spins in the ZFC procedure.
One possible cause of this behavior of magnetically frustrated system is the cationic disorder of La3+ and Bi3+ atoms at the A and A’ sites of the double perovskite. Meanwhile, this possibility is ruled out because the Rietveld reinement permitted to identify the relection peaks (111) and (311), which constitute an evidence of formation of a FCC type structure that can only take place when the La3+ and Bi3+ cations are alternately arranged along the A and A’ sites of the structure.
The presence of sub-micrometric grain-size can introduce border and surface efects, as well as the possibility of formation of independent magnetic domains which can to give rise relevant contribution to the frustrated nature of the material. For all applied magnetic ields a strong ferromagnetic behavior is observed in the magnetic susceptibility in all temperature regimes studied (50 K<T<325 K), so it is expected that the Curie temperature occurs for values of temperature well above room temperature. An interesting feature involves the no occurrence of anomalies or magnetic pseudo-transitions
in the susceptibility for temperature values around T=258
K, as reported for solid reacted samples10.
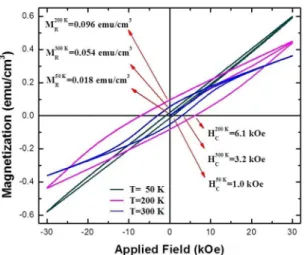
In the picture of Figure 8, a clear ferromagnetic behaviour of magnetization measurements as a function of applied ield at T=50 K, 200 K and 300 K is presented. It is observed that
the lower remnant magnetization and coercive ield occur at
T=50 K, at T=200 K remnant magnetization and coercive ield are higher and then these values decrease considerably for T=300 K, as showed in Figure 8.
In none of the magnetic hysteresis curves shown in Figure 7 the saturation magnetization (MS) is reached, but it is possible to infer that most MS could take place for T=50
K and lower for T=300 K. At temperatures close to room
induced in the surface are more relevant than the exchange mechanisms, resulting in a volumetric ferromagnetic response mixed with superparamagnetic efects, which would justify the linear trend of the hysteresis curve in the regime of high magnetic ield strengths for T=300 K. Likewise, this
Figure 4. Granular surface structure of sample in the powder form obtained from SEM images with magniications (a) 15000X, (b) 32500X and (c) 65000X.
Figure 5. Determination of the mean grain size by the AGI method from the image of igure 4.
Figure 6. EDS spectrum observed for the LaBiFe2O6 double perovskite.
Figure 7. Magnetic susceptibility as a function of temperature for the LaBiFe2O6 material on the application of H=500Oe, 2000 Oe and 10000 Oe. The inset shows the temperature derivative of
Palacio et al.
1314 Materials Research
would explain decreasing in values of coercivity ield and remnant magnetization when temperature is increased from
200 K to 300 K.
From the curves of susceptibility as a function of temperature (Figure 7), it is expected that at lower temperatures a greater number of magnetic moments align in the direction of the applied ield. In Figure 8 it can be observed that indeed the magnetization is greater at low temperatures. Furthermore, in the inset of Figure 7, the curve of temperature derivative of susceptibility shows that there is a change of concavity at T = 165 K. This anomaly may be related with nanoscopic
mechanisms that modify the ferromagnetic domains, increasing partially the values of the magnetic parameters (coercive ield and remnant magnetization). At higher temperatures, surface efects that give rise to the superparamagnetic nature inhibit the ferromagnetic order, decreasing values of the magnetic parameters.
In order to elucidate the nature of eventual local induced magnetic efects and the vibrational state of Fe3+ cations behavior in the structure, measurements of Mössbauer spectroscopy were carried out with the application of a Lorentzian model as showed in Figure 9. The reduced uncertainties calculated from the covariance matrix gives χ2 = 0.565.
The applied model showed the occurrence of a singlet related with a relevant fraction (14%) of superparamagnetic response, which is attributed to the nanometric character of
grains observed in Figure 4 and analyzed in Figure 518. On
the other hand, a sextet was clearly identiied, related to the Fe3+ in the octahedral coordination. The hyperine parameters from the its are reported in Table 2.
From Table 2, it is noted that, the high magnetic ield
(~51 T) imply that this kind of perovskite has a magnetic behavior at room temperature, which are due to the magnetic interactions of the two diferent types of magnetic ions: Fe3+ and (La/Bi)3+, and the competition between Fe-Fe, (La/
Bi)-Fe and (La/Bi)-(La/Bi) interactions in diferent magnetic
networks. This means that the interactions between the Fe
cations mediated by the oxygen anions are directly afected by the bond lengths and bond angles, which in turn afect the magnitude of the hyperine ield19. The above results are
in good agreement with those observed in the structural and magnetic analysis.
The gap energy was experimentally estimated by the Difuse Relectance technique. Results are shown in Figure 10. Three
peaks are observed in Figure 10a for wave lengths λ1=332
nm, λ2=604 nm and λ3=799 nm. These peaks correspond to energies E1=3.73 eV, E2=2.05 eV and E3=1.55 eV due to electronic excitations caused by electronic transitions from the valence band to the conduction bands.
In the spectrum for the LaBiFe2O6 complex perovskite, these energies are related to the symmetry of the atomic positions in the space group Pnma (#62) by the transitions O2p-La5d, O2p-Fe3dand O2p-Bi6p20 on the irreducible representation of
vibrations given by
(3)
where, the irst term correspond to ive vibration modes
which are observable by Raman spectroscopy and the 7B1u,
9B2u and 9B3u modes appear as three peaks measured through UV-Vis-IR spectroscopy.
Figure 8. Magnetization as a function of applied ield measured at
the temperatures T=50 K, 200 K and 300 K. Figure 9. Mössbauer spectrum for the LaBiFe2O6 perovskite and
applied itting model.
Table 2. Hyperine parameters of LaBiFe2O6 derived from the it
of room temperature Mössbauer spectra.
δ (mm/s) ε (mm/s) Γ (mm/s) Hf(T) χ2
Sextet 0.25±0.01 0.34±0.01
Singlet
0.38±0.01 -0,06±0,01 0.18±0.01 50.9±0.1 0.5648
,
Raman Vibration Modes B B B
5 7 1u 9 2u 9 3u
For the determination of the energy gap the method of Kubelka-Munk analysis is applied in the way as implemented by V. Kumar et al.21.
The absorption coeicient is given by
(4)
where, hν is the absorbed energy, B is the absorption constant, Eg represents the gap energy and n=1/2 or n=2
if there are direct or indirect semiconductor transitions, respectively. The energy gap is equivalent to the absorbed energy when αR = ln R, where R is the measured relectivity
relative to the unity. By representing the caractevs hν, it is possible to determine the gap energy as showed in Figure 10b. The results of difuse relectance are related to the chemical structure of the material. In the case of Fe3+, the valence and conduction bands present a splitting of the
3d-Fe levels in the crystal ield as a result of the octahedral
coordination of the FeO6. From the analysis of the Difuse
Relectance spectrum, the obtained energy gap was 2.13 eV, which corresponds to semiconductor behaviour. The
diference of this value as compared with reports for LaFeO3
Figure 10. Difuse relectance measurements in the LaBiFe2O6 samples: a) % relectance as a function of wave length and b) Kubelka-Munk analysis.
,
h
B h E
b
g n
a = R o-o W
Sem título2
left [ ln {R sub max-R sub min} over {R-R sub min} right ] sup 2
[
lnRmax−RminR−Rmin
]
2
(2.67 eV)22 and BiFeO
3 (2.81 eV)
23 is partially caused by the
occurrence of three diferent Fe3d-O2p bonds into the FeO6 octahedra: 1.987 Å for Fe-O(1), and 1.985 Å and 2.044 Å for
Fe-O(2). Likewise, the interatomic distances of the La-O and
Bi-O bonds are not symmetrical because of the occurrence
of octahedral distortions.
4. Conclusions
The LaBiFe2O6 double perovskite has been synthesized by the modiied Pechini method. Results of the crystalline characterization through Rietveld analysis of XRD patterns revealed that this material belong to the perovskite family
and crystallizes in an orthorhombic structure, Pnma (#62)
space group. Despite containing two types of cation (La3+ and Bi3+) on sites A and A’ of the structure, the proximity between values of their ionic radii and their little magnetic character facilitates this material adopts a structure typical of simple perovskites. The crystallite size studied from the analysis of experimental data of XRD and the average grain size analyzed by SEM images revealed the nanometric nature of the particles forming this double perovskite. EDX spectrum showed that the compound has only the elements which were initially established through its nominal stoichiometry. Magnetic susceptibility measurements as a function of the temperature allowed observing the occurrence of magnetic irreversibility between the ZFC and FC procedures, which are attributed to the crystalline anisotropy related to octahedral distortions that are evident in the material structure. This was determined by the results of magnetization as a function of applied magnetic ield that the material behaves like a ferromagnetic at room temperature, with a marked tendency superparamagnetic, which linearizes the saturation regime of the hysteresis curve. This interpretation is corroborated by the results of Mössbauer spectroscopy, which reveals a signiicant fraction of superparamagnetism mixed with the ferromagnetic response. The superparamagnetic feature is attributed to the nanometric nature of the granular morphology. Finally, the difuse relectance measurements suggest that
this material behaves as a semiconductor energy gap of 2.17
eV. In general, the results obtained for samples produced
by the modiied Pechini method difer from those solid reacted in its magnetic properties related to the average grain size, because this technique allows the obtaining of grains with sizes of nanometric order, with ferromagnetic and superparamagnetic characteristics, which may have
applications in biomedicine24, as sensor in microluids to
facilitate medical diagnoses25 and for water puriication26,27,
between others.
5. Acknowledgments
Palacio et al.
1316 Materials Research
de Antioquia - Medellin, Colombia) through Solid Sate Group-GES Sustainability Strategy 2016-2017.
6. References
1. Pechini MP, inventor; Sprague Electric Co, assignee. Method
of preparing lead and alkaline earth titanates and niobates and coating method using the same to form a capacitor. United States patent US 3330697. 1963 Aug 26.
2. Wu YT, Wang XF, Yu CL, Li EY. Preparation and Characterization of Barium Titanate (BaTiO3) Nano-Powders by Pechini Sol-Gel Method. Materials and Manufacturing Processes. 2012;27(12):1329-1333.
3. Del Toro R, Hernández P, Díaz Y, Brito JL. Synthesis of La0.8Sr0.2FeO3 perovskites nanocrystals by Pechini sol-gel Method. Materials Letters. 2013;107:231-234.
4. Barrera EW, Pujol MC, Cascales C, Zaldo C, Park KH, Choi SB, et al. Spectroscopic characterization of sol-gel synthesized Tm:Lu2O3 nanocrystals. Applied Physics D. 2012;106(2):409-417.
5. Jaramillo PJA, Landínez Téllez DA, Roa-Rojas J, Parra Vargas CA, Barrera EW. Synthesis of LaYbO3 perovskite through
modiied Pechini method: Structural, electric and magnetic characterization. International Journal of Modern Physics B. 2015;29(30):1550217.
6. Zhu Z, Tao Z, Bi L, Liu W. Investigation of SmBaCuCoO5+δ double-perovskite as cathode for proton-conducting solid oxide fuel cells. Materials Research Bulletin. 2010;45(11):1771-1774.
7. Tuza PV, Souza MMVM. Steam Reforming of Methane Over Catalyst Derived from Ordered Double Perovskite: Efect of Crystalline Phase Transformation. Catalysis Letters. 2016;146(1):47-53.
8. Woodward PM. Octahedral Tilting in Perovskites. I. Geometrical considerations. Acta Crystallographica Section B. 1997;53:32-43. 9. Beltrán Rodríguez R, Landínez Téllez D, Roa-Rojas J. Chemical
Stability and Crystallographic Analysis of the Sr2HoNbO6 Cubic Perovskite as Potential Substrate for YBa2Cu3O7-δ Superconducting Films. Materials Research. 2016;19(4):877-881.
10. Cuervo Farfán JA, Aljure García DM, Cardona R, Arbey Rodríguez J, Landínez Téllez DA, Roa-Rojas J. Structure, Ferromagnetic, Dielectric and Electronic Features of the LaBiFe2O6 Material.
Journal of Low Temperature Physics. 2017;186(5-6):295-315.
11. Larson AC, Von Dreele RB. GAS General Structure Analysis
System. Los Alamos: Los Alamos National Laboratory; 2000. 12. Lagarec K, Rancourt DG. Recoil-Mössbauer Spectral Analysis
Software for Windows. Ottawa: University of Ottawa; 1998. 13. Lufaso MW, Woodward PM. Prediction of the crystal structures
of perovskites using the software program SPuDS. Acta Crystallographica B. 2001;57(Pt 6):725-738.
14. Kraus W, Nolze G. POWDER CELL - a program for the representation and manipulation of crystal structures and calculation of the resulting X-ray powder patterns. Journal of Applied Crystallography. 1996;29(Pt 3):301-303.
15. Lufaso MW, Barnes PW, Woodward PM, Structure prediction of ordered and disordered multiple octahedral cation perovskites using SPuDS, Acta Crystallographica B. 2006; 62(3): 397-410.
16. Sasaki S, Prewitt CT, Bass JD, Schulze WA. Orthorhombic perovskite CaTiO3 and CdTiO3: structure and space group.
Acta Crystallographica Section C. 1987;43(Pt 9):1668-1674.
17. Wondratschek H. Special topics on space groups. In: Arroyo M, ed. International Tables for Crystallography. Volume A: Space-group symmetry. Dordrecht: Springer; 2006. p. 732-740.
18. Glazer AM. Simple ways of determining perovskite structures.
Acta Crystallographica Section A. 1975;31(Pt 6):756-762. 19. Fujii T, Matsusue I, Nakanishi M, Takada J. Formation and
superparamagnetic behaviors of LaFeO3 nanoparticles. Hyperine
Interactions. 2012;205(1-3):97-100.
20. Morales LA, Sierra-Gallego G, Barrero CA, Arnache O. Relative recoilless F-factors in REFeO3 (RE = rare-earth La, Pr, Nd and
Sm) orthoferrites synthesized by self-combustion method.
Materials Science and Engineering: B. 2016;211:94-100.
21. Sorescu M, Xu T, Hannan A. Initial Stage Growth Mechanism of LaFeO3 Perovskite through Magnetomechanical Ball-Milling of Lanthanum and Iron Oxides. American Journal of Materials Science. 2011;1(1):56-66.
22. Kumar V, Sharma SK, Sharma TP, Singh V. Band gap determination in thick ilms from relectance measurements.
Optical Materials. 1999;12(1):115-119.
23. Sorescu M, Xu T, Burnett JD, Aitken JA. Investigation of LaFeO3
perovskite growth mechanism through mechanical ball milling of lanthanum and iron oxides. Journal of Materials Science. 2011;46(20):6709-6717.
24. Kumar A, Rai RC, Podraza NJ, Denev S, Ramirez M, Chu YH, et al. Linear and nonlinear optical properties of BiFeO3.
Applied Physics Letters. 2008;92(12):121915.
25. Akbarzadeh A, Samiei M, Davaran S. Magnetic nanoparticles: preparation, physical properties, and applications in biomedicine.
Nanoscale Research Letters. 2012;7(1):144.
26. Konry T, Bale SS, Bhushan A, Shen K, Seker E, Polyak B, et al. Particles and microluidics merged: perspectives of highly sensitive diagnostic detection. Microchimica Acta. 2012;176(3-4):251-269.
27. Balaure PC, Gudovan D, Gudovan IA. Nanotechnology depollution of heavy metals present in potable water. In: Grumezescu A, ed.