Maurício G. Silva *
Institute of Aeronautics and Space São José dos Campos - Brazil [email protected]
Victor O.R. Gamarra
Paulista State University Guaratinguetá - Brazil [email protected]
Vitor Koldaev
Institute of Aeronautics and Space São José dos Campos - Brazil [email protected]
*author for correspondence
Control of Reynolds number in a
high speed wind tunnel
Abstract: A conceptual control model for the Reynolds number test based on isentropic relations was established for the supersonic wind tunnel. Comparison of the system response of the model simulation and the actual wind tunnel test data was made to design the control system. Two controllers were defined: the first one was based on the stagnation pressure at the settling chamber; the second was based on the relation between stagnation pressure and temperature at the settling chamber which represents the Reynolds number specified for the test. A
®
SIMULINK block diagram code was used to solve the mathematical model consisting of mass and energy conservation equations. Performance of the supersonic wind tunnel using a PI (proportional-plus-integral) controller was found to be satisfactory, as confirmed by the results.
Key Words: Blowdown wind tunnel, Pressure control, Mach number control,
Reynolds number control.
A CD Cg Cp Cv D E(s) h Ki Kp M. m P r Re SWT t T U v V θ ρ γ µ τ Subscript 1 d dif exit 0
LIST OF SYMBOLS
Cross section Area Discharge coefficient Gas sizing coefficient Specific heat (constant pressure)
Specific heat (constant volume)
Test section diameter Error
Specific Enthalpy Integral controller gain Proportional controller gain Mach number
Mass flow Pressure Recovery factor Reynolds number Supersonic Wind Tunnel Time
Stagnation Temperature Internal energy
Velocity Volume
Valve opening position Density
Specific heat ratio Viscosity
Static Temperature In front of shock Desired condition Diffuser
Exit of diffuser Settling chamber
m² s/m -J/kgK J/kgK m Pa J/kg -kg/s Pa -s K J m/s M³ deg kg/m³ -kg/s K ____________________________________ Received: 23/03/09
Accepted: 20/05/09
t T TS v
Throat of nozzle Storage tank Test section Valve
INTRODUCTION
There are many parameters that characterize a blowdown Supersonic Wind Tunnel (SWT) such as the test section dimensions, operating characteristics (Reynolds number x Mach number), general capabilities of the facility (Mach number range, maximum stagnation pressure) and so on. Many types of tests simulated in a high-speed wind tunnel are sensitive in various degrees to the errors in Mach and Reynolds number. For example, one standard task certainly is the measurement of aerodynamic forces and moments. In this kind of test, the formation of shock waves inside the test section is expected due to the presence of the model. These waves can reflect off the walls, and may cause a detrimental effect on the measurement of forces and pressures on the tested model. Since the angle of reflection is related to the Mach number (Pope and Goin, 1965), the choice of model size is a function of the Mach number in the test section.
.
where ρ is the storage tank air density, m is the mass efflux aeronautical components. So, it is important (stagnation T v
through the valve Vand is the storage tank volume. The pressure, geometrical configuration of nozzles and T
subscript “T” refers to the storage tank. By assuming the diffuser) before each experimental test run.
energy loss through the valve is negligibly small, the internal energy change in the storage tank is equal to the In this context, a non-linear mathematical model was
enthalpy plus the kinetic energy through the valve. developed to analyze the open-loop system characteristics
Therefore: as well as for the controller design. The model for SWT was
based on the mathematical model proposed by Fung (1987).
(2) Each module of SWT is formulated as an isentropic
subsystem.
where U is the storage tank air internal energy,h is the The principal difference between this work and that T v
specific enthalpy of the air through the valve and v is the proposed by Fung (1987) is that, in the present work, the v
velocity of the air through the valve. In terms of the Reynolds number specified for the test run is controlled. A
® stagnation pressure, Eq. (2) can be written (Fung, 1987):
SIMULINK block diagram code was used to solve a mathematical model consisting of a set of ordinary differential and algebraic equations derived from the mass and energy conservation. The performance of the
(3) supersonic wind tunnel using a PI
(proportional-plus-integral) controller was found to be satisfactory, as confirmed by the results.
The quotient γ =cp v/c is the specific heat ratio and R is the gas constant. The valve characteristics are described in Fisher Controls Company (1984), by the manufacturer. The mass MATHEMATICAL FORMULATION
flow at different valve positions is given by: The dynamic analysis of the control system for SWT is
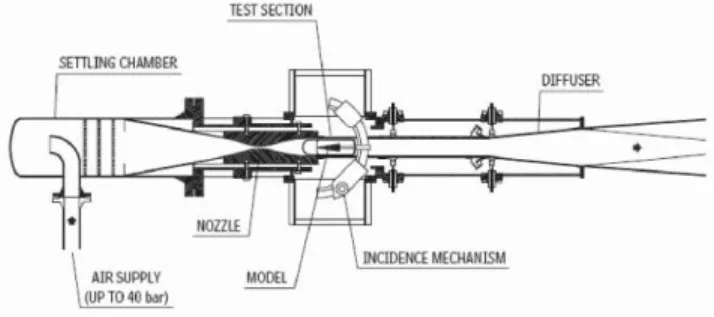
divided into five modules: storage tank, settling chamber nozzle, test section and diffuser, Fig. 1. Control volumes
(4) mathematically represent these modules. It is important to
stress here that, in the analyses to follow, isentropic relations are assumed (no shock waves, friction and heat
where C is the “gas sizing coefficient”. Note that, transfer are neglected). The change of potential energy of g
C=C θ), where θ is the valve opening position. The the gas is small and can be ignored. g g
variables PT and PT are the thermodynamic properties (temperature and pressure) of the air into the storage tank.
ΔP is the pressure difference across the valve. It is assumed
-that ΔP=P PT O, where PO is the stagnation pressure at the settling chamber.
Settling Chamber
The second control volume is the settling chamber. Air flows into the settling chamber from the control valve and goes through the convergent-divergent nozzle to the test section. The energy entering the settling . chamber volume with mass flow mvminus the energy Figure 1: Blowdown Wind Tunnel (Matsumoto et al., 2001) .
exiting through the nozzle with mass flowmvis equal to the internal energy rate in the settling chamber. Storage Tank Therefore, the relation of energy conservation for the
settling chamber is: During a test, it is assumed that the mass influx from the
compressor is negligible. Hence, the rate of decrease of
mass in the air tank is equal to the rate of mass efflux (5) through the valve:
Subscript “0” refers to the settling chamber and subscript (1) “t” refers to the throat nozzle. Rewriting the Eq.(5) in terms
tunnel test section will be compressed and slowed down in the converging section of the diffuser, will pass through the (6) second throat at a speed considerably below that of the test section, will begin to speed back up in the diverging portion of the diffuser, and will establish a normal shock in the The flow is without heat transfer. In this context, it is diverging portion of the diffuser at a Mach number possible to rewrite Eq.(6): considerably below the test section Mach number, and with a correspondingly smaller loss. The design of the second throat provides the required position of shock wave at the divergent portion of nozzle. In order to estimate the run (7) time, the movement of the shock wave at the diffuser is considered. The test run simulation is analyzed while the since TO=TT . shock wave position is greater than the second throat
position. Nozzle
The nozzle of the supersonic wind tunnel is axisymmetric, The shock position is obtained from the pressure ratio and variable-geometry with converging-diverging geometry. It area relation. The Mach number at the exit diffuser is given is assumed that the flow from the settling chamber to the test by:
section runs an isentropic process. Considering the air as a perfect gas and the stagnation state as the reference state,
.mtcan be written as function of stagnation pressure and the nozzle throat area At . The maximum flow through the nozzle will be:
(8) (11)
where C is the discharge coefficient of the nozzle, given as:D
Where PO is the stagnation pressure at the test section and
Pexit is the static pressure at the exit of diffuser. exitP = Patm is adopted. The next step is to use Mexit to determine (9) Pexit/Pafter_shock (at the diffuser) from the isentropic relations.
Since Mexit < 1 , it is possible to obtain the jump relation: The critical area At is function of the Mach number (M)
desired in the test section and of its transversal sectionA, (12 namely (Kuethe, 1998):
From Eq.(12) the Mach number before the shock is calculated (M1) using the jump relations derived for normal shock waves. WithM1, the area relation and, (10)
consequently, the shock position are calculated.
Mach number at the Test Section and Diffuser CONTROL PROBLEM
The primary reason for installing a good controller for a The Mach number at the test section is obtained from
wind tunnel is to significantly improve flow quality in the Eq.(10). With the geometrical conditions at the test section
test section. The required flow steadiness may vary with the a critical area is defined considering the Mach number
type of tunnel. For a typical airplane test, criteria such as required by the test.
less than 1.0 per cent of error in Cd and Cp are usually sufficient. To meet these criteria, the Mach number Shocks wave are the mechanism by which most supersonic
steadiness in the test section must stay close to ± 0.3 per cent flows, including those in a wind tunnel, are slowed down.
at M = 3.0 (Marvin, 1987). This control can be obtained in When a supersonic flow passes through a shock wave, a loss
different ways. The first option is to control just the in total pressure occurs. In this context, the design of most
stagnation pressure of the settling chamber in order to keep supersonic wind tunnels includes a diffuser having a
the nozzle throat (A) chocked at the design conditions. converging section; a minimum cross section zone termed t
Another option is to control the Reynolds number specified the “second throat” and then a diverging section. The
for the test section. purpose of this design is that the flow leaving the wind
2 11
2
2
1
2
1
1
M
M
The present pressure control problem is relatively simple Reynolds number at the test section where only accuracy and stability are matters of prime
concern. In this case it was judged that the complexities of From the preceding discussion, it is possible to control the optimal control, neural networks and so on, are neither test section condition through the control of the stagnation necessary nor desirable for the present purposes. pressure at the settling chamber. However, during the evacuation process of air from the supply tank the Stagnation Pressure in Storage Tank stagnation temperature is not constant; moreover, this variation changes the Reynolds number significantly at the The objective in setting up the controller parameters for the test section. In this context, a PI control system was devised valve is to minimize the initial transient duration to obtain based on the Reynolds number defined for the experiment. as long a steady run time as possible. The control process By definition, in an isentropic process:
needs a model of the pressure transmitter, the digital valve controller and the automatic ball valve to perform the SWT's control. The stagnation pressure is converted to current signal by a pressure transmitter located upstream
from the nozzle. Then this signal feeds the digital valve (15) controller. The controller has two parameters that can be
changed to maintain a steady settling pressure, a proportional gain (Kp) and an integral gain (Ki). The complete description of the methodology used to determine
the controller gains and the required performance index can So, the density can be evaluated from the relations (15): be found in Fung et al. (1988).
(16) The digital valve controller compares the stagnation
pressure with a set pressure and derives a corrective output signal according to the setting of these two parameters.
Since: These parameters may be modified to increase the process
performance. Typically, the transfer function of the PI controller is:
(17)
it is possible to write: (13)
where θ(s) is the valve opening position and
is the error signal between
(18) the reference input ( desired stagnation
pressure at the settling chamber), and the output of the
system which represents the actual pressure Using the definitions:
and measured. Applying the inverse Laplace transform, the
differential relationship between the input and output θ(t) of the PI controller is:
(19)
The Reynolds number can be written as a function of stagnation conditions of the flow:
(14) (20)
s P
s P P
s
E setpo Design
0 0 int
0
s
P
s
P
DesignSettling Where the constant ξ is given by:
Chamber
, and:
(21)
Nozzle
Viscosity is defined by:
Valve Angle (22)
The set point condition was defined in function of Reynolds number designed for the experiment, which is:
(23)
Finally, the controller equation which must be applied to the plant is:
Or
(24)
NUMERICAL IMPLEMENTATION
From the preceding discussion, expressions were obtained which describe the behavior of the SWT and the control systems. These are summarized here:
The above equations become a system of six first-order nonlinear differential equations, in time, derived from the Storage Tank
mass and energy conservation (Storage Tank, Settling Chamber, Nozzle), constitutive equation (gas and control valve) and control equations (Valve angle).
There are six state variables, which are: Pt t , ρ , Pο , θ, mt
and mv. The inputs of this system are: test section Mach number, which results in a determined nozzle geometry; the valve position θ(Cg), which determines the control valve behavior, according to changes in Cg ; The outputs of this system are the stagnation pressure (Pο) and temperature (Tο) in the settling chamber, angle valve (θ(t)), Mach and Control Valve
Reynolds number at the test section.
Figures 2, 3 and 4 show schematic block diagrams relating to the SWT model, making use of a graphical editor of the MATLAB-Simulink package (Mathworks, 2002).
1
Re
Setpoint
Design i
p Design
p
K
t
K
dt
t
d
K
dt
t
d
Re
Re
1
Re
Re
Figure 2: Block diagram: Stagnation Pressure Controller
Figure 5: Wind tunnel without controller
Wind Tunnel with Stagnation Pressure Control
In order to compare the experimental results with those from the mathematical model simulation, the same conditions adopted by Fung (1987) were established for the present case. The research of Fung (1987) deals with the solution of the stagnation pressure control problem at the settling chamber in the SWT. This reference case is a good test to evaluate the concordance among different mathematical models. By adding a controller in a feedback Figure 3: Block diagram: Reynolds Controller
loop to the wind tunnel plant, the mathematical model for the closed-loop system is established. The results are shown in Tab. 2.
Table 2: Comparison of results from simulation and experimental data (PT = 260 psia)
Figure 4: Block diagram: Controller Detail
RESULTS
The results are presented following the sequence below:
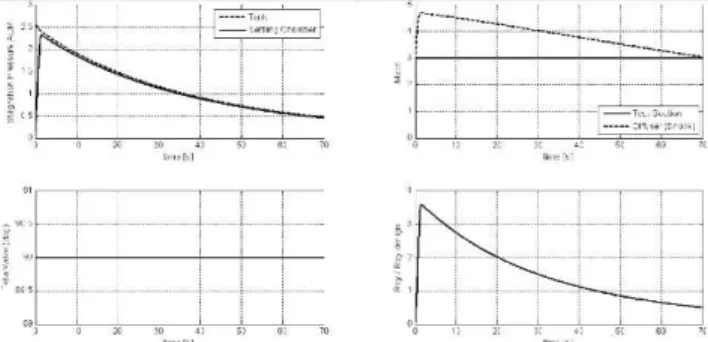
- Wind tunnel without controller;
- Wind tunnel with stagnation pressure control; It can be seen that the performance of the real wind tunnel is even better than the simulation. The reason is the - Wind tunnel with Reynolds number control; assumption of an adiabatic process in the simulation. In reality, heat transfer takes place particularly through the - Temperature variation; large tank surface during the test. While the tank temperature decreases during the test, a finite amount of - Shock position at the diffuser. heat is transferred from the tank walls to the inner air. This leads to a higher tank temperature as well as a higher tank Wind Tunnel without Controller pressure than predicted by the model, Fung (1987).
Figure 5 shows a comparative picture with the plant without Figure 6 shows the behavior of the system at Mach number controller. Although the Mach number at the test section 3. The results are expressed in terms of stagnation pressure does not change during the test run (70 sec), there is a big and stagnation temperature at the settling chamber, variation in terms of Reynolds number. In this context, it is stagnation pressure at the tank, Mach and Reynolds number possible to conclude that Fung's wind tunnel configuration at the test section, and the angle valve (between the tank and needs a control system. settling chamber). The stagnation pressure control at the
Ref
PO
Sum 1 1
2
1 s Integrator
Ki Ki Kp Kp
Sum 2
Saturation 1 Cg Ref
Step
ConteollerRey Wind Tunnel PO Cg PO
Cg
P0[Psia]
Mach Run Time [s]
Present Work Run Time [s]
Experimental
2.5
3.0
3.5
80
110
160
55
50
40
49
45
settling chamber was used. It can be concluded that the control system based on the stagnation pressure at the settling chamber was found to be satisfactory, although the Reynolds number was not constant at the test section. Curiously, for this particular configuration, significant variation in angle of valve was not found.
Thus, this control would be run manually. Finally, it can be observed that the constant average controller parameters found above are effective at all Mach number (2.5 to 4.0) in obtaining a response with a minimum steady-state error and
Figure 7: Wind tunnel with Reynolds number control overshoot with a minimum settling time.
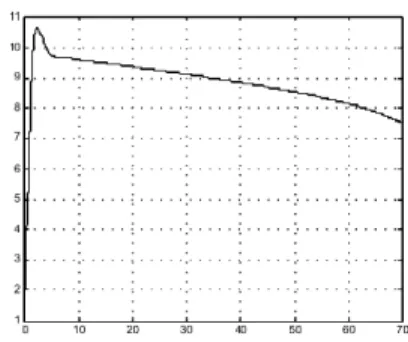
Shock Position
Figure 8 shows the results obtained using the different types of control system adopted in this report. The shock position at the diffuser is directly dependent on stagnation pressure at the settling chamber. So, a constant location is expected during the test run if a stagnation pressure controller is adopted for the plant.
The reason for tracking the shock wave at the diffuser is to Figure 6: Wind tunnel with Stagnation Pressure control evaluate the Mach number at the test section. The test run simulation is conducted while the shock wave position is greater than the second throat position.
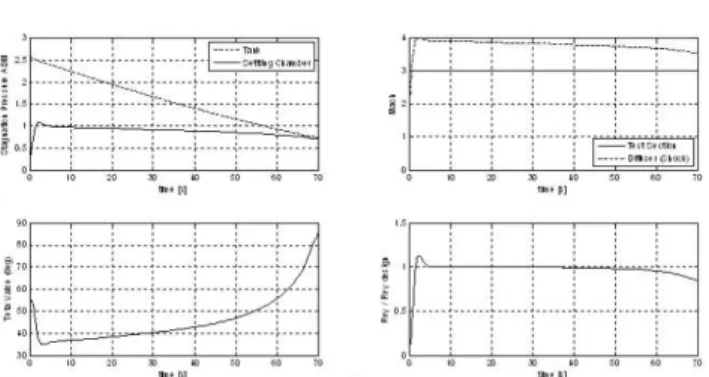
Wind Tunnel with Reynolds number Control
Figure 7 shows the same configuration adopted in the last section but, this time, with the Reynolds number controller. The objective is to compare the results obtained for Mach and Reynolds number at the test section using both control methodologies. Although the Mach number required to run using Fung's control system is achieved, there is a considerable difference between the methods (20 per cent approximately) in terms of Reynolds number.
The principal reason for this difference is related to the temperature involved in this process. The Reynolds number controller considers the temperature variation during the
transient analysis, Eq. (20), adjusting the mass ratio in a (a) Plant without controller different way from the stagnation pressure control. Thus, a
different angle valve variation is expected, Figs. 6 and 7. According to Pope and Goin (1965), there are two ways in which blowdown WT are customarily operated: with stagnation pressure constant or with constant mass flow. For constant mass runs the stagnation temperature must be held constant and either a heater or a thermal mass external to the tank is required. For constant stagnation pressure (settling chamber), the only control necessary is a pressure regulator that maintains the stagnation pressure constant. This report considers a relationship between stagnation pressure and temperature, which characterizes the Reynolds number at the test section as control parameter at the plant. Finally, it is interesting to note that this mathematical model is an attractive tool for analyzing different test configurations, which require
different control methodologies. (b) Plant with stagnation pressure controller
)
(c) Plant with Reynolds number controller
(c) Plant with Reynolds number Controller Figure 8: Shock position.
Figure 9: Temperature Variation Temperature Variation during the Test
The curve shape and the minimum value of temperature is Achieving constant stagnation pressure is a critical concern the principal concern. From these results it is possible to for supersonic wind tunnel testing. The control algorithm is conclude that the algorithm developed for the Reynolds designed such that it is suitable for different Mach number number controller is more efficient when flow quality and testing and, at the same time, obtaining the maximum test test time are considered.
time for different stagnation pressures.
However, the temperature variation is another requirement CONCLUSIONS for the experimental analysis. Since the Reynolds number is
a function of stagnation pressure and temperature, it is A conceptual control model, based on the Reynolds number necessary to consider the temperature variation in the at the test section, was established for the supersonic wind control algorithm as well. Figure 9 shows the different tunnel. Comparison of the system response of the model profiles when the plant without controller is considered, simulation and the actual wind tunnel test (Fung, 1987) data with stagnation pressure control and with Reynolds number was made to determine the applicability of the model. control. Two controllers were defined: the first one was based on the
stagnation pressure at the settling chamber; the second was based on the relation .
Performance of the supersonic wind tunnel under different Mach numbers and stagnation pressure was tested. The following conclusions were drawn from the results of simulations:
(i) The isentropic approach can be used for preliminary design of the control system based on stagnation pressure at the settling chamber or Reynolds number at the test section. According to the single-loop adopted in these analyses, the second option is to be preferred since it is possible to obtain (a) Plant without Controller Mach and Reynolds number control simultaneously. It is important to stress here that, the principal reason in adopting the control system based on the Reynolds number at the test section is not directly related to the run time. The concern is about quality of flow.
(ii) The mathematical formula applied to the normal shock wave at the diffuser can be an interesting tool to be used in analysis of run time, when the Mach number is considered as a control parameter. The cases presented in this report consider the Mach number at the diffuser greater than the Mach number at the test section. It is not a common practice. Thus, it is extremely important to analyze the stability of shock wave at the divergent portion of diffuser
setpoint
before defining the variable P ; (b) Plant with Stagnation Pressure Controller ο
)
(iii) After investigating different control algorithms, a single-input single-output PI controller has been chosen for this task because of its simplicity and availability. The major problem in implementing this control system is the highly nonlinear relationship of both the gas dynamics and the valve-nozzle characteristics. The linearized mathematical model was used to analyze the open-loop system characteristics as well as for the controller design. However, it is interesting to improve this mathematical model implementing the gain calculator in order to provide an automated design tool for blow-down wind tunnel testing.
REFERENCES
Buggele, A. E. and Decker, A. J. , 1994, “Control of Wind Tunnel Operations Using Neural Net Interpolationof Flow Visualization Records”, NASA TechnicalMemorandum 106683.
Ficher Control Company, 1984, ”Rotary Shaft Control Valve Specifications.”, Marshalltown, Iowa, Ficher Control Company Report.
Fung, Y. T, 1987, “Microprocessor Control of High Speed Wind Tunnel Stagnation Pressure”, The Pensylvania State University, Master of Science, 59 p.
Fung, Y. T., Settles, G. S. and Ray, A., 1988, “Microprocessor Control of High-Speed Wind Tunnel Stagnation Pressure”, AIAA Journal, Vol.2, No.14 pp429.
Kuethe, A. M., Chow, C. Y., 1998, “Foundations of Aerodynamics”, Fifth Edition, John Wiley & Sons, New York.
Marvin, J. G., 1987, “Wind Tunnel Requirements for Computational Fluid Dynamics Code Verification”, USA, NASA Technical Memorandum 100001.
Matsumoto J., Lu, F. K. and Wilson, D. R., 2001, “Pre Programmed Controller For A Supersonic Blowdown Tunnel”, 95th Meeting of the Supersonic Tunnel Association International, Hampton, VA
Pope, A., and Goin, K. L., 1965, “High Speed Wind Tunnel Testing,” John Wiley & Sons, New York.
Silva, M. G., Falcao, J.B.P.F and Mello, O. A. F., “Control of High Speed Wind Tunnel Stagnation Pressure”, Proceedings of the 11th Brazilian Congress of Thermal Sciences and Engineering (ENCIT), Dec 5-8, 2006, CIT06-0921, Curitiba, Brasil.