Daniel Ferreira V. Mattos* Institute of Aeronautics and Space São José dos Campos - Brazil [email protected]
Alberto W. S. Mello Junior Institute of Aeronautics and Space São José dos Campos - Brazil [email protected]
Fabrício N. Ribeiro Institute of Aeronautics and Space São José dos Campos - Brazil [email protected]
*author for correspondence
F-5M DTA Program
Abstract:The Brazilian F-5 was submitted to avionics and weapons upgrade. This “new” aircraft has proven to be heavier and more capable. A comprehensive damage tolerance analysis is being performed to evaluate how the new mission profiles and weight distribution may affect the airframe structural integrity. Operational data were collected at the Brazilian Air Force Bases where the fighter is flown. Software was developed in order to acquire, filter and analyze flight data. This data was used for comparison between the pre and post modernization mission profiles and to determine the stress level in each of the known aircraft fatigue critical locations (FCL). The results show that the change in aircraft weight and balance and the new operational profile can significantly change the inspection intervals of certain fatigue critical locations of the structure. A preliminary result for the horizontal tail has shown that this component will have a much more restrictive maintenance schedule to assure flight safety.
Key words: Fatigue, Damage tolerance, Structure, F-5, Flight data analysis, Crack growth.
LIST OF SYMBOLS
BACO Canoas Air Force Base high-g maneuvers the most significant contribution that BASC Santa Cruz Air Force Base define their service life.
FAB Brazilian Air Force
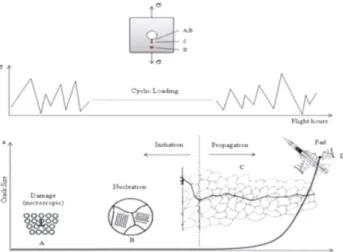
DTA Damage Tolerance Analysis A structure can lead to catastrophic failure even if it is FCL Fatigue Critical Location submitted to loads smaller than its structural design limit. FDR Flight Data Recorder This is a cumulative effect, known as fatigue. Figure 1 IAE Institute of Aeronautics and Space illustrates the basic mechanism of how cyclic loads may Ny Lateral load factor induce a structural failure.
N z Normal load factor
NDI Non Destructive Inspection RFC Representative Flight Condition USAF United States Air Force
SwRI Southwest Research Institute
INTRODUCTION
The development of new technology and declining governmental budget make it difficult to replace military fleet as it becomes obsolete. Therefore, Air Forces around the world have alternatively decided to update the existing vectors in their inventory. The military aircraft modernization primarily aims at extending mission profiles, but also changes considerably the structure weight and balance. The main effect is the increase in stress levels, which can therefore compromise the structural integrity. To
Figure 1: The basic mechanism of fatigue (Mattos, 2008). assure flight safety, a comprehensive campaign to collect
operational data and to analyze the impact in the structural integrity of the aircraft is necessary.
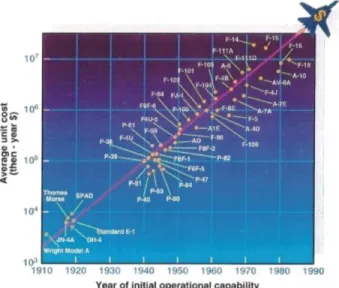
As already mentioned, the most compelling reason to extend an aircraft's structural life is the pressure to save The aircraft structure is subject to cyclic loads due to
money. Figure 2 shows the cost of a combat aircraft in U.S. maneuvers and gusts that overlap stationary loads of a
dollars. As can be seen, the cost has increased exponentially steady flight. Aircraft fighters, as the F-5, have from the
over the years. On the other hand, any weapon system and avionics modernization is also costly. Therefore, ____________________________________
modernization usually requires a reassessment of the Received:05/05/09
the Load/Spectra Environment Survey (L/ESS). This type of survey takes into account not only the load factor, as conducted in traditional analyses, but also addresses the aircraft mission profiles, operational environment, speed, altitude and other time dependent parameters. table 1 illustrates an example of how the same load factor may result in different stress levels depending on the maneuver condition. The example is presented for the F-5 Dorsal Longeron, for the normal load factor (N ) of 5g's and Mach z 0.8. The calculated stress varies up to 47% with changes in weight, flap deflection and altitude.
Table 1: F-5M Dorsal Longeron Stress
Figure 2: Aircraft average unit cost per year (Burnside, 1993).
The Brazilian Air Force (FAB) is also part of these worldwide budget restrictions. For this reason, until FAB is
Comparing case 1 and case 2, the single change in flap able to properly acquire new fighters, it is necessary to
position leads to an increase of 37% in stress, and for cases 3 upgrade and keep the existing ones flying. As part of this,
and 4, changing altitude and keeping fixed all other the implementation of airframe life extension and the
conditions ensued in a 28.7% difference in stress. guarantee of the structural integrity are vitally important.
Analyzing these cases, we can conclude that not only the load factor, but also other parameters are extremely The F-5 fleet was one of the elected FAB vectors to have its
important to properly determine the structure stress level. service life extended and the avionics upgraded. In order to
fit all new equipment, some structural modification was
All the major steps of the F-5M DTA Program are implemented. With new avionics integration, the F-5 basic
represented by the flowchart shown in Figure 4 and are weight has increased. Additionally, the F-5 has extended its
described in sequence. operational capability, which generates a more severe load
spectrum. Figure 3 depicts how an increase in spectrum severity may impact the range of non destructive inspection interval. To properly account all this changes, a comprehensive damage tolerance analysis was necessary, which is described in the next section.
Figure 4: DTA Flowchart.
• Data Collection:
Figure 3: Impact in the range of NDI interval.
The data compilation must satisfy the specification content in section 3.2.2 of the Military Standard
MIL-THE F-5 DTA PROCESS
A-8866B. The F-5M Flight Data Recorder (FDR) can
The damage tolerance analysis (DTA) comprises several store data such as altitude, Mach, speed and load factors. The data is recorded in average frequency of 10Hz and is steps. The first step is to determine the way the aircraft is
disposed into XML files. These files are downloaded at the operated in each squadron. This step requires performing
Case 1 2 3 4 Weight (lb) 12797 12797 11917 11917
Fuel Weight (lb) 2200 2200 1320 1320 Flap Def. (°/°)
0/0 12/8 12/8 12/8 Alt. (ft) 15000 15000 30000 5000 Stress (ksi) 14.16 19.40 16.14 20.78
Data Collection
Fatigue Data Selection
Data Edition and Pre-Analysis
Data Reduction
Stress Sequence
Crack Growth Analysis
Air Force Bases and are used during flight debriefing. F5DACOM creates a new file with all the supplementary figure 5 shows an example of the data of a XML flight file. data. This new file and the XML flight files are sent to the The size of total flight files normally exceeds 100 MB. Institute of Aeronautics and Space (IAE) for analysis. Figure 7 illustrates the main tasks in the collection data process. First, the squadrons download the XML files from the FDR and run the F5DACOM software. Then, the files are sent to IAE by mail (DVD) or through the internet (FTP).
Figure 7: Data collection methods.
• Fatigue Data Selection:
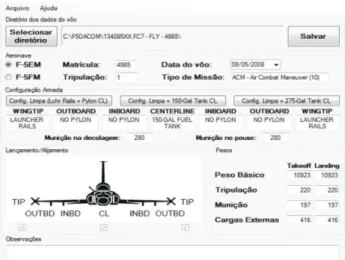
The fatigue data pre-selection consists in applying a Figure 5: Part of an XML file from F-5M FDR. filtering process to the original data, in order to keep only the events considered significant for the pre-analysis phase and the remaining DTA process.
Some relevant information of the flights is not registered by
the FDR. Therefore, the XML files must be supplemented In order to accomplish this phase, a computer program to make them useful for the next DTA steps. Computer named SEDAF was developed (Ribeiro, 2009). The software (F5DACOM) was developed to include this SEDAF software performs a filtering process and supplementary data for the flight files (Ribeiro, 2008). eliminates unnecessary data by selecting peaks and valleys of the load factors, which are the most important values for This software is used by the Air Force Bases, so that the DTA. This procedure reduces the average package of information such as configuration, external stores and information from 100MB to 300KB through a complex events during the flight (weapons launched/released or process involving dozens of XML files from the aircraft’s refueling) are recorded. Figure 6 shows the main screen of data acquisition system. SEDAF uses three triggers to do the F5DACOM software. this: one for normal load factor (N ), one for lateral load
z
factor (N ) and another for time. The values of these triggers y are 0.5 g, 0.1 g and 30 s for N , N and time, respectively. z y These values were based on historical data where it was noticed that variations of N smaller than 0.5 g and z variations of N smaller than 0.1 g did not contribute y significantly to the fatigue analysis for this type of aircraft. The software also selects events at every 30 s. Although another filtering will still be performed in the next steps, the amount of remaining data is necessary for flight viewing during the data edition and pre-analysis stages.
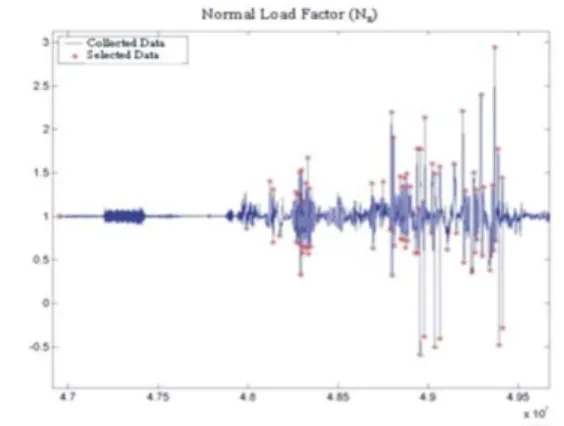
Figure 8 shows an example of the filtering performed by SEDAF. Red marks are points kept for further analysis. SEDAF continues calculating the weight reduction during the flight caused by events related to weapon systems such as launched missiles, released bombs, released chaffs/flares and the ammunition fired.
Figure 6: F5DACOM screenshot (Ribeiro, 2008).
IAE Squadrons
F5DACOM
(Supplementary Data) (XML Files)FDR
manufacturer, performed various tests to determine how the configuration and maneuver types affect the airframe structure.
To properly define the structural impact during a flight event, the maneuvers are divided into three types: symmetrical, roll and abrupt pitch.
• Symmetrical maneuver is characterized by having no significant variation in angles of roll, yaw or pitch. Usually, the lateral load factor (N ) is very small.y
Figure 8: Result from pre-selection for pre-analysis. • Roll maneuver is characterized by its significant variation in roll angle along time and its non-zero value for N .y
• Data Edition and Pre-Analysis:
• Abrupt pitch maneuver is characterized by a The purpose of pre-analysis is setting the data for the next wide variation of pitch angle in a short period steps of the DTA program. The data must be collected and of time, with no significant change in yaw or pre-analyzed according to Military Standard MIL-STD- roll movement. Such maneuvers have major 1530, section 5.4.4 and AFWAL-TR-8278, section 5.3.2. importance in DTA due to the high impact on The software EPAD F-5M was developed specifically to the horizontal tail structure.
accomplish this task (Mello Jr., 2008). Each flight,
previously filtered by SEDAF, must be edited and pre- During a flight, the aircraft is subjected to different analyzed by the EPAD F-5M. The information contained in conditions of weight, altitude, Mach, load factors and flap each file can be viewed and edited as a table or graphically. position caused by different maneuvers and events. Based It allows the user to check and fix any discrepancies in all on these conditions, EPAD associates a representative flight the data. condition (RFC) to every point in a flight. These RFCs were previously tested during the Northtrop flight tests The first step of pre-analysis is to define the flight phases, campaign, when the loads of the aircraft structure were such as: climb, cruise, primary, cruise, descent and measured.
approach. This marking of the flight phases requires some user's experience due to the nuances of each flight mission.
EPAD allows two cruise phases, one before and another • Data Reduction: after the primary. Figure 9 shows an EPAD chart screen,
where the flight phases can be seen in the altitude and N z The pre-analyzed data generated by EPAD still represents
plots. very large amounts of information and most of these are
unnecessary for the fatigue life analysis. Thus, it is necessary to identify the most relevant peaks and valleys of N . This data reduction process is performed in accordance z with MIL-STD-1530 standards, sections 5.4.4.2 and 5.4.4.3, MIL-A-8866B, Section 3.2.2 and manual AFWAL-TR-823078, Section 5.3.2. These standards define criteria to count cycles, commonly used for fighters and known as conventional counting. The criteria define rules about peaks and valleys, as follows:
A peak needs to be:
o the largest value between two valleys;
o preceded and followed by valleys whose differences between peak (p) and each valley Figure 9: EPAD screenshot.
(vi) are not lower than 50% of peak value less one, i.e.:
The flap position is a very important parameter that is not
recorded in real time. It is determined by EPAD based on (1)
flight conditions for each event (angle of attack and
concentration. F-5M has a total of 41 FCLs: 10 points at the A valley needs to be:
wing, 7 at the fuselage, 2 at the attachment region of the engines, 4 at the vertical tail, 2 at the horizontal tail and 16 at o the lowest value between two peaks;
the region called "ziploc". o at least 1g lower than the previous and next
peaks.
Each FCL has different stress distributions, because they are at different locations of the aircraft, and also involve Figure 10 shows an example of the counting process for a
different materials and geometry. few events.
The Northrop flight test campaign determined the loads acting on points distributed over 12 stations, taken in relation to a reference datum. Each FCL is associated with one of these stations. The loads are determined based on the type of maneuver as follow:
- Load calculations: o Symmetrical
For a given FCL, the associated station has some related symmetrical RFC. Each RFC has 3 listed values of N . Each z N value has the forces and moments measured during flight z tests at that station. Thus, the forces and moments for a given N referred to that specific FCL and RFC can be z Figure 10: Conventional counting criteria. calculated through a linear interpolation.
o Roll Figure 11 shows the real flight spectrum of N using data z
reduction process. The remaining points have been plotted The loads due to roll maneuver are calculated in two steps. in red. As can be seen, at the beginning of the flight, there is The first one determines the symmetric loads and the a low N level which is related to the climb and cruise z second one calculates the asymmetric loads, caused by
phases. rolling events, which will be added to the symmetrical
loads. The additional loading caused by the roll maneuver is Each flight event that remains at this stage is registered extracted directly from a table by searching the closest according to the type of mission, the flight phase in which it value of N . The roll loads are tabulated for a roll rate of z occurred, the RFC associated and the aircraft weight. After 100°/s. To be properly accounted for, the load must be this step, the full discrete spectrum can be generated, adjusted for the actual maneuver roll rate.
normally representing 1,000 flight hours per type of
mission. o Abrupt Pitch:
Figure 12 shows a typical time history during abrupt pitch maneuver. There are two instants in time that have relevant importance: the entry part where the maximum down tail load is developed and the check part where the most positive tail load occurs. These points are identified as “Entry” and “Check”.
Figure 11: Result from the counting process. (Mattos, 2008).
• Stress Sequence:
There are points in a structure where the possibility to
Figure 12: Typical Abrupt Pitch Maneuver (Northrop, develope cracks is higher. They are called Fatigue Critical
For each event, N “Entry” and “Check” are calculated and z • Establishing an Inspection Plan: compared with N valley and peak, respectively. The lower z
With the information obtained in the residual strength and value between N “Entry” and valley is chosen and the z
crack growth curves, the inspection intervals can be higher value between N “Check” and peak is chosen. Then, z established for the referenced FCL, depending on the the total load is calculated adding abrupt load to the inspection method chosen. The final work related with DTA corresponding symmetric load. is an interactive phase with the Maintenance Depot and End User. The proposed inspection interval may be slightly - Stress-to-load ratios and stress spectra: changed to keep the aircraft maintainable and operational. A previous step enabled to know the exact loads acting on a
specific region of the airframe, as a maneuver occurs. RESULTS However, for each FCL it is necessary to know the actual
stress the structure is subjected to. These stress-to-load The F-5M DTA Program will be completed in August 2009. ratios were obtained by static and fatigue tests of The following results are preliminary because only a small instrumented aircrafts and also finite element analysis using amount of data was available at this point. However, they
TM
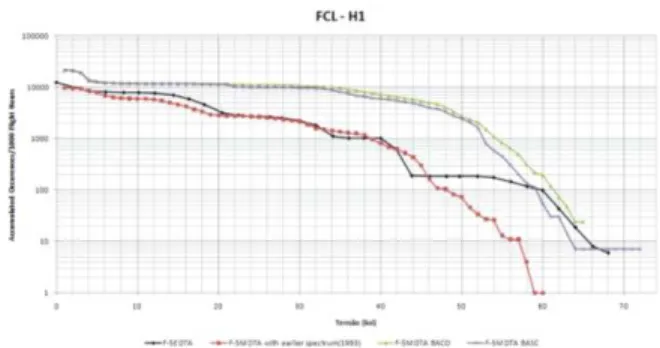
the NASTRAN software. show how changes in weight and mission profiles may impact differently in different FCLs of the F-5M. Figures A dedicated computer program was created to generate the 14, 15 and 16 depict the stress spectra for fuselage, FCL's stress spectra for each FCL, GCTAF F-5M (Mello Jr., wing and stabilizer, respectively.
2009). By using the load spectrum from the counting process and all other parameters, such as maneuver conditions, mission mix, and the stress-to-load rations, the GCTAF software generates a stress spectrum for each FCL that is used by the crack growth analysis software.
• Crack Growth Analysis:
The next step of a DTA program is to determine how the structure would behave in the presence of cracks. The Crack 2000 software (Mello Jr., 1998) was developed to provide
an automated Damage Tolerance Analysis to FAB aircrafts. Figure 14: FCL F3o: Edge of Fwd Upper Longeron Its primary capability is to calculate the fatigue life and
crack instability of structures subjected to cyclic loading
which contain initial flaw defects. The black curves represent the stress spectra for the original F-5E DTA. The red curves were generated by using the new stress-to-load ratios, keeping the original F-5E g-spectrum. The user has to input a spectrum, geometry and material
The comparison of these two curves shows how the weight properties, and choose some options like the retardation
and balance changes affect the stress level. The blue and effect. The output files have all the necessary information
green curves are generated with new stress-to-load ratios for a complete DTA, such as residual strength and crack
and new g-spectrum for the F-5M fleet operating at BACO growth graphics (Fig. 13). The residual strength is the
and BASC, respectively. It can clearly be seen that the resistance that the structure withholds in presence of a
“new” aircraft with new operational profile is subjected to crack, while the crack growth curve shows the time required
higher stress levels, which consequently imply in a more for the crack to reach its critical size.
restrictive maintenance schedule. The wing is the component that has minor variation in stress levels, with the new result very close to the original one (fig. 15).
CONCLUSIONS
The implementation of the F-5M DTA Program allows FAB to recognize how the squadrons operate the aircrafts and how modernization can impact its structural life. The results will also help FAB to better use its resources, such as aircraft, spare parts, ground equipment and personnel. The old fighter was upgraded and now the new vector is heavier, but is also capable of performing a wider variety of missions. The only way to guarantee the flight safety is to know how the structure will behave in this new scenario. Figure 16: FCL H1: Horizontal Tail. The tasks of a comprehensive DTA are evolving and are complex. With the available flight data, the assessment of stress spectra for fuselage, wing and horizontal tail FCLs As an example of the F-5M upgrade impact in structural was performed. The preliminary results show that some life, the FCL H1 was analyzed using the Crack 2000 FCLs can have a major change in stress levels, which lead to software (Mello Jr. 1998). For the purpose of comparison, different crack growth curves and different inspection the model used was the same as Wieland (1995). The intervals. Therefore, it is clear that the evaluation of DTA geometry and the other parameters for the analysis are will contribute directly to the maintenance procedures at the described in the Crack 2000 output file, which is displayed F-5 Depot. The F-5M DTA Program will enable the
below. Brazilian Air Force to accomplish its missions with the
certainty that the structural safety is assured. CRACK GROWTH DATA
Crack 2000 V. 3.0 (1998) - (c) 1995 REFERENCES Alberto W S Mello, Jr. All rights reserved.
Run date = 11-11-2008 Run Time = 15:42:29 AFWAL-TR-82-3073, 1984, “USAF Damage Tolerant Cycle-by-Cycle Analysis Design Handbook: Guidelines for the Analysis and Design AISI-SAE 4330V MOD, 180-200 UTS (Plt / Forg) of Damage Tolerant Aircraft Structures”. Wright-Patterson Ys = 186 Uts = 190 AFB Ohio, Final Report.
Kc = 165. Kic = 112 Kie = 150
Superposition: Burnside, H., 1993, “Flying Longer: With Confidence”,
Rten = 1 Rben-W = 0 Rben-t = 0 Rpin = 0 Technology Today. Crack Growth Model:
Forman et al (1990) Mattos, D.F.V., 2008, “Análise de Dados de Vôo das Corner Crack at Edge of Plate
Aeronaves F-5M Para Cálculo de Vida em Fadiga”, pp.18-Geometry:
74, Graduation Work, ITA, São José dos Campos. W = 2.54 t = 2.13
Two-dimensional - Varying Crack Shape
Mello Jr., A.W.S., 1998, “Crack 2000 Program: Software No retardation Model
for Practical Fracture Mechanics and Damage Tolerance Analysis”, User's Manual, IAE, São José dos Campos. Figure 17 shows the crack growth curve for the original and
the new DTA. It can be seen that the time for a crack to grow
Mello Jr., A.W.S. et al., 2008, “Edição e Pré-Análise de from 0.05 in to 0.85 in was reduced in more than 30%. This
Dados Operacionais do Projeto DTA F-5M: Software denotes a change in the inspection interval that will be
EPAD F-5M”, IAE, São José dos Campos (RENG ASA-I proposed to the Maintenance Depot.
03/08).
Mello Jr., A.W.S. et al., 2009, “Geração de Ciclo de Tensões para Análise de Fadiga. Software GCTAF F-5M”, IAE, São José dos Campos (Submitted for approval).
Northtrop Corporation, 1977, “F-5E/F Fatigue Loads for the Damage Tolerance Assessment”, Hawthorne, CA, (NOR 76-164)
RIBEIRO, F. N., 2009, “Procedimentos para a Seleção de Dados de Fadiga das Aeronaves F-5EM e F-5FM utilizando o Programa SEDAF”, IAE, São José dos Campos (Submitted for approval).
USAF, 1975,“Aircraft Structural Integrity Program: Airplane Requirements”. Wright-Patterson AFB Ohio, FSG-15GP, (MIL-STD-1530).
USAF, 1974, “Airplane Damage Tolerance Requirements”. Wrigth-Patterson AFB. Ohio, (MIL-A-83444).