?í
2
.I
>-(1t
3
~~~~~~~~~
'A
1CT
3
ALE.
3
A
S
AL
A.ED
ISSN 0256-1859 Vol. 10 No. 2, 1989
Mortality Analysis
-
Some New Uses for Old Indicators
Death itself cannot be prevented. It can, however, be postponed. The public health importance of this fact has long ago motivated the development of measures for the analysis of mortality statistics, tra-ditionally one of the main tools of public health planners and administrators for assessment of health status, definition of priorities and allocation of resources, and surveillance of specific health *roblems.
It is equally recognized that nonviolent death is but the last event in a continuum of progressively worse health; mortality statistics tell a very incom-plete story about disease and suffering, and even less about individual and societal determinants of ill health. However, up to now a satisfactory opera-tional definition of "good" health does not appear to exist, neither at the individual nor at the community level. Nor is it clear whether such a definition would be at all feasible, and if so, whether it would be the same for all members of a community and commun-ties everywhere "'. Furthermore, those variables that have been accepted as being both sensitive and specific enough to contribute to the assessment of health status are usually difficult to document and much too expen-sive to obtain for population-wide use.
IN THIS ISSUE...
· Mortality Analysis-Some New Uses for Old Indicators
- Chronic Disease Reports in the Morbidity and Mortality
Weekiy Report (MWWR)
AIDS Surveillance in the Americas
Accordingly, and without giving up the search for appropriate indicators of positive health, increased efforts are being devoted to the development of
indi-cators based on death statistics, thus acknowledging that the potential information on health status to be extracted from mortality data is still far from exhausted. Mortality rates specific for sex, age, cause, place of residence and other social and eco-nomic characteristics of the decedent continue to be the cornerstone of this information, but specific rates are cumbersome to analyze. Crude and age-adj usted (standardized) mortality rates, however, share the major shortcoming of being dominated by mortality at old ages, at which most deaths occur and disease is harder to prevent. Summary measures are needed that, while assessing the impact of mortality as a whole will better reflect changes in those problems that exact their toll at an early age, and highlight the age groups in which this impact is felt the most. Woolsey '2'and Uemura "'in their search for achieva-ble target rates for the United States of America (USA) and worldwide, respectively, have discussed numerous approaches and have given abundant ref-erences to this effect. They provided both back-ground and stimulus for the discussion presented here.
· Epidemiological Activities in the Countries
· Diseases Subject to the International Health Regulations * Triennial Meeting of the International Epidemiologiocal
Association
This renewed interest in mortality statistics can only be welcomed, as, in the words of Shapiro (4I:
... they represent the only continuous source of information on an unequivocal manifestation of health status that dates back many years and is assured of conti-nuity into the foreseeable future, and the data can be examined on a geographically disaggregated level often down to subareas within a city, for example, or aggregated across civil subdivisions...
According to this author, the challenge of "how to maximize the utility of this resource" is of special relevance to public health officials in developing countries, who are understandably reluctant to use scarce resources for the gathering of additional information on health problems, rather than for their prevention or alleviation.
Objective
This paper will present a discussion of the scope and limitations of some simple procedures to analyze usually available data for (a) estimating gains in mor-tality from all causes assessed against a country's own past experience, and (b) quantifying the gap between the country's current mortality situation and one observed in a more developed country.
Procedures
Excess mortality will be defined empirically; to
estimate it two indicators will be used: the standard-ized mortality ratio (SMR), and the ratio of observed over expected years of potential life lost (RYPLL). Premature mortality will be defined as that occurring under 65 years of age. Both indicators will be com-puted for each sex; the SMR will be comcom-puted for premature mortality and for all ages. To compute age-specific frequencies age groups are defined as follows: under 1 year of age, 1-4 years, 1 O0-year groups from 5 to 64 years, and 65 years and above.
Data from Argentina and Mexico will be used to illustrate the proposed procedures. These two coun-tries have been chosen as examples because their population size prevents excessive instability of observed frequencies, and mortality data by age and sex are available for more than two decades.
To analyze past experience each country's data for 1982 will be compared to its own data 20 years earlier. As reference for a more favorable situation the 1982 data for the largest developed country in the Region, i.e. the United States of America (USA) will be used. As the analysis will be centered on the year 1982, both to assess progress against the past as well as to size up the challenges still ahead, the reference popu-lation will be the mid-year popupopu-lation estimate for 1982 for Argentina and Mexico. To stabilize the data the number of deaths for each of the years to be studied will be estimated to be the 3-year averag* centered in that year. Thus, deaths for 1982 and 1962 will be understood to be the average number of deaths occurring in the years 1981-1982-1983 and 1961-1962-1963 respectively, as shown in Table 1.
Table 1. Midyear population and number of deaths Argentina and Mexico, 1982.
Argentina Mexico
Age Populationa{' Deaths( b' Population a) Deaths{ b ) groups
M F M F M F M F
Under 1 353 339---- 1,702 9,127 1,198 1,152 45,548 35,494 1-4 1,346 1,308 '1,9-54_ 1,665 4,849 4,676 11,897 10,898
5-14 2,743 2,666 1,439 ---- 972 10,595 10,237 8,148 5,434
15-24 2,410 2,347 2,784 1,602 7,479 7,295 17,371 6,854 25-34 2,170 2,116 3,658 2,376 4,823 4,836 18,309 7,325 35-44 1,729 1,712 6,469 3,825 3,070 3,187 18,640 9,054 45-54 1.534 1,566 14,227 6,891 2,109 2,239 20,729 12,146 55-64 1,166 1,268 23,787 11,872 1,346 1,492 23,774 16,706
Under 65 13,451 13,322 66,020 38,330 35,469 35,114 164,416 103,911 65+ 1,050 1,333 67,868 64,100 1,178 1,424 68,274 69,885
All ages 14,501 14,655 133,888 102,430 36,647 36,538 232,690 173,796
(a) Midyear population estimate for 1982, in thousands.
(b) Average of the deaths registered for 1981, 1982 and 1983. Excludes a yearly average of 2,541 deaths of unknown sex and 7,647 of unknown age in Mexico, as well as 297 deaths of unknown sex and 5,479 of unknown age in Argentina.
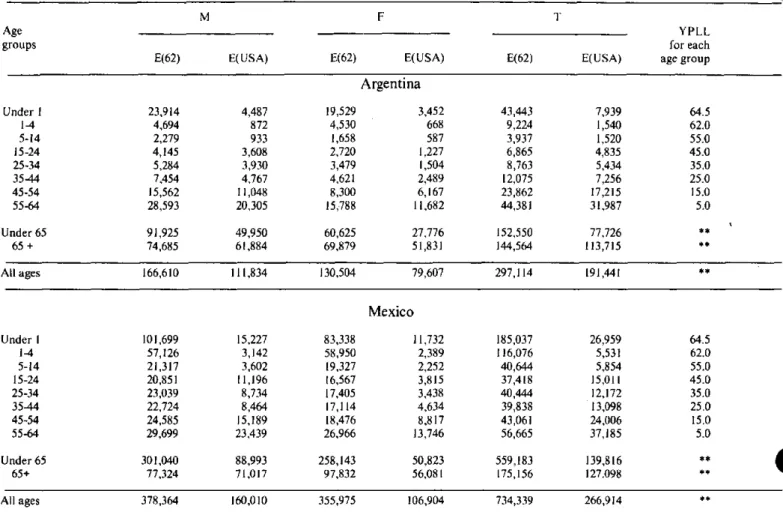
Computation of expected mortality will vary according to the purpose of the analysis. For evalua-tion of gains achieved, expected deaths will be those that would have occurred if the 1982 population had been subjected to the 1962 age- and sex-specific rates of the same country. To compare with a more favora-ble health situation, expected deaths will be com-puted applying the 3-year 1982-centered age and sex-specific death rates of the USA to the 1982 population of Argentina and Mexico. Specific rates are shown in Table 2; expected numbers of deaths are shown in Table 3 for each sex and both sexes combined, the latter obtained by addition of male and female deaths. The overall SMR is computed by dividing total observed by total expected deaths; the SMR for mor-tality under 65 is restricted to the ratio of observed and expected deaths below that age limit; and the RYPLL is the ratio of the observed YPLL and those expected. The last column of Table 3 shows age-specific YPLL per death, i.e. the average YPLL for each death in every age group, obtained by subtract-ing the mid-point of the age interval from 65, the upper limit. Observed and expected YPLL are com-puted by multiplying (weighting) these age-specific YPLL per death by the observed and expected number of deaths respectively, and adding over all age groups up to but not including 65.
Results
In accordance with the purpose of this paper,
pres-entation of results will focus on the indicators rather than on the health situation of the two countries chosen as examples.
The SMR for all ages, the SMR for deaths occur-ring before age 65, and the RYPLL, also for deaths prior to age 65 are compared in Table 4. The interpre-tation of these indicators is simple enough to use them for conveying messages to the general public or authorities not trained in public health: in Argentina the number of male deaths observed in 1982 repres-ents 80.4% of those which would have been expected if the 1962 rates had prevailed; i.e. 19.6% of expected male-and 21.4% of expected female-deaths were avoided due to the reduction in mortality rates expe-rienced since 1962. Similarly, there were savings of 38.5 and 51.2% of expected deaths for men and women in Mexico. Under age 65, the observed sav-ings for each 100 deaths expected were 28.2% for men and 36.8% for women in Argentina and 45.4 and 59.7% respectively in Mexico.
With respect to the RYPLL, for each 100 YPLL expected in the 1982 population if 1962 rates had prevailed, observed data show a reduction of 41.2 and 47.2%, and 54.3 and 64.8% for men and women in Argentina and Mexico respectively. In this example it is clear that the SMR under 65 is more sensitive to rate changes than the S M R for all ages, and the RYPLL is the most sensitive of all.
Table 2. Mortality rates by age and sex Argentina and Mexico, 1962 and 1982; USA, 1982.
Mexico
1962 1982
M F M - F
_
C
USA
1982
M F
Under 1 6,774.5 5,760.7 3,315.0 2,692.3 8,489.1 7,234.2 3,802.0 3,0781.1 1,271.0 1,018.4 1-4 348.7 346.3 145.2 127.3 1,178.1 1,260.7 245.3 233.0 64.8 51.1 5-14 83.1 62.2 52.5 36.5 201.2 188.8 76.9 53.1 34.0 22.0 15-24 172.0 115.9 115.5 68.3 278.8 227.1 232.3 94.0 149.7 52.3 25-34 243.5 164.4 168.6 12.3 477.7 359.9 379.6 151.5 181.1 71.1 35-44 431.1 269.9 374.1 223.4 740.2 537.0 607.1 284.1 275.7 145.4 45-54 1,014.5 530.0 927.4 440.0 1,165.7 825.2 982.9 542.5 720.2 393.8 55-64 2,452.2 1,245.1 2,040.1 936.3 2,206.5 1,807.4 1,766.3 1,119.7 1,741.4 921.3 65+ 7,112.9 5,242.2 6,463.6 4,808.7 6,564.0 6,870.2 5,795.8 4,907.7 6,156.4 4,380.0
All ages 1,005.9 706.3 923.3 698.9 1,129.6 1,017.1 634.9 475.7 943.2 777.0
Note: Rates per 100,000 population were computed using as numerator one third of the deaths registered for 1961, 1962, 1963, and for 1981, 1982, 1983 espectively, and as denominator the midyear population for the middle year, i.e. 1962 and 1982 respectively.
Vource: PAHO technical data base.
3
Age groups
Argentina
1962
M F
1982
Table 3. Deaths expected in 1982 population of Argentina and Mexico according to country's 1962 rates and US rates for 1982.
t
M
E(62) E(USA)
F
E(62) E(USA)
T
E(62) E(USA)
Argentina
Under 1 23,914 4,487 19,529 3,452 43,443 7,939 64.5
1-4 4,694 872 4,530 668 9,224 1,540 62.0 5-14 2,279 933 1,658 587 3,937 1,520 55.0 15-24 4,145 3,608 2,720 1,227 6,865 4,835 45.0 25-34 5,284 3,930 3,479 1,504 8,763 5,434 35.0 35-44 7,454 4,767 4,621 2,489 12,075 7,256 25.0 45-54 15,562 11,048 8,300 6,167 23,862 17,215 15.0 55-64 28,593 20,305 15,788 11,682 44,381 31,987 5.0
Under 65 91,925 49,950 60,625 27,776 152,550 77,726 **
65 + 74,685 61,884 69,879 51,831 144,564 113,715 **
All ages 166,610 111,834 130,504 79,607 297,114 191,441 **
101,699 57,126 21,317 20,851 23,039 22,724 24,585 29,699 301,040 77,324 378,364 15,227 3,142 3,602 11,196 8,734 8,464 15,189 23,439 88,993 71,017 160,010 83,338 58,950 19,327 16,567 17,405 17,114 18,476 26,966 258,143 97,832 355,975 Mexico 11,732 2,389 2,252 3,815 3,438 4,634 8,817 13,746 50,823 56,081 106,904 185,037 116,076 40,644 37,418 40,444 39,838 43,061 56,665 559,183 175,156 734,339 26,959 5,531 5,854 15,011 12,172 13,098 24,006 37,185 139,816 127.098 266,914 64.5 62.0 55.0 45.0 35.0 25.0 15.0 5.0 +* **
Table 4. Comparison of standardized mortality ratios for all ages and under 65 years and ratio of years of potential life lost Argentina and Mexico, 1982.
Indicators M F T
Past experience (1962) Future reference (USA)
SMR all ages SMR under 65 RYPLL
1MR-a.1LL es
SMR
under65-RYPLL Argentina 80.4 71.8 58.8 119.7 132.2 157.4 78.6 63.2 52.8 128.8 138.0 187.7 79.6 68.4 56.2 123.5 134.3 168.4 Mexico
Past SMR all ages 61.5 48.8 55.4 experience SMR under 65 54.6 40.3 48.0
(1962) RYPLL 45.7 35.2 40.8
Future SMR all ages 145.4 162.6 152.3 reference SMR under 65 184.8 204.5 191.9 (USA) RYPLL 235.0 263.9 245.8
Note: All ratios multiplied by 100.
Source: Tables I and 3.
Age groups
YPLL for each age group
The greater sensitivity to change of the RYPLL can also be appreciated when a more favorable set of sex-and age-specific rates-such as those of the USA-is used for comparison. Under these reference rates the YPLL observed exceed those expected far more than the deaths did, as evidenced by the magnitude of the RYPLL in comparison to that of the SMRs.
It should be kept in mind that SM Rs and RYPLLs of different countries should be compared only to the extent that one would compare crude rates, as the population of each country is used in both numerator
and denominator (5. By the same token this simplifies
interpretation, since the only difference in numerator and denominator of each ratio derives from the mor-tality rates used.
Discussion
Indicators for excess and premature mortality can be computed for any age-specific subgroup of the population, and there has been much discussion about how they should be defined. But, as Haenszel (6)
says, the problem
... is not on the mechanics of rate
con-struction but in definition of terms and deciding what is to be measured. The choice of a rate under one criterion would not necessarily preclude the use of another rate under different circumstances...
This statement applies equally to age-limits and reference rates, the selection of which should be guided by the purpose of the analysis.
All three indicators presented here, namely the SMR for all ages and for deaths occurring prior to age 65 and the ratio of observed over expected YPLL were selected because they are simple to use for the purpose at hand. This is the main reason why YPLL were given preference over indicators derived from life tables; the fact that they use observed data was an added consideration.
In their excellent discussion of the main issues involved in the construction and use of the YPLL, the Centers for Disease Control point out that instead of using a common fixed limit the life expectancy remaining for each age group could be used as that group's upper limit '7. It is felt, however, that this would detract from one of the main appeals of this indicator, namely its simplicity.
The 65-year age limit was chosen in this paper because, on a population-wide basis, mortality at 65 years and above appears to be more difficult to post-pone; it should not be interpreted to imply a limit to ~conomically active or potentially productive life. owever, this cut-off point can be varied according
to a country's circumstances and the purpose of the analysis.
Another choice involves the reference rates to be used, especially when assessing the gap between what is and what could be. Again, this choice is entirely dependent on the purpose and intentionality of any given analysis, and the decisions to be based on it.
An important application of these indicators would be their use to highlight differentials and inequalities within a country. Thus, on a subnational level, the reference rates could be those of that region or area in the country exhibiting the least unfavorable sanitary conditions, as Farr proposed over 150 years ago. This idea is especially attractive since in almost all countries of the Americas there exist mortality statistics of sufficient completeness to do this com-parative analysis for mortality from all causes. The S M R under age 65 or the RYPLL should be excellent evaluation tools, since they use a country's or area's own population and thus assess the health status from within that area and in regard to itself.
The ratios discussed are not meant to be used instead of the more traditional indicators, but as their complement. The level of mortality is still best mea-sured by mortality rates. When comparisons over time or among countries or different areas within any one country are desired, rates adj usted for age (by the so-called direct method) will still be the indicator of choice. However, the RYPLL will be an excellent complement for the assessment of differentials and inequalities, of gains achieved and challenges ahead. But, since ratios only express the relation between two numbers, saying nothing about the size of either one, they should not be used without an indicator providing a yardstick for the size of at least one of the ratio's components.
The procedures presented are geared towards analyses to be used by a country or subnational area for its own benefit. It is hoped that countries in the Americas and elsewhere will replicate this exercise and enrich it with their own perspectives and expe-rience.
References
"'Nájera, E. Perspectives and prospects. In: Buck, C. et al (eds) The Challenge of epidemiology. Issues and selected readings. Scientific Publication No.
505. Washington, D.C. Pan American Health Organization, p. 974, 1988.
'2'Woolsey, T. Toward an index of preventable
mor-tality. Vital and Health Statistics, Series 2, No. 85, National Center for Health Statistics, OHRST, PHS, DHHS. May, 1981.
3'Uemura, K. Excess mortality ratio with reference
to the lowest age-sex-specific death rates among countries. Wld hlth statist. quart. 42(1):26-41, 1989.
''Shapiro, S. A tool for health planners. Am J Pub-lic Health, 67(9): 816-817, 1977.
"''Rothman, K.J. Modern epidemiology. Boston/
Toronto, Little, Brown and Company, pp 45-49, 1986.
Ó''Haenszel, W.A. Standardized rate for mortality defined in units of lost years of life. Am J Public Health, 40: 17-26, 1950.
'7Centers for Disease Control. Premature mortality
in the United States: public health issues in the use I of years of potential life lost. M WWR, 35:2S, 1986.
(Source: Health Situation and Trend Assessment
Program, PAHO. Based on Plaut, R. and Roberts, E. Preventable mortality: indicator or target? Applications in developing countries. Wld hlth
sta-tist. quart. 42(1):4-15, 1989.)
Chronic Disease Reports in the Morbidity and Mortality
Weekly Report
(MMWR)
Introduction
In 1986, 1.58 million people in the United States of America (USA) died from six major chronic dis-eases: cardiovascular and cerebrovascular diseases, chronic obstructive pulmonary disease, chronic liver disease and cirrhosis, malignant neoplasms, and diabetes. These deaths accounted for 75% of all
USA deaths "'. In comparison, unintentional
injur-ies, suicides, and homicides accounted for 7% of mortality, acquired immunodeficiency syndrome for 0.5%, and other infectious diseases for an
addi-tional 8%. For many chronic diseases, means of primary, secondary, or tertiary prevention are well
known "2.3 It has been estimated that many deaths
caused by these six chronic diseases could have been prevented by various means, for example, by effec-tive control of smoking, blood pressure, diet, ancw
alcohol consumption (2 s
From January 1989, the MMWR publishes
monthly Chronic Disease Reports (CDR) to pro-vide basic information on chronic disease mortality, associated risk factors, and preventive measures.
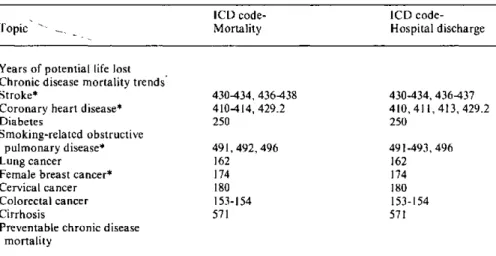
Table 1. Topics included in the MMWR CDR with ICD codes where appropriate.
ICD code- ICD code-Topic Mortality Hospital discharge
Years of potential life lost Chronic disease mortality trends
Stroke* 430434, 436438 430-434, 436437 Coronary heart disease* 410414, 429.2 410, 411,413, 429.2
Diabetes 250 250
Smoking-related obstructive
pulmonary disease* 491,492, 496 491-493, 496
Lung cancer 162 162
Female breast cancer* 174 174 Cervical cancer 180 180 Colorectal cancer 153-154 153-154
Cirrhosis 571 571
Preventable chronic disease mortality
*CDR groupings of ICD codes differ from groupings used by NCHS and WHO.