ARTIGO ARTICLE
1 Programa de Pós-Graduação em Epidemiologia, Universidade Federal do Rio Grande do Sul. R. Ramiro Barcelos 2600/414. 90035-003 Porto Alegre RS. maria.schmidt@ufrgs.br
Desigualdades de gênero na mortalidade
por doenças crônicas não transmissíveis no Brasil
Gender inequalities in non communicable disease mortality
in Brazil
Resumo A carga de doença atribuída às doenças crônicas não transmissíveis (DCNT) está aumen-tando globalmente, sendo em geral maior em ho-mens. O objetivo deste artigo é descrever os dife-renciais por gênero na mortalidade e tendências por DCNT no Brasil. Taxas padronizadas de mor-talidade foram calculadas para os anos 1991-2010 após correção por subregistro e causas mal defini-das, empregando faixas etárias de cinco anos es-pecíficas para homens e mulheres. As tendências foram analisadas com modelos de regressão joinpo-int. Em 2010 as taxas para todas as DCNTs (ho-mens: 479/100000; mulheres: 333/100000) e para os principais grupos de DCNTs (doenças cardio-vasculares, câncer, doenças crônicas respiratórias e outra doenças crônicas) eram mais altas em ho-mens. Entre 1991-2010, observou-se um declínio nas taxas padronizadas de mortalidade, em ho-mens e mulheres, iniciando em 1993, e tornado-se menos intenso em anos recentes. A probabili-dade incondicional de morrer entre as iprobabili-dades de 30 e 70 devido a um dos quatro principais grupos de DCNTs baixou de 1993 até 2010 de 32,3% para 22,8% em homens, e de 23,5% para 15,4% em mulheres. Concluindo, apesar do notável declínio nas taxas padronizadas de mortalidade por DCNT nas últimas duas décadas, o predomínio em ho-mens persiste e, a se manter essa tendência, em termos relativos, irá aumentar.
Palavras-chave Doença crônica, Brasil, Morta-lidade, Sexo
Abstract The relative burden due to non com-municable diseases (NCD) is increasing world-wide and has been shown to be generally greater for men than women. The objective of this paper is to describe gender differences in NCD mortality rates and trends in Brazil. Standardized mortality rates for the years 1991-2010 were corrected for sub notification and ill defined causes of death and calculated using sex specific five year age grades. Trends in standardized mortality were studied using joinpoint regression models. In 2010, rates for NCDs (men: 479/100000; women: 333/100000) and for most major NCD categories (cardiovascu-lar diseases, cancer, chronic respiratory diseases and other chronic diseases) were higher for men than women. Age standardized mortality rates declined for both sexes over the period, beginning in 1993 and attenuating in more recent years. From its peak in 1993 to 2010, the unconditional probability of dying between the ages of 30 and 70 due to one of the four principal NCD groupings decreased for men from 32.3% to 22.8%; for wom-en, from 23.5% to 15.4%. In conclusion, age stan-dardized NCD mortality, though decreasing dra-matically over the past two decades in Brazil, re-mains notably greater in men than in women and, this difference, in relative terms, will increase if these trends continue.
Key words Chronic disease, Brazil, Mortality, Sex
Antony Stevens 1
Maria Inês Schmidt 1
Stevens A
Introduction
The burden due to non-communicable diseases (NCDs) is increasing world-wide, posing a great threat to the development of the nations1,2. If
cur-rent tendencies continue, a recent study estimates that the cost of NCD to the world´s economies over the next two decades could reach US$47 tril-lion; and for Brazil, the annual cost could reach 4% of the gross national product3. These global
challenges, with particular reference to the low-and middle-income countries, have been widely discussed in recent years, culminating with the High-Level meeting of Heads of State held at the United Nations in September, 20114.
Brazil has developed a strategic plan to deal with the NCD burden5. The main lines of the
plan are based on the Action Plan developed by the World Health Organization (WHO)6.
Atten-tion is focused on four main groups of diseases (cardiovascular, cancer, chronic respiratory and diabetes). As an indicator to measure the progress towards the established goals related to mortal-ity from NCD, the WHO has proposed using the unconditional probability of a premature death due to these four groups, defined as occurring between the ages 30 and 707.
In Brazil NCD mortality is below that esti-mated in 2008 for most low income countries, but greater than that estimated for high income countries and also most Latin American coun-tries8. A clear decline in NCD mortality has been
observed when examining age-adjusted trends. The decline started in the 1990´s and persisted up to now, although at a lower rate in more recent years9. To be able to compare these rates over
time and across groups, these mortality analyses took into account corrections for sub notifica-tion and ill-defined causes of death.
Notably, little information is available regard-ing gender inequalities in NCDs mortality and trends. From the WHO site, estimates indicate an almost uniformly greater mortality due to NCDs across nations8. The objective of this
pa-per is to describe gender differences in mortality trends due to NCDs in Brazil. Additionally, given the importance of developing heath indicators for NCD prevention globally, we will estimate also, separately by sex, the unconditional proba-bility of dying due to the four main NCD be-tween ages 30 and 70, which is likely to be the indicator to be used in the years to follow.
Methods
Records of mortality were obtained from the Ministry of Health mortality information sys-tem (SIM; Sissys-tema de Informação sobre Mortal-idade). In this system causes of death are record-ed according to the ICD-9 codes from 1991-1995 and to ICD-10 codes from 1996 until the present. The codes were divided into the major disease groups according to the WHO scheme10.
SIM became a computer-based system in 1979 and covers the whole of the national territory. The quality of the recorded information has improved consistently over the years, both from the point of view of coverage as well as the proportion of deaths due to ill-defined causes. In order to make valid comparisons across the years, the numbers of registered NCD deaths were corrected for sub-notification and ill-defined causes.
A mixed approach to estimate mortality sys-tem coverage was used. For 1991 a model life-table separated by 5-year age-groups (with 80+ being the final open ended group), regions and sexes furnished by the IBGE was used11. Data
obtained from field-work carried out for the year 200812 provided empirically-based estimates of
coverage for the years 2000-2010, with a single estimate for each state for each year applied to both sexes and to all age-grades. For the years 1992-1999 values were obtained using a linear interpolation between estimates for the year 1991 and those for the year 2000.
Differently from previous analyses13 the
mod-el life-table regional value generated correction factors (equal to the ratio of expected/observed deaths) for sub notification at the state rather than the regional level. Since only one sub notifi-cation correction factor value was available for each of the states for the year 2000, the values available for each state for 1991 in 34 strata (17 age-grades x 2 sexes) are converged to this one value. When the correction factor is greater than 1 (number of estimated deaths was greater than those observed), a corrected number of deaths was obtained multiplying the observed number by this correction factor ratio.
The deaths due to ill-defined causes were re-distributed to the other disease categories using the methodology proposed by Mathers et al.10
each year and for each strata defined by sex, state, and age-grade, the number of deaths due to nat-ural causes was modified by multiplying it by the following formula:
(t-e)/((t-e)-d) where
t is the total number of deaths in the strata, e is the number of deaths in the strata due to external causes, and
d is the number of ill-defined deaths in the strata.
This correction was not applied to deaths due to external causes.
Mortality rates were calculated per 100.000 inhabitants. The population figures, furnished by IBGE, were obtained from the DATASUS site. For the years 1991, 2000 and 2010 the numbers of residents are derived from censuses. For the year 1996 the numbers are based on the IBGE population count. Linear interpolation, done at the strata level, was used to obtain the values for the intervening years.
The mortality rates were calculated for each sex-specific five-year age-grade, with 80+ being the final open ended group. The rates were then standardized according to the direct method us-ing the WHO standard population14. Trends in
mortality rates were analyzed by joinpoint re-gression models using the Joinpoint Software, available from the National Cancer Institute15.
Models are fit to the data so as to allow for test-ing of whether an apparent change in trend is statistically significant. The trend is computed in segments whose start and end are determined to best fit the data. These segments are connected together at “joinpoints”16.
The unconditional probability of death due to the four disease groups – cardiovascular dis-ease, cancer, chronic respiratory disease and dia-betes – was obtained using a formula provided by the WHO. The first step consists in calculating the mortality rates for each five year interval:
The individual probabilities are then com-bined with the following formula to obtain an estimate for the interval as a whole:
The usual demographic practice of turning this rate into a probability was followed using the following formula:
5q x =
5M x * 5
1 + 5M x * 2.5
40q 30 = 1 - (1 - 5q x) 65
x = 30
Π
This is the statistic which is then interpreted to be the unconditional probability of death be-tween the ages of 30 and 70.
The analyses described in this paper are part of a project approved by the Hospital das Clíni-cas de Porto Alegre Ethics Committee.
Results
In the year 2010, a total of 1,132,732 deaths were recorded, 646,069 (57.0%) for men and 486,663 (43%) for women (Table 1). Of the total number of the men, 409,484 (63.3%) had an NCD as a basic cause of death. Of the total number of the women, 362,100 (74.4%) had a NCD as a basic cause of death. After correction for sub notifica-tion and for ill defined causes of death, a total of 1,209,676 records were available. Table 1 also shows the proportional mortality for groups of diseases in 2010 for men and women, before and after correction for sub notification and ill de-fined causes of death.
The remaining results will always be present-ed with correction for sub notification and ill defined causes of death. For women, 80.2% of all deaths were due to NCD, while for men this per-centage was 69.0%. The main reason for the dif-ference is the higher proportion of external caus-es of death observed for men (18.2 vs. 5.0%). Considering NCD, for men and women, the main causes of death were cardiovascular diseases (28.8% men, 34.4% women) and cancer (15.8% men, 17.8% women). The percentages for chronic respiratory disease are 5.9% men, 6.2% women; and for diabetes 4.1% men, 6.9% women. The percentages for other chronic diseases are 14.5% men and 14.9% women.
Tables 2 and 3 complement these numbers, showing NCD and total deaths and the mortali-ty rates separately by sex for the years 1991-2010. In 1991 the total number of deaths was 1,049,229; 675756 (73.8%) were due to NCDs, 367530 (54.4%) among men and 308226 (45.6%) among women. In 2000 the total number of deaths was 1,047,365; 751,859 (71.8%) were due to NCDs, 407,395 (54.2%) among men and 344,464 (45.8%) among women.
=
Total deaths from four NCD causes between exact age x and exact age x + 5
Total populations between exact age x and exact age x + 5
Stevens A
It can also be seen from Tables 2 and 3 that between 1991 and 2010 the population of men increased 29% (from 72,485,122 to 93,406,990) and the total of NCD deaths for men increased
30% (from 367,530 to 477,175). For women the population increase was 31% (from 74,340,353 to 97,348,809) and the total of NCD deaths for women increased 35% (from 308,226, to 416,131). Year 1991 1992 1993 1994 1995 1996 1997 1998 1999 2000 2001 2002 2003 2004 2005 2006 2007 2008 2009 2010
Table 2. Deaths and the mortality rates due to all causes and to non communicable diseases (NCD) for
men, Brazil, 1991-2010.
* Corrected for sub notification and ill-defined causes of death. See text. NCD N 367530 378127 395281 392344 388255 379124 382473 396524 402426 407395 415331 417622 426639 436267 431782 440428 447853 457935 463493 477175 Total N 612229 608714 628899 617757 605637 604318 597218 608157 608101 609979 617194 622405 631529 640099 632457 642189 650291 663127 673640 691130 Deaths Proportional Mortality* % 60,0 62,1 62,9 63,5 64,1 62,7 64,0 65,2 66,2 66,8 67,3 67,1 67,6 68,2 68,3 68,6 68,9 69,1 68,8 69,0 Crude ( /100000) 507 515 531 521 509 491 485 493 491 487 491 488 493 499 488 492 495 501 501 511 Adjusted (/100000) 838 837 853 821 790 762 739 738 723 708 695 675 666 658 630 623 615 610 600 601
NCD Mortality Rate*
Population N 72485122 73436449 74387776 75339104 76290431 77241758 78825322 80408887 81992451 83576015 84559112 85542210 86525307 87508405 88491503 89474600 90457698 91440795 92423893 93406990 Cause*
Non communicable diseases Cardiovascular diseases Cancers
Chronic respiratory diseases Diabetes mellitus
Other chronic diseases Maternal, child, communicable External causes Ill defined Total N 409,484 170,948 94,437 34,936 23,991 85,172 75;215 116,348 45,022 646,069 % 63.3 26.5 14.6 5,4 3.7 13.2 11.6 18.0 7.0 100,0 Without correction % 69.0 28.8 15.8 5.9 4.1 14.5 12.8 18.2 —-100,0 N 362,100 155,008 81,162 27,903 30,864 67,163 65,907 24,769 33,887 486,663 % 74.4 31.9 16.7 5.7 6.3 13.8 13.5 5.0 7.0 100.0 Without correction % 80.2 34.4 17.8 6.2 6.9 14.9 14.6 5.1 —-100.0 Corrected Corrected
Total deaths – Men Total deaths – Women
Table 1. Absolute number (N) of deaths and proportional mortality (%), according to groups of underlying
cause of death, by sex. Brazil, 2010.
The proportional mortality for men and women increased steadily from 1991 to 2010. The crude NCD mortality rate did not change signif-icantly during this period (507/100.000 to 511/ 100.000) for men and (415/100.000 to 427/ 100.000) for women. The crude rate peaked in 1993 for both men and women.
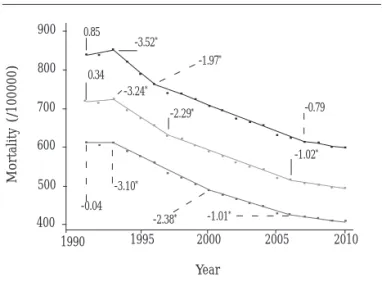
Nevertheless after the direct age standardiza-tion, the mortality rate for both sexes underwent a steady decline during this period: 28% for men (from 838/100.000 to 601/100.000); and 33% for women (615/100.000 to 409/100.000).
An analysis of these trends using joinpoint regression models shows (Figure 1) that, al-though points of inflexion were somewhat dif-ferent for men and women, for both the decline began in 1993 and was greater in earlier than in more recent years. The latest observable trends were an annual decline for men of 0.79%, and for women, of 1.0%.
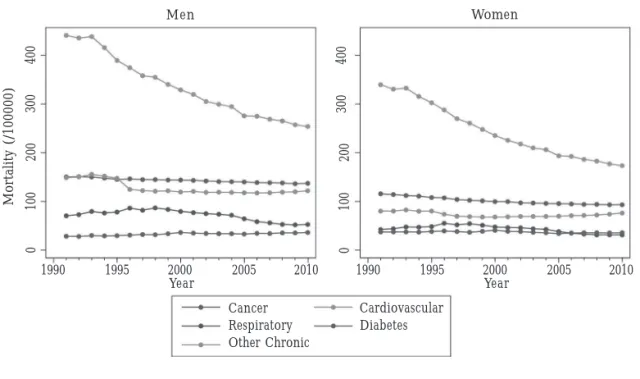
Figure 2 shows that rates for most categories – cardiovascular diseases, cancer, chronic respira-tory diseases and other NCD – are higher for men than for women. For both sexes the most impor-tant decline over the period occurred with cardio-vascular disease. The predominance of cardiovas-cular disease in these graphs masks the fact that
important falls occurred with chronic respiratory disease after 1998 (men) and 1996 (women).
Figure 3 shows the probability of dying due to the main causes of NCD death at ages 30 to 70 Year 1991 1992 1993 1994 1995 1996 1997 1998 1999 2000 2001 2002 2003 2004 2005 2006 2007 2008 2009 2010
Table 3. Deaths and the mortality rates due to all causes and to non communicable diseases (NCD) for
women, Brazil, 1991-2010.
* Corrected for sub notification and ill-defined causes of death. See text. NCD N 308226 314047 328172 327132 329603 329649 327885 336525 340883 344464 350329 357277 362433 370699 369052 380100 386543 395307 403363 416131 Total N 437000 434519 450949 444211 438354 437125 428403 438550 437388 437387 441906 449475 455625 464552 461432 473751 480447 490198 503453 518546 Deaths Proportional Mortality* % 70,5 72,3 72,8 73,6 75,2 75,4 76,5 76,7 77,9 78,8 79,3 79,5 79,5 79,8 80,0 80,2 80,5 80,6 80,1 80,2 Crude ( /100000) 415 417 430 423 420 415 404 406 403 400 401 404 405 409 402 409 411 416 419 427 Adjusted (/100000) 615 606 612 590 577 562 533 522 506 491 478 467 456 449 430 427 420 415 410 409
NCD Mortality Rate*
Population N 74340353 75355679 76371005 77386330 78401656 79416982 81118525 82820069 84521612 86223155 87335721 88448286 89560851 90673416 91785982 92898548 94011113 95123678 96236244 97348809 Mortality (/100000) Year
1990 1995 2000 2005 2010
400 500 600 700 800 900 0.85 -3.52* -1.97* -0.79 -1.02* -1.01* -2.38* -3.10* -0.04 -2.29* -3.24* 0.34 q q q q q q q q q q q
Figure 1. Long-term trends in standardized mortality due to
NCD, for Brazil, 1991 - 2010. The mortality rate due to the four main NCD (cardiovascular, cancer, chronic respiratory and diabetes) is presented along with that due to all five groups of NCD. Numbers shown within the graph are annual percent changes. * indicates a significant trend (P < 0.05).
Stevens A
years for men and women. A joinpoint analysis shows that for men the probability of death from 1993 to present date has declined by 2.08% per
Mortality (/100000)
Figure 2. Long-term trends in standardized mortality due to cardiovascular disease, cancer, chronic
respiratory disease, diabetes and other non-communicable diseases, Brazil, 1991 - 2010. Men
400
300
200
100
0
400
300
200
100
0
Women
1990 1995 2000 2005 2010
Year 1990 1995 2000Year 2005 2010
Cancer Respiratory Other Chronic
Cardiovascular Diabetes
Figure 3. Unconditional probability of death due to the four
main NCD (cardiovascular, cancer, chronic respiratory and diabetes) between the ages of 30 and 70, Brazil, 1991 - 2010. The probability is expressed as a percentage. Numbers shown within the graph are annual percent changes. * indicates a significant trend (P < 0.05).
Year
2000 2005 2010
1990 1995
35
30
25
20 %
15
q q
q
q q
q
q
q q
-1.62*
-1.54*
-2.60*
-2.77*
-2.16*
-0.07
-0.58 0.15 -2.08*
year. For women the decline from 1994 to 2006 was 2.77% per year but at present it is 1.62% per year. When both sexes are combined, the decline from 2006 to the present is 1.54% per year.
Discussion
Little has been done to estimate gender inequali-ties in NCD mortality, particularly in low or mid-dle income countries. Our results clearly show that NCD is the main cause of death for both men and women. The crude NCD mortality rate did not change significantly between 1991 and 2010 for men (507/100.000 to 511/100,000) and (415/100,000 to 427/100,000) for women. How-ever, important declines in age-standardized NCD mortality were seen during this period for men (28%, from 838/100.000 to 601/100.000) and for women (33%, 615/100.000 to 409/100.000). (Fig-ure 1) The inflection points identified in the join-point analyses indicate that the rate of decline is diminishing across the period, for both men and women. These findings are similar to those pre-viously reported9,17 using slightly different
mor-tality rates in men and women was 1.36 and, by 2010, this had increased to 1.47. The World Health Organization reports mortality rates from NCD for men and women around the world8. The
ra-tio of these rates in men and women is generally between 1 and 2. Very few countries, mainly very small ones, have rates less than 1, and a few coun-tries, mostly those belonging to the former Sovi-et Union, have rates greater than 2.
Why are NCD rates higher in men than in women? Empirically, the two main causes of death are cardiovascular and cancer; and we found both to be higher in men (Figure 2). The most common cause of cancer death, men and women combined, is lung cancer, mortality rates from which are approximately double in men compared to women18. This is consistent with
the greater prevalence of smoking in men over the last decades19.
In Brazil, similar increased overall mortality rates have been described for men from 1980 to 2005, and the same was noted for preventable causes of death20. Notably, higher rates of
mor-tality, in men than women, which have been re-corded for centuries21.
The global challenge faced by the rising bur-den of NCDs is enormous. As has been empha-sized by WHO1,2, the burden will always be more
unfavorable to countries and peoples with fewer resources. Understanding and confronting the observed gender inequality is also of paramount importance in meeting the challenge. In Brazil, in 2010, the unconditional probability of dying from the four main categories of NCD between the ages 30 to 70 years is about 22.8% for men and
15.4 % for women. Further investigation is war-ranted regarding possible explanations for dif-ferential mortality. Are they related to higher risk factors in men (smoking, alcohol drinking)? Are they a result of greater occupational exposures? Could they be due to less chronic medical treat-ment (blood pressure, diabetes and cholesterol control)? Could they be caused by delayed diag-nosis and treatment of fatal condition such as acute myocardial infarction, stroke and cancer?
Although corrections for sub notification and ill defined cause of death will continue to be nec-essary in analyses of mortality in Brazil, this should become less important over time, assum-ing that current improvements in both coverage and quality of death coding will continue. How-ever, to permit analysis of past trends we will always need to rely on some type of correction. Thus, improvements in our understanding of the declines may benefit from further refinement in methods. For example, the estimation of cover-age using the model life table approach in 1991 might be reviewed. Additional investigation of current rates of sub notification may improve current estimates of the decline. Nevertheless, the joinpoint analysis here presented indicates that declines have lessened in recent years.
In conclusion, NCD mortality is considerably higher in men than in women, despite the clines observed for both over the last two de-cades. This scenario, coupled with the greater risk of external causes of death in men, forecasts an increasingly greater gender differential in prema-ture mortality. This is a remarkable challenge to overcome.
Collaborations
Stevens A
Albuquerque FRP, Senna JR. Tábuas de Mortalidade
por sexo e grupos de idade: Grandes Regiões e
Uni-dades da Federação de 1980, 1991 e 2000. Rio de Janeiro: IBGE; 2005.
Szwarcwald CL, Morais Neto OL, Frias PG, Souza Júnior PRB de, Escalante JJC, Lima RB de, Viola RC. Busca ativa de óbitos e nascimentos no Nor-deste e na Amazônia Legal: Estimação das cobertu-ras do SIM e dos Sinasc nos municípios bcobertu-rasileiros. In: Brasil. Ministério da Saúde (MS). Saúde Brasil 2010. Brasília: MS; 2011. p. 117-134.
Schmidt M, Duncan B, Stevens A, Luft V, Iser BPM, Moura L, Malta DC. Doenças Crônicas não trans-missíveis no Brasil: mortalidade, morbidade e fato-res de risco. In: Brasil. Ministério da Saúde (MS).
Saúde Brasil 2009: uma análise da situação de saúde
e da agenda nacional e internacional de priorida-des em saúde. Brasília: MS; 2010.
Ahmad O, Boschi-Pinto C, Lopez A, Murray C, Lozano R, Inoue M. Age standardization of rates: a new WHO standard. Geneva: WHO; 2001. National Cancer Institute. Joinpoint Regression Program [Homepage at Internet]. Surveillance
Re-search Program. 2012 [cited 2012 Jul 16]. Available
at: http://surveillance.cancer.gov/joinpoint/ Kim H-J, Fay MP, Feuer EJ, Midthune DN. Permu-tation tests for joinpoint regression with applica-tions to cancer rates. Stat Med 2000; 19(3):335-351. Schmidt MI, Duncan BB, e Silva GA, Menezes AM, Monteiro CA, Barreto SM, Chor D, Menezes PR. Chronic non-communicable diseases in Brazil: burden and current challenges. The Lancet 2011; 377(9781):1949-1961.
Silva GA, Noronha CP, Santos MO, Oliveira JFP. Diferenças de gênero na tendência de mortalidade por câncer de pulmão nas macrorregiões brasilei-ras. Rev Bras Epidemiol 2008; 11(3):411-419. Monteiro CA, Cavalcante TM, Moura EC, Claro RM, Szwarcwald CL. Population-based evidence of a strong decline in the prevalence of smokers in Brazil (1989-2003). Bull World Health Organ. 2007; 85(7):527-534.
Abreu DMX de, César CC, França EB. Gender dif-ferences in avoidable mortality in Brazil (1983-2005).
Cad Saúde Públ. 2009; 25(12):2672-2682.
Kalben BB. Why men die younger: causes of mor-tality differences by sex. N Am Actuar J 2000; 5(4):83-116.
Artigo apresentado em 02/08/2012 Aprovado em 28/08/2012 11.
12.
13.
14.
15.
16.
17.
18.
19.
20.
21. References
World Health Organization (WHO). Global Status
Report on noncommunicable diseases 2010
[Homep-age at Internet]. WHO. 2011 [cited 2012 Jul 14]. Avail-able at: http://www.who.int/chp/ncd_global_status_ report/en/
World Health Organization (WHO). Preventing
chronic diseases: a vital investment [Book at
Inter-net]. Geneva: WHO; 2005 [cited 2012 Jul 14]. Avail-able at: http://www.who.int/chp/chronic_disease_ report/full_report.pdf
Bloom DE, Cafiero ET, Jané-Llopis E, Abrahams-Gessel S, Bloom LR, Fathima S, Feigl AB, Gaziano T, Mowafi M, Pandya A, Prettner K, Rosenberg L, Seligman B, Stein AZ, Weinstein C. The Global
Eco-nomic Burden of Non-communicable Diseases.
Gene-va: World Economic Forum; 2011.
United Nations (UN). High-level Meeting on Non-communicable Diseases [Homepage at Internet].
General Assembly of the United Nations. 2011 [cited
2012 Jul 14]. Available at: http://www.un.org/en/ ga/president/65/issues/ncdiseases.shtml/
Brasil. Ministério da Saúde (MS). Plano de Ações Estratégicas Para o Enfrentamento das Doenças Crô-nicas Não Transmissíveis (DCNT) no Brasil, 2011-2022. Brasília: MS; 2011.
World Health Organization (WHO). 2008-2013 Ac-tion Plan for the Global Strategy for the PrevenAc-tion
and Control of Noncommunicable Diseases [Book at
Internet]. Geneva: WHO; 2009 [cited 2012 Jul 14]. Available at: http://whqlibdoc.who.int/publications/ 2009/9789241597418_eng.pdf
World Health Organization (WHO). Monitoring framework and targets for the prevention and control
of NCDs [Homepage at Internet]. WHO. 2012 [cited
2012 Jul 14]. Available at: http://www.who.int/nmh/ events/2011/consultation_dec_2011/en/
World Health Organization (WHO). Global Health
Observatory Data Repository [Homepage at
Inter-net]. WHO. 2011 [cited 2012 Jul 16]. Available at: http://apps.who.int/ghodata/
Duncan BB, Stevens A, Iser BPM, Malta DC, Silva GA, Schmidt MI. Mortalidade por doenças crôni-cas no Brasil: situação em 2009 e tendências de 1991 a 2009. In: Brasil. Ministério da Saúde (MS).
Saúde Brasil 2010 [Documento na Internet].
Brasí-lia: MS; 2011. [cited 2012 Jul 14]. p. 117-134. Avai-lable at: http://portal.saude.gov.br/portal/arquivos/ pdf/cap_5_saude_brasil_2010.pdf
Mathers CD, Bernard C, Iburg KM, Inoue M, Fat DM, Shibuya K, Stein C, Tomijima N, Xu H. Global
Burden of Disease in 2002: data sources, methods
and results [Book at Internet]. Geneva: WHO; 2003 [cited 2012 jul 14]. Available at: http://www.who.int/ healthinfo/paper54.pdf
1.
2.
3.
4.
5.
6.
7.
8.
9.