Pho tic driving in the e le ctro
-e nc-e phalo gram o f childr-e n and
ado le sce nts: harmo nic structure
and re latio n to the re sting state
1Laboratório de Neurofisiologia Clínica, Setor de Neurologia,
Instituto Fernandes Figueira, Fundação O swaldo Cruz, Rio de Janeiro, RJ, Brasil
2Programa de Engenharia Biomédica (CO PPE), Centro de Tecnologia,
Universidade Federal do Rio de Janeiro, Rio de Janeiro, RJ, Brasil V.V. Lazarev1,
D.M. Simpson2,
B.M. Schubsky1 and
L.C. deAzevedo1
Abstract
In order to identify latent bioelectrical oscillators, 15 normal subjects (aged 9-17 years, 8 males, 7 females) were subjected to intermittent photic stimulation. The EEG amplitude spectra corresponding to the 11 fixed frequencies of stimulation presented (3-24 Hz) were com-bined to form “profiles” of the driving reaction in the right occipital area. The driving response varied with frequency, and was demonstra-ble in 70-100% of cases (using as criterion peak amplitudes 20% larger than those of the neighbors). The strongest responses were observed at the frequency closest to the alpha peak of the resting EEG. A secondary profile maximum was in the theta band. In 10 subjects, this maximum exceeded half the alpha peak (with an average of 72.4% of the alpha peak), while in the resting spectra, theta amplitudes were much lower than the alpha maxima. This responsiveness in theta activity seems to be characteristic of prepubertal and pubertal sub-jects. The profiles and resting EEG spectra showed a highly significant Pearson’s correlation, with the peak in the theta band of the profiles being the main difference observed between them. The correlation coefficient was significantly correlated with the ratio of the maxima in the theta and alpha bands (R = -0.77, P<0.001). The correlation coefficient between profile and resting spectrum may be a useful indicator in screening methods used to reveal latent cerebral oscilla-tors. Profiles for the second and third harmonics were correlated with those of the first harmonic (fundamental frequency), when consider-ing the correspondconsider-ing EEG frequencies. Peak frequencies in all three profiles were close to those of the individual’s background alpha rhythm, and peak amplitudes in higher harmonics were not much lower than those of the fundamental frequency (mean values of 84 and 63%, for second and third harmonics, respectively).
Co rre spo nde nce
V.V. Lazarev
Laboratório de Neurofisiologia Clínica
Instituto Fernandes Figueira FIO CRUZ
Av. Rui Barbosa, 716 22250-020 Rio de Janeiro, RJ Brasil
Fax: + 55-21-2553-8094 E-mail: vlad.v@ iname.com or vlazarev@ hotmail.com Research supported by CNPq and FIO CRUZ (No. 300567/1994-4).
Received November 22, 2000 Accepted September 3, 2001
Ke y words
·Electroencephalogram
·Intermittent photic stimulation
·Photic driving
·Harmonic
·Children
Intro ductio n
In electroencephalography, the activation procedures or functional tests enhance the manifestation of latent neurophysiological mechanisms or pre-existing abnormalities, and may induce abnormal findings in an otherwise normal electroencephalogram (EEG) (1). Their importance in clinical work has increased due to the heightened dis-criminating power of the computerized quan-titative methods and functional brain map-ping that are presently being applied to the analysis of the EEG. Intermittent photic stim-ulation (IPS) is one of the most important functional tests during neurophysiological examinations. It can induce in the EEG photic driving - a physiologic response consisting of rhythmic activity time-locked to the stimu-lus at a frequency identical or harmonically related to that of the stimulus (2). In the EEG spectrogram, driving appears as sharp am-plitude peaks at these frequencies.
The hypothesis of the resonance nature of the driving response was suggested as early as the nineteen forties (3) and later was accepted and experimentally confirmed by many investigators (4-10). On this basis, IPS has been used to test some basic neurophysi-ological mechanisms taking into account modern concepts of the organizing role of the bioelectrical rhythms in the brain (11,12). It is currently believed that the differentiated working of different neural circuits within the brain occurs at different specific fre-quencies, and the principle of resonance fil-tering of stimuli underlies the reactions to external stimulation and coding of informa-tion (4,7). The resonance properties of the EEG oscillators can be enhanced by IPS. A gradual continuous change in frequency of stimulation across the entire EEG frequency range has allowed an individual’s profile of reactivity to be calculated, based on the set of peaks elicited in the EEG spectrogram. This profile apparently reflects the charac-teristic EEG oscillators in different bands
(6,8). These oscillators were found to be very variable across a group of subjects, but in each individual, the frequencies of the peaks proved to be very stable over a long period of time (6). Other investigators also observed large interindividual variability and long-term individual stability of the driving reactions (4). Significantly, however, the resonance driving peaks not only coincided with the background peaks, such as those of alpha activity, but also appeared at the fre-quencies where no peaks were observed in the background EEG (6,8). This potential for revealing the individual latent oscillators makes the IPS test very valuable and promis-ing in both clinical and basic neurophysi-ological studies and permits obtaining addi-tional information not present in the resting EEG (1,13-16).
Photic driving can directly influence psy-chophysiological processes. The presence of such response in the premotor, motor and sensorimotor cortical areas may indicate a low resistance to interference from stimula-tion in an individual’s motor activity (17). Driving at the alpha frequencies can produce a relaxing effect, and pronounced physi-ological reactions to the IPS may be ob-served in heart rate, breathing, galvanic skin resistance (18,19), as well as in regional cerebral blood flow (20). These effects have been utilized in some forms of therapy (18). The application of IPS to normal subjects permits a more detailed study of the EEG typology and the EEG correlates with indi-vidual psychophysiological characteristics (21). In particular, it has been suggested for use in the selection of candidates for space flight (17). The parameters of the driving response may serve as sensitive EEG indica-tors of the peculiarities of age and brain maturation (1,16,22), as well as of gender differences (13).
so-called photosensitive epilepsy (23,24). This abnormal response can only be observed in 5-10% of the epileptic population (25), pre-dominantly in generalized epilepsies, and is not typical of focal epilepsies (26). Applica-tion of IPS can, however, also be effective in the study of epilepsy without a convulsive response. It was shown through an increase in regional cerebral blood flow that the epi-leptogenic foci are very sensitive to certain frequencies of photic stimulation, which pro-voke local physiological changes, even in the absence of paroxysmal manifestations (27).
For non-paroxysmal responses to IPS, many clinical correlates are described in the literature. They may serve as additional EEG signs of cerebral pathology, not always pres-ent in the resting EEG. For example, exag-gerated driving at low flickering frequencies usually signifies acute or subacute neuronal dysfunction (28). Cortical lesions of a de-structive type may cause ipsilateral depres-sion or attenuation of driving, whereas irrita-tive lesions, such as those of epileptic scars, may lead to an increased response on the side of a focus (29,30). A locally increased rhythmic response in delta or beta frequen-cies may indicate a focal disturbance, and a reduced or disproportionately hypersynchro-nized response within the alpha band may reflect certain functional alterations (24). However, a generalized low voltage or ab-sence of photic driving is of little diagnostic significance because some normal individu-als are not responsive to IPS (28).
In neurology, the driving response to high frequency IPS is considered by some authors as the only reliable EEG indicator of head-ache (15,31). In psychiatry, a decreased driv-ing response at the alpha frequencies has been found in schizophrenia (10). In these patients alpha driving may be higher in the frontal areas than in the occipital region (32), probably indicating some signs of “hypofrontality”. EEG photic driving is also utilized in the EEG evaluation of drug
ef-fects and in predicting the efficacy of therapy (33), in certain cases being more sensitive than the resting EEG (34).
Expressive EEG driving responses are very often recorded not only at the frequency of IPS (to be called the fundamental or first harmonic) but also at higher harmonics (in-teger multiples of the fundamental frequency) (3,35-37). In experiments with animals and humans, it was shown that such harmonics are not just an artificial result of Fast Fourier Transform, but reflect real physiological re-actions (36). However, very few authors pay attention to the harmonic composition of the EEG driving response. Some still consider its significance as poorly understood (1). Nevertheless, there are some data showing a certain diagnostic potential of this aspect of the reaction. The ratio of harmonic ampli-tudes proved to be a fine indicator of the functional states in normal subjects (5,35). It may depend upon the clinical state of the patients, as found in renal disease (38). The gender EEG differences in older ages were found only in the second harmonic of the driving response (13). In geriatric clinical work, only decreased harmonic driving dif-ferentiated the patients suffering from early dementia from age-matched depressed ones, whereas neither resting EEG nor driving re-action at the frequency of stimulation showed any differences (14). Certain alterations were found in the dynamics of the second har-monic during high frequency IPS in mi-graine (39).
In spite of the great interest in EEG photic driving, the peculiarities of the responses in children and adolescents have not received great attention, especially using quantitative EEG methods. The responses of normal sub-jects in this age group need to be described further to permit more effective application of IPS to children in neurological and psy-chiatric studies.
of the driving reaction using standard equip-ment available in most clinical EEG labora-tories, which could readily be utilized in routine examination of patients. The main thrust of this approach is to combine the amplitudes of the EEG reactions to IPS at different fixed frequencies in a single graph, equivalent to an amplitude spectrum. This methodology is aimed at revealing any addi-tional potential EEG oscillators not present in the resting EEG of children and adoles-cents. An analysis of the so far insufficiently explored harmonic content of the driving reactions is also presented.
Mate rial and Me thods
The volunteers were 15 children and ado-lescents, 8 males and 7 females, with a me-dian age of 13.3 years (range 9 to 17 years). None had a history of neurological, psychi-atric or drug-related illness and none was overtly left handed. The study was approved by the local Ethics Committee. Written in-formed consent was obtained from the par-ticipants and their parents.
EEG signals were recorded during a state of relaxed wakefulness (initial background, 2-3-min duration), during IPS at frequencies of 3, 4, 5, 6, 8, 10, 12, 15, 18, 21 and 24 Hz, and during relaxed wakefulness between stimulations. The subjects kept their eyes closed throughout the experiment. Each stim-ulation consisted of flashes presented at a fixed frequency for 20-30 s, with the same periods between stimulation runs. In 12 of the 15 subjects, this series was repeated. Considerations of comfort and therefore co-operation of the subjects did not allow more extended stimulation periods. The photo-stimulator was a xenon lamp whose flash of approximately white light had a duration of less than 20 µs. The lamp was positioned at a distance of 25 cm from the eyes, with dim surrounding light.
The EEG was recorded on an 18 channel Nihon Kohden polygraph (EEG-4418), with
monopolar leads at 16 scalp points accord-ing to the International 10/20 System, with references at the ipsilateral earlobes. The recording characteristics were: 0.3 s time constant, 70 Hz low-pass filter and 15 µV/ mm sensitivity. EEG signals were simulta-neously recorded on paper and magnetic tape (tape recorder TEAK XR-7000), and then digitized by the computerized BrainScan (Neurotron) system. The digital sampling frequency was 256 Hz. The EEG was not digitized during at least 5 s after each stimu-lation in order to exclude a possible short post-stimulation effect (9).
The present study was restricted to the right occipital region, generally considered as representative for the study of visual stim-ulation (3,20,37). The results of spectral anal-ysis (using the Fast Fourier Transform) were presented in the form of amplitude spectra, i.e., the square root of the power spectrum, with a frequency resolution of 0.5 Hz. Since in the present study EEG spectra with and without stimulation are compared, a spectral resolution was selected that was considered suitable for the study of background EEG activity, while also clearly showing the re-sponse to photic stimulation. The presence of the driving response at the frequency of stimulation (the fundamental or first har-monic) and its higher (i.e., second and third) harmonics was ascertained with in-house software, using as a criterion for the detec-tion of the response an amplitude peak which was at least 20% higher than the amplitudes at the adjacent frequencies in the range ± 1 Hz. Computer simulation studies showed that this criterion gave a false-positive rate of less than 5% when the spectrum of signals is white, i.e., when there is no response to the stimuli. This approach will be referred to as the “20% criterion”.
driving reaction” (or “profile”) by extracting from each spectrum only the component ob-tained at the stimulus frequency. Similar profiles were constructed for the second and third harmonics of the stimulus frequency.
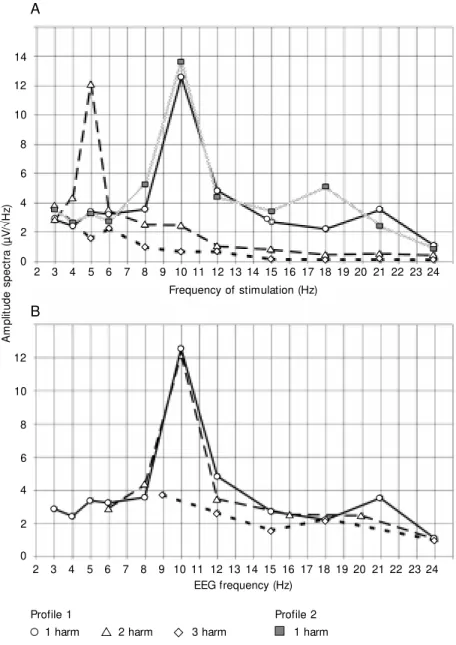
The similarity between these different profiles was evaluated by Pearson’s correla-tion coefficient (R). Statistical significance of changes in profile from the first to the second series of stimulation was evaluated by the Wilcoxon test. In the profiles the abscissa was plotted according to the fre-quency of stimulation (Figure 1A) or accord-ing to the frequency of the EEG (Figure 1B). For the fundamental frequencies the two scales are therefore equal, but for the second harmonic, the latter show values twice as high as those of the former.
Re sults
Some of the individual spectrograms of the EEG with the driving responses to IPS are presented in Figure 2 with an example of a particularly strong reaction to IPS at 3 Hz, especially at the higher harmonics (Figure 2A).
In the right occipital area (O2), such re-sponses (according to the 20% criterion) in each of the two first harmonics took place during different stimulation frequencies in 67-100% of the subjects over the 11 stimulus frequencies, with the maximum for the first harmonic at 4, 15 (93% in both) and 24 Hz (100%) (Figure 3). In one subject (SV, a 13-year-old boy), in strong contrast to the oth-ers, the driving effect in the first harmonic was observed only during the 24-Hz stimula-tion, and in the second one during the 3-, 8-, 10- and 12-Hz stimulations. Therefore, most of the group data below are presented for 14 subjects, excluding SV. In these 14 subjects, the driving reaction was detected in the first harmonic at, on average, 9.7 ± 1.15 (mean ± SD) frequencies or 88% of the 11 frequencies presented. In the second har-monic, the corresponding results were 8.8 ±
A
m
p
lit
u
d
e
s
p
e
c
tr
a
(
µ
V
/
Ö
H
z)
2 3 4 5 6 7 8 9 10 11 12 13 14 15 16 17 18 19 20 21 22 23 24
2 3 4 5 6 7 8 9 10 11 12 13 14 15 16 17 18 19 20 21 22 23 24
EEG frequency (Hz) Frequency of stimulation (Hz) 14
12
10
8
6
4
2
0
12
10
8
6
4
2
0
Profile 1
1 harm 2 harm 3 harm
Profile 2 1 harm A
B
Figure 1. An example of individual driving profiles (subject TG), constructed by combining the amplitude spectra (in µV/ÖHz1) obtained during stimulation at different frequencies. A, Profiles for the first (Profile 1) and second (Profile 2) series of intermittent photic stimulation (IPS). For the first series, the profiles for the first three harmonics (1, 2 and 3 harm) are given. For the second series, only that of the fundamental one is show n. The abscissa show s the frequency of stimulation, in Hz. B, Profiles for the first three harmonics of the first IPS series (as used in Figure 1A), but w ith the abscissa show ing the EEG frequency, in Hz.
2.3 or 80% of frequencies, and in the third harmonic 6.4 ± 2.1 or 58% of the stimula-tions.
the first and second series of stimulation in subject TG. These show the typical shape, with a maximum at the frequency of 10 Hz. The two profiles proved to be very similar (R = 0.94, P<0.001). In 11 subjects who passed through two series of stimulation (excluding SV), the average R was 0.91 ± 0.08 (P<0.001). A significant difference (P<0.05, Wilcoxon test) between the profiles from the first and second series of stimulation was found in this group only at 12 Hz (showing a de-crease) and at 18 Hz (inde-crease).
For all 14 subjects (excluding SV) the maximum of the profile was in the first harmonic in the alpha band: 10 of them at 10 Hz, 3 at 8 Hz and 1 at 12 Hz. In the 12 subjects who showed a driving reaction at these frequencies according to the 20% cri-terion, this maximum had an average value
of 11.33 ± 3.14 µV/ÖHz1 while the average
amplitude in the background alpha peak was
6.97 ± 2.21 µV/ÖHz. The background peak
frequency differed from that of the profile by no more than 0.5 Hz.
In 6 subjects there was an additional peak in the profile in the theta band (4-6 Hz), with an average amplitude of 7.72 ± 2.92 µV/
ÖHz. This was 76% of the profile alpha peak
amplitude (Figure 4A). Only one of these subjects had a prominent theta peak in the spectra of the initial background EEG (Fig-ure 4D: PO). In another 4 subjects without a prominent theta peak in the profile, the pro-file maximum in the theta band had an
aver-age amplitude of 7.50 ± 2.70 µV/ÖHz or 67%
of the alpha peak (Figure 4B). In contrast, in the initial background of 13 subjects, the
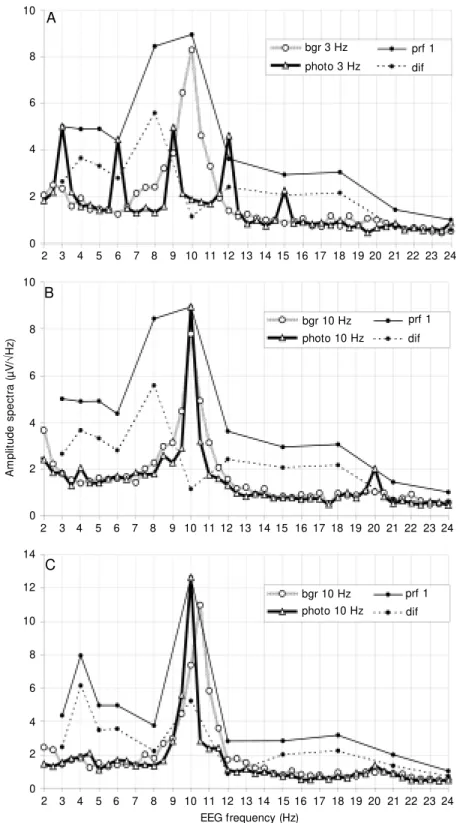
Figure 2. EEG spectra for individual subjects in the first series of intermittent photic stimulation (IPS), in the resting state (bgr) and during IPS (photo), together w ith the driving profiles (prf 1) and “ difference” profiles (dif), show ing an increase in the amplitude spectra at each frequency of IPS in relation to the background. A, Subject M A, and IPS of 3 Hz (for spectrum). B, Subject M A, and IPS of 10 Hz (for spectrum). C, Subject TI, and IPS of 10 Hz (for spectrum). The abscissae show the EEG frequency.
1The unit of the pow er spectral density is µV2/Hz, as
normally used for the background EEG, and therefore that of the amplitude spectrum is µV/ÖHz. This w ill be used throughout the current paper. In the driving reac-tion, consisting of sinusoidal oscillations at a number of w ell-defined frequencies, the amplitudes of the har-monics (in µV) can be calculated by multiplying the amplitude spectral values at the corresponding frequen-cies by 1.41 (for the spectral resolution of 0.5 Hz em-ployed).
A
m
p
lit
u
d
e
s
p
e
c
tr
a
(
µ
V
/
Ö
H
z)
10
8
6
4
2
0
8
6
4
2 10
12
10
8
6
0 14
2 4
2 3 4 5 6 7 8 9 10 11 12 13 14 15 16 17 18 19 20 21 22 23 24
2 3 4 5 6 7 8 9 10 11 12 13 14 15 16 17 18 19 20 21 22 23 24
0
2 3 4 5 6 7 8 9 10 11 12 13 14 15 16 17 18 19 20 21 22 23 24
EEG frequency (Hz) A
B
C
photo 3 Hz
bgr 3 Hz prf 1
dif
photo 10 Hz
bgr 10 Hz prf 1
dif
photo 10 Hz
bgr 10 Hz prf 1
100
%
80
60
40
20
0
First harmonic
Second harmonic Third harmonic
3 4 5 6 8 10 12 15 18 21 24
Hz
Figure 3. Percentage of subjects show ing a driving response (according to the criterion of peak values 20% larger than those of adjacent frequencies) in the first three harmonics of each frequency of the first series of intermittent photic stimulation. A hun-dred percent indicates a driving response in all 15 subjects of the group studied.
Figure 4. Individual driving profiles (first harmonic in the first series of intermittent photic stimulation) classified according to the reaction in the theta band (see Figure 1). The abscissae show the frequency of the EEG and stimulation, in Hz; the ordinates show amplitude spectra, in µv/ÖHz. TA, JU, PO, etc., indicate the subjects. A, Six subjects w ith theta peak amplitudes exceeding half their maximum in the alpha band. B, Four subjects w ithout theta peak, but w ith amplitude maxima in the theta band exceeding half their maximum in the alpha band. C, Four subjects w ith amplitude maxima in the theta band less than half their maximum in the alpha band. D, Initial background EEG spectra of subjects in group A, and one from group B (TH - w ho did not show a dominating alpha peak in the resting EEG).
A B
C
D 16
12
8
4
0
3 5
8 12 18 24
TA JU
PO TI
FA TO
16
12
8
4
0
3 5
8
12 18 24 SE
M A TH
BI
16
12
8
4
0
3 5 7 9 11 13
TA
JU PO
TI FA
15 17 1921 23
TH TO 16
12
8
4
0
3 5
8
12 18 24
EN
TG
between the profile and the initial back-ground were negatively correlated with the amplitude of the profile theta maximum (R = -0.61, P<0.01) and with the ratio of theta to alpha maxima (R = -0.77, P<0.001).
The difference between the profile val-ues and the background amplitude spectra at the same frequencies was almost always posi-tive, indicating increased amplitude spectra during stimulation. The maximum of such an increase was, on average, 6.87 ± 3.37 µV/
ÖHz. In 4 subjects this maximum was
ob-served at 4 Hz, in 1 subject at 15 Hz, and in the remaining 10 subjects in the alpha band.
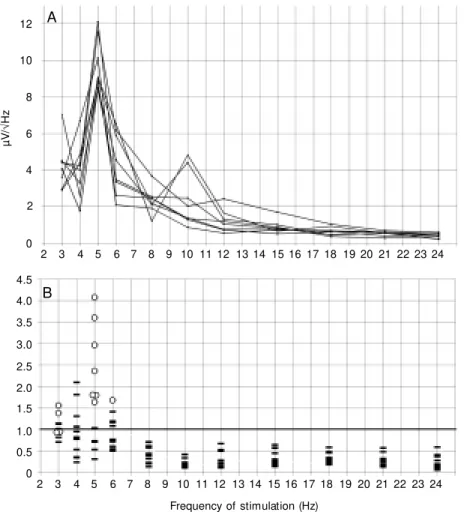
The driving profile constructed from the second harmonics had its maximum at an IPS of 3-6 Hz, with peaks at 5 Hz in 8 subjects (Figures 1A and 5A). In 12 subjects with a driving effect at these frequencies (according to the 20% criterion), the maxi-mum ratio of the amplitude of the second harmonic to that of the first harmonic meas-ured at the same frequency of stimulation was, on average, 2.06 ± 1.0, and exceeded 1.0 in 10 cases (Figure 5B).
Considering the frequency of the EEG rather than that of stimulation, the maximum of the profile of the second harmonic fell in the alpha band (Figure 1B). In all cases except one, it exactly coincided with the strongest response found for the profile of the fundamental frequency, and therefore, as stated above, was close to the peak alpha frequency of the background. The maximum amplitude of the profile for the second har-monic was on average 0.84 ± 0.29 of that for the first, and this ratio exceeded 1.0 in 4 cases.
In 13 subjects, the average correlation coefficient R was 0.9 ± 0.08 (P<0.001) be-tween the profiles of the first and second harmonics, comparing the profiles on the basis of the frequencies of the EEG rather than those of the stimuli. In one subject in whom the peak frequencies did not coincide, R was 0.55 (P<0.05).
µ
V
/
Ö
H
z
8 10
4
2
4.0
3.5
2.5
2.0
1.5
1.0
0.5
0 3.0 4.5 12
6
0
2 3 4 5 6 7 8 9 10 11 12 13 14 15 16 17 18 19 20 21 22 23 24
2 3 4 5 6 7 8 9 10 11 12 13 14 15 16 17 18 19 20 21 22 23 24
Frequency of stimulation (Hz) A
B
Figure 5. Driving profiles for second harmonic. A, Superposition of profiles for 8 subjects w ho had a profile maximum during intermittent photic stimulation at 5 Hz (see Figure 1). B, Superposition of amplitude ratios “ second harmonic/first harmonic” in 12 subjects. Circles: maximum of the ratios in each subject. The abscissae show the frequency of stimulation.
ratio of the theta maximum to the alpha peak was 0.29 ± 0.09, with a mean theta amplitude
of 2.35 ± 1.15 µV/ÖHz, and only in 1 subject
were these maxima comparable (ratio of 0.81; Figure 4D: TH).
In the beta band, the maximum of the profiles was generally lower than that of the theta band, reaching 33 ± 15% of the peak value in the alpha band.
The average correlation coefficient be-tween the driving profile and the initial
back-ground EEG spectra was Rdb = 0.82 ± 0.13
(P<0.001). In the whole group (except for subject PO for whom the background theta peak exceeded that of alpha measured at the
In the profiles of the third harmonic, the maximum was observed at stimulation fre-quencies of 3 or 4 Hz. The ratio of the profile maximum of the third harmonic to the ampli-tude of the first at the same frequency of stimulation was, on average, 1.18 ± 0.55 (Figure 1A), exceeding 1.0 in 5 cases, and its ratio to the maximum of the first harmonic was 0.63 ± 0.30 (Figure 1B).
D iscussio n
The results demonstrate very pronounced photic driving responses in almost all of the children and adolescents examined. In gen-eral, the reactivity seemed to be rather stron-ger than that observed in adults, according to the literature (1,30).
The similarity of the profiles of the first and second series of stimulation in the same subjects is indicative of the ability of the profile to describe certain relatively stable characteristics of the reactivity. This has been considered to reflect constitutional fea-tures of the EEG (4,6). On the other hand, some authors have found variable compo-nents of the reaction in photic driving, which are determined by the current functional state (5,35,37). Such components are probably reflected in the differences between the driv-ing profiles of the two series of stimulation, such as the significant amplitude increase at 18 Hz and the decrease at 12 Hz. These could be caused by tiredness, orienting reaction or influence from some uncontrolled mental processes, which might also contribute to somewhat lower values of the between-se-ries correlation in some subjects.
A high correlation between the driving profile and the background EEG spectra may be considered evidence of the above-men-tioned concept of the resonance mechanisms of the driving response (4-10). This is most clearly illustrated by the maximum increase in amplitude occurring during stimulation near the peak alpha frequencies of the back-ground EEG (3,5,35). In this case, the peak
also show that the reduced values of the correlation coefficient between the driving profile and the background spectra may be useful in screening methods to reveal latent cerebral oscillators, including pathological forms of bioelectrical activity.
The driving responses observed in the EEG at twice or three times the frequency of stimulation, i.e., at the second and third har-monics, were strongly pronounced. These were found to be almost as common as the reaction at the fundamental frequency. The maxima of the profiles of the second and third harmonics occurred at the low stimula-tion frequencies of 3-6 Hz, and the peaks were appreciably higher than those obtained at the fundamental frequency. These maxima fell at EEG frequencies close to the back-ground alpha peak and coincided with the maximum of the response at the fundamen-tal frequency, showing only slightly de-creased amplitudes compared to it. The pro-files of different harmonics plotted accord-ing to the frequency of their effects evoked in the EEG (see Figure 1B) proved to be very similar in form and highly correlated. This is in accordance with the above mentioned concept of the resonance mechanisms of the photic driving (4-10) and demonstrates that the most powerful alpha oscillators appear to manifest their predominant resonant be-havior even when stimulated at half or one third of the subject’s alpha frequency (40). This should be taken into account when applying continuously changing frequencies of stimulation (6,8) when the spectral power at a given frequency must contain a contri-bution from the stimuli at half, one third, etc., of this frequency. As a result, the EEG spectra are biased: the lower frequencies represent the driving effects of only the stim-ulation at low frequencies, whereas higher frequencies receive additional contributions from harmonics, and thus are equivalent to a longer duration of stimulation. Continuously varying stimulus frequencies have the obvi-ous virtue of allowing a better match
be-tween the frequencies of stimulation and those of latent neural oscillators than is pos-sible with fixed stimulus frequencies (which are most common and routinely available in EEG examinations). However, the results obtained here suggest that exact coincidence of the frequencies of the stimulus and brain oscillator is not always required for an ex-pressive driving effect. Moreover, a slight frequency difference between them may pro-duce an enhanced increase in driving ampli-tude.
The resonance effects of the driving re-sponse are not fully understood. While, for example, the manifestation in the EEG of the second harmonic during stimulation at 5 Hz is similar to that of the first harmonic at 10 Hz, its functional significance may be differ-ent (5,13,14,38,39). In some subjects (for example SV), the response at a given fre-quency of the EEG could occur when this represents a double or triple frequency of the stimulation, but not when this is the funda-mental frequency. However, in the present study the visual stimulation was presented through very short stroboscopic flashes (as available in standard EEG equipment) rather than by sinusoidally varying light intensi-ties, as used by many other investigators. As a result, the stimulus input to the visual system occurs simultaneously at the funda-mental frequency, and also at higher har-monics of the stimulus frequency. This may at least in part be responsible for the rela-tively strong harmonic driving response and for the high correlation between the profiles for the fundamental and higher harmonics that were observed in the present study. With flash stimulation, it is difficult to determine if activity at higher harmonics is due to the stimulus input at these higher harmonics, or to the nonlinear characteristics of the EEG response.
ac-tivity and functional state of the brain, which were not apparent in the resting EEG. The profile extracts and integrates amplitude re-sponses and their harmonics at all the IPS frequencies applied, allows their compari-son, and may be treated as equivalent to a spectrum. It may serve as a complex charac-teristic of the individual EEG which presum-ably provides, in comparison with the rest-ing EEG, a fuller representation of the set of potential oscillators. It also reflects a rela-tively more standardized functional state of the brain due to external stimulation, which has been considered to minimize the effect
Re fe re nce s
1. Takahashi T (1993). Activation methods. In: Niedermeyer E (Editor), Electroen-cephalography: Basic Principles, Clinical Applications, and Related Fields. Williams & Wilkins, Baltimore, M D, USA. 2. Chatrian GE, Bergamini L, Dondey M ,
Klass DW, Lennox-Buchthal M & Petersén I (1974). A glossary of terms most com-monly used by clinical electroencephalog-raphers. Elect roencephalography and Clinical Neurophysiology, 37: 538-548. 3. Walter VJ & Walter WG (1949). The
cen-tral effects of rhythmic sensory stimula-tion. Electroencephalography and Clinical Neurophysiology, 1: 57-86.
4. Tyler CW, Apkarian P & Nakayama K (1978). M ultiple spatial-frequency tuning of electrical responses from human visual cortex. Experimental Brain Research, 33: 535-550.
5. Danilova NN (1985). Functional States: M echanisms and Diagnostics (in Russian). M oscow University Press, M oscow , Rus-sia.
6. Fedotchev AI, Bondar AT & Konovalov VF (1990). Stability of resonance EEG reac-tions to flickering light in humans. Interna-tional Journal of Psychophysiology, 9: 189-193.
7. Basar E, Basar-Eroglu C, Rahn E & Schur-mann M (1991). Sensory and cognitive com ponent s of brain resonance re-sponses. Acta Oto-Laryngologica, 491 (Suppl): 25-34.
8. Basar-Eroglu C, Basar E, Demiralp T & Schurmann M (1992). P300-response: possible psychophysiological correlates in delta and theta channels. International
Journal of Psychophysiology, 13: 161-179. 9. Sakamoto H, Inouye T & Shinosaki K (1993). Preservation of alpha rhythm shortly after photic driving. International Journal of Neuroscience, 73: 227-233. 10. Jin Y, Castellanos A, Solis ER & Potkin SG
(2000). EEG resonant responses in schizo-phrenia: a photic driving study w ith im-proved harmonic resolution. Schizophre-nia Research, 44: 213-220.
11. Livanov M N (1977). Spatial Organization of Cerebral Processes. Wiley-Liss, New York, NY, USA.
12. Gevins A (1993). High resolution EEG. Brain Topography, 5: 321-325.
13. Takahashi T, Kataoka K & Tsukahara Y (1988). Pow er spectral analysis of photic driving elicited by flickering dot pattern and red flicker stimuli in adult psychiatric outpatients - w ith special reference to age and gender. Tohoku Journal of Experi-mental M edicine, 156: 165-173. 14. Drake Jr M E, Shy KE & Liss L (1989).
Quantitation of photic driving in dementia w ith normal EEG. Clinical Electroencepha-lography, 20: 153-155.
15. Gronseth GS & Greenberg M K (1995). The utility of the electroencephalogram in the evaluation of patients presenting w ith headache: a review of the literature. Neu-rology, 45: 1263-1267.
16. Kaiser J & Gruzelier JH (1996). Timing of puberty and EEG coherence during photic stimulation. International Journal of Psy-chophysiology, 21: 135-149.
17. Petrenko ET (1988). Electroencephalo-graphic changes in response to the equi-librium test and rhythmic light flashes (in
Russian). Kosm icheskaya Biologiya i Aviakosmicheskaya M editsina,22: 21-25. 18. M orse DR (1993). Brain w ave synchroniz-ers: a review of their stress reduction ef-fects and clinical studies assessed by questionnaire, galvanic skin resistance, pulse rate, saliva, and EEG. Stress M edi-cine, 9: 111-126.
19. Fedotchev AI (1997). Analysis of EEG resonance reactions in evaluation of the effectiveness of sensory stimulation. Hu-man Physiology (Fiziologiya Cheloveka), 23: 117-123.
20. Fox PT & Raichle M E (1984). Stimulus rate dependence of regional cerebral blood flow in human striate cortex, dem-onstrated by positron emission tomogra-phy. Journal of Neurophysiology, 51: 1109-1120.
21. Golding JF & Richards M (1985). EEG spectral analysis, visual evoked potential and photic-driving correlates of personal-ity and memory. Personality and Individual Differences, 6: 67-76.
22. Eeg-Olofsson O (1980). Longitudinal de-velopmental course of electrical activity of brain. Brain and Development, 2: 33-44.
23. Coull BM & Pedley TA (1978). Intermit-tent photic stimulation. Clinical usefulness of non-convulsive responses. Electroen-cephalography and Clinical Neurophysiol-ogy, 44: 353-363.
24. Scheuler W (1983). Clinical significance of increased reaction to photostimulation in the alpha frequency range (in German). EEG-EM G Zeitschrift für Elektroenzepha-lographie, Elektromyographie und Ver-of uncontrolled variations in a current state
(16). This is important in both experimental and diagnostic applications, and is expected to decrease dispersion of EEG parameters and make them more comparable between subjects.
Ackno wle dgm e nts
w andte Gebiete, 14: 143-153.
25. de Falco FA, Roberti R, Florio C & Fran-zese G (1992). Photoparoxysmal response on eye closure in photosensitive patients. Acta Neurologica, 14: 290-296.
26. Wolf P & Goosses R (1986). Relation of photosensitivity to epileptic syndromes. Journal of Neurology, Neurosurgery, and Psychiatry, 49: 1386-1391.
27. Valmier J, Touchon J & Baldy-M oulinier M (1989). Interictal regional cerebral blood flow during nonspecific activation test in partial epilepsy. Journal of Neurology, Neurosurgery, and Psychiatry, 52: 364-371.
28. Kooi KA, Tucker RP & M arshall RE (1978). Fundamentals of Electroencephalogra-phy. Harper & Row , Hagerstow n, M D, USA.
29. Bickford RG (1979). Activation procedures and special electrodes. In: Klass DW & Daly DD (Editors), Current Practice of Clinical Electroencephalography. Raven Press, New York, NY, USA, 269-305. 30. Beydoun A, Schechter SH, Nasreddine W
& Drury I (1998). Responses to photic st im ulat ion in pat ient s w it h occipit al spikes. Electroencephalography and
Clini-cal Neurophysiology, 107: 13-17. 31. de Tommaso M , Sciruicchio V, Bellotti R,
Guido M , Sasanelli G, Specchio LM & Puca F (1999). Photic driving response in primary headache: diagnostic value tested by discriminant analysis and artificial neu-ral netw ork classifiers. Italian Journal of Neurological Sciences, 20: 23-28. 32. Wada Y, Takizaw a Y & Yamaguchi N
(1995). Abnorm al phot ic driving re-sponses in never-medicated schizophre-nia patients. Schizophrenia Bulletin, 21: 111-115.
33. Takahashi T & Kataoka K (1990). Influence of indeloxazine hydrochloride upon photic driving responses elicited by flickering dot pattern and red flicker stimuli in elderly patients. Japanese Journal of Psychiatry and Neurology, 44: 709-715.
34. Jin Y, Potkin SG & Sandman C (1995). Clozapine increases EEG photic driving in clinical responders. Schizophrenia Bulle-tin, 21: 263-268.
35. Danilova NN (1961). Reaction of cerebral electrical activity to light flickering w hich coincides w ith frequency band of alpha rhythm (in Russian). Zhurnal Vysshey Nervnoy Deyatel’nosti Imeni I.P. Pavlova,
11: 12-21.
36. Ilyanok VA (1969). Influence of the fre-quency of rhythmic photic stimulation on the harmonic composition of the driving response in the human brain. Electroen-cephalography and Clinical Neurophysiol-ogy, 27: 325.
37. Yaguchi K & Iw ahara S (1976). Temporal sequence of frequency specific and non-specific effects of flickering lights upon the occipital electrical activity in man. Brain Research, 107: 27-38.
38. Hamel B, Bourne JR, Ward JW & Teschan PE (1978). Quantitative assessment of photic driving in renal failure. Electroen-cephalography and Clinical Neurophysiol-ogy, 45: 719-730.
39. Nyrke T & Lang AH (1982). Spectral analy-sis of visual potentials evoked by sine w ave modulated light in migraine. Elec-troencephalography and Clinical Neuro-physiology, 53: 436-442.