Unifo rm de cre ase o f alpha-glo bal fie ld
po we r induce d by inte rm itte nt pho tic
stim ulatio n o f he althy subje cts
1Public Health Department, District Wesel, Moers, Germany 2Institute of Sports Sciences, J.-W. Goethe University, Frankfurt,
Germany
3Department of Gerontopsychiatry, University Hospital of Psychiatry,
Regensburg, Germany R. Rau1,
C. Raschka2 and
H.J. Koch3
Abstract
Nineteen-channel EEGs were recorded from the scalp surface of 30 healthy subjects (16 males and 14 females, mean age: 34 years, SD: 11.7 years) at rest and under trains of intermittent photic stimulation (IPS) at rates of 5, 10 and 20 Hz. Digitalized data were submitted to spectral analysis with fast fourier transformation providing the basis for the computation of global field power (GFP). For quantification, GFP values in the frequency ranges of 5, 10 and 20 Hz at rest were divided by the corresponding data obtained under IPS. All subjects showed a photic driving effect at each rate of stimulation. GFP data were normally distributed, whereas ratios from photic driving effect data showed no uniform behavior due to high interindividual variabil-ity. Suppression of alpha-power after IPS with 10 Hz was observed in about 70% of the volunteers. In contrast, ratios of alpha-power were unequivocal in all subjects: IPS at 20 Hz always led to a suppression of alpha-power. Dividing alpha-GFP with 20-Hz IPS by alpha-GFP at rest (R = a-GFPIPS/a-GFPrest) thus resulted in ratios lower than 1. We
conclude that ratios from GFP data with 20-Hz IPS may provide a suitable paradigm for further investigations.
Co rre spo nde nce
H.J. Koch
Department of Gerontopsychiatry University Hospital of Psychiatry Universitätsstrasse 84 D-93053 Regensburg Germany
Fax: + 49-941-941-1205
E-mail: horst.koch@ bkr-regensburg.de
Received March 29, 2001 Accepted February 25, 2002
Ke y wo rds
·EEG
·Brain mapping ·Intermittent photic
stimulation
·IPS
·Global field power ratios
Intro ductio n
The first studies on alterations of electric cerebral activity induced by intermittent photic stimulation (IPS) were done by Adrian and Matthews in 1934 (see 1). It was ob-served that brain waves can be synchronized by external stimulation with rhythmic flash-lights, a phenomenon which is pronounced above occipital brain regions. This phenom-enon was called photic driving effect (PDE). In this physiological reaction interindividual variability is high. In some cases EEG
activ-ity coupling to stimulation rates does only or most visibly occur at frequencies correspond-ing to the spontaneous rhythm, the so-called frequency selectivity (1,2). EEG changes evoked by photic stimulation at low frequen-cies correspond to single visually evoked potentials, while series of brain waves at higher stimulation rates are related to steady-state visually evoked potentials.
epilepsy research or information processing studies (3,4). Brain mapping results are in-fluenced by drugs and medications (5). Michel et al. (6) reported that GFP is influ-enced by diazepam and that the extent of influence depends on the functional state of the central nervous system. GFP analysis can serve to monitor treatment of Alzhei-mers disease with tacrine or related drugs (7). The ratio of alpha- versus delta-GFP shows a positive correlation with tau protein levels in patients with cognitive decline due to supposed Alzheimers disease (8). In cere-brovascular diseases an increase of PDE was observed and vertebrobasilar perfusion in-sufficiency led to a reinforced PDE in the ß-frequency range (1). Alterations of PDE were described in patients with migraine and other forms of headache (9). Apart from PDE, the phenomenon of alpha-suppression has been explored by several investigators, who re-ported differences between headache and migraine patients: IPS at rates of 20 Hz in patients suffering from migraine did not lead to the alpha-suppression which occurs in healthy volunteers. In some patients IPS elic-ited even an activation of brain waves simi-lar to PDE (10-15).
The objective of the present study was to assess whether 20-Hz IPS elicits a stable decrease of GFP at different frequency bands in healthy volunteers. If such a systematic alteration could be ascertained, this finding could serve as a useful experimental para-digm in future studies.
Mate rial and Me tho ds
EEGs of 30 healthy subjects (16 males and 14 females; mean age = 34 years, SD = 11.7 years, range: 21-51, median = 31), from whom informed consent was obtained be-forehand, were recorded at rest for 40 s and under IPS series of 30 s each at 5, 10 and 20 Hz. White flashlight stimulation (single flashes, 0.5 J/flash) was applied with a stro-boscope placed at a distance of 20 cm in
front of the subjects who kept their eyes closed. Each train of flashlight stimulation was followed by an interval of 20 s. The recording was performed in a darkened, sound-proof and climatized room between 11 and 12 am. The subjects lay in a comfort-able recumbent position.
EEGs were recorded with 19 surface elec-trodes arranged according to the interna-tional ten-twenty-system, with a time con-stant of 0.3 s and a low-pass filter of 70 Hz. Frequency of digitalization was 512 Hz. Data were digitalized and computed by fast fourier transformation (FFT) for spectral analysis and brain mapping representation. This method, also known as EEG or brain map-ping, is a computer-assisted analysis of the conventional EEG. Brain waves recorded from the scalp with surface electrodes are amplified in a first step. At the same time, analogous signals are transformed into digi-tal data, i.e., voltage curves from each EEG electrode are recorded with a programmed frequency and are saved for subsequent off-line analysis by means of FFT, and spectra of frequency or amplitude can be calculated (16). These spectra show the distribution of amplitudes and frequencies of brain waves during a certain time interval for a single electrode. Data from single electrodes can be integrated by way of interpolation of C electrodes of an array A as described by Brandeis et al. (17):
C
GFP (A) = [1/C * S Ac2
]1/2
C = 1
troughs. GFP values for separate frequency bands can be calculated. The topographic
distribution of activity (power spectrum, µV2
) above the scalp surface can be displayed in various forms (1,18). Data from power analy-sis can be visualized in the form of two-dimensional color-coded brain maps (19). In addition, GFP dissimilarity (range 0 to 1) which compares two successive maps and is inversely related to the stability of potentials was calculated (17).
From each phase 20-s EEG recordings (i.e., rest versus trains of IPS) were obtained for spectral analysis. Artifacts due to muscle contraction, twinkling, inspiration, etc., were excluded in the off-line analysis. Data anal-ysis focused on four frequency bands: firstly ranges were defined according to the stimu-lation frequencies ± 10%, i.e., the 5-Hz fre-quency ranged from 4.5 to 5.5 Hz; the same procedure was applied to the 10-Hz and 20-Hz range. Secondly, the alpha range was confined to the area of 8 to 12 Hz.
The GFP data for 30 healthy volunteers at rest were compared to those obtained during IPS at 5, 10 and 20 Hz. In order to quantify PDE, R ratios were computed from GFP data at rest in comparison with those obtained from EEGs under IPS, i.e., R =
a-GFPIPS/a-GFPrest. All data were analyzed
qualitatively and are presented as box plots and histograms. T-value maps were com-puted according to the method of Duffy (20). Moreover, nonparametric Wilcoxon tests for related samples were applied for compari-son of alpha-GFP values at rest and under stimulation (21).
The protocol was approved by the Hospi-tal Ethics Committee.
Re sults
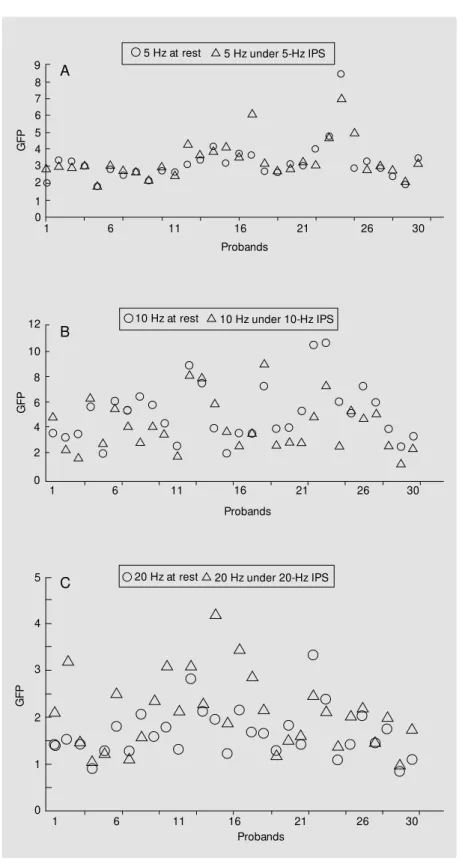
All subjects showed normal EEG results, which could be allocated to classical EEG categories and PDE was observed in all cases. Figure 1 shows original color-coded power maps of different frequency bands of a single
volunteer for different frequency bands at rest and for different photic stimulation con-ditions. Corresponding GFP values and dis-similarities were calculated. GFP at rest and under IPS displayed a high interindividual variability within defined frequency ranges but the data showed normal distribution (Fig-ure 2A-C). Generally, the highest GFP val-ues were found for the 10-Hz range, inde-pendently of the IPS conditions. Due to this marked variability of trends in flashlight-induced changes no stable ratio of GFP val-ues could be calculated in this context. In contrast, alpha-GFP ratios yielded more uni-form results. Whereas activity under 10-Hz IPS produced inconsistent changes with re-duction of alpha-power in approximately 70% of the subjects, intermitted photic stim-ulation with 20 flashes per second led in all cases to a homogenous desynchronization of waves which was expressed as a reduction of alpha-GFP.
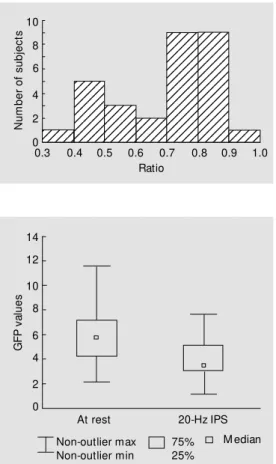
The R ratio of alpha-GFP under 20-Hz IPS and alpha-GFP at rest resulted in values lower than 1 (Figure 3). Eighteen of 30 vol-unteers showed ratios within the 0.8 and 1.0 range. The corresponding box plots are given in Figure 4 and show a difference of median GFP values of the order of 2. GFP differ-ences between values at rest and under IPS were highly significant (P<0.001) as proven
by a Wilcoxon test for matched pairs. T-test
analysis of spectral data above single
elec-trodes (so-called t-value mapping) revealed
that power reduction was most pronounced in the parieto-occipital region.
D iscussio n
addi-Figure 1. Pow er maps show ing activity distribution for delta-, theta-, alpha- and beta-ranges (row 1 to row 3) of a single individual (female, 29 years). The brain maps in the fourth row represent the analyzed frequency ranges corresponding to stimulation rates (fs) of 5, 10, 20 and 30 Hz. The corresponding global field pow er (GFP) and dissimilarity (Diss.) values are given below the respective maps.
Delta 0.0-1.5 GFP = 2.01
Delta 1.5-3.0 GFP = 3.40 Diss. = 0.10
Theta 3.0-5.0 GFP = 3.88 Diss. = 0.09
Theta 5.0-7.0 GFP = 3.35 Diss. = 0.11
Alpha 7.5-8.5 GFP = 2.51 Diss. = 0.15
Alpha 8.5-9.5 GFP = 4.38 Diss. = 0.07
Beta 13.0-18.0 GFP = 3.66 Diss. = 0.16
Beta 18.0-30.0 GFP = 2.81 Diss. = 0.11
fs5 GFP = 3.50 Diss. = 0.16
0.0 µV
Alpha 9.5-10.5 GFP = 4.96 Diss. = 0.14
Alpha 10.5-11.5 GFP = 7.35 Diss. = 0.04
Alpha 11.5-12.5 GFP = 4.23 Diss. = 0.07
Alpha 12.5-13.5 GFP = 4.91 Diss. = 0.02
fs10 GFP = 8.19 Diss. = 0.34
fs20 GFP = 2.47 Diss. = 0.22
fs30 GFP = 0.92 Diss. = 0.31
Figure 2. A, Comparison of global field pow er (GFP) values in the 5-Hz range at rest and during intermittent photic stimulation (IPS) w ith 5 Hz of 30 subjects. B, Comparison of GFP values in the 10-Hz range at rest and during IPS w ith 10 Hz of 30 subjects. C, Comparison of GFP values in the 20-Hz range at rest and during IPS w ith 20 Hz of 30 subjects.
G
F
P
12
10
6
4
2
0 8
1 6 11 16 21 26 30
Probands
B 10 Hz under 10-Hz IPS
10 Hz at rest
G
F
P
9 8 7 6 5 4 3 2
1 0
1 6 11 16 21 26 30
Probands
A
5 Hz under 5-Hz IPS 5 Hz at rest
1 6 11 16 21 26 30
Probands
G
F
P
5
4
3
2
1
0
Re fe re nce s
1. Zschocke S (1995). Klinische Elektroenze-phalographie. Springer, Heidelberg, Ger-many, 211-221.
2. M ast J & Victor JD (1991). Fluctuations of steady-state VEPs: interaction of driven evoked potentials and the EEG.
Electro-encephalography and Clinical Neurophysi-ology, 78: 389-401.
3. Anagnostou E, Kleiser R & Skrandies W (2000). Electrophysiological correlates of human intrasaccadic processing. Experi-mental Brain Research, 130: 177-187.
4. Skrandies W, Reik P & Kunze C (1999). Topography of evoked brain activity dur-ing mental arithmetic and language tasks: sex differences. Neuropsychologia, 37: 421-430.
5. Crocq M A, Beaubernard C, M inot R, 14 12 10 8 6 4 2 0 G F P v a lu e s
At rest 20-Hz IPS
Non-outlier max Non-outlier min
75% 25%
M edian Figure 4. Box plots including
median and 25 or 75% percen-tiles or non-outlier extreme val-ues of alpha-global field pow er (GFP) results at rest and under intermittent photic stimulation (IPS) w ith 20 Hz in 30 healthy subjects.
Figure 3. Distribution of ratios of alphaglobal field pow er follow -ing intermittent photic stimula-tion w ith 20 Hz and at rest in 30 healt hy volunt eers (P< 0.001, Wilcoxon test). N u m b e r o f s u b je c ts 8 6 4 2 0 10 12345 12345 12345 12345 12345 12345 12345 12345 12345 12345 12345 12345 12345 12345 12345 12345 12345 12345 12345 12345 12345 12345 12345 12345 12345 12345 12345 12345 12345 12345 12345 12345 12345 12345 12345 12345 12345 12345 12345 12345 12345 12345 12345 12345 12345 12345 12345 12345 12345 12345 12345 12345 12345 12345 12345
0.3 0.4 0.5 0.6 0.7 0.8 0.9 1.0
Ratio
patients compared local EEG changes above single electrodes (10,12,15) and revealed a decrease of power at single occipitoparietal electrodes induced by 20-Hz IPS in normal healthy volunteers. In the present study, GFP was employed as a criterion which integrates data gained from all surface electrodes. None-theless, attenuation of alpha-power led to a uniform decrease of GFP in the alpha-range compared to the initial data, indicating gen-eral desynchronization of brain activity. We conclude that, with regard to physiological occipital alpha-dominance, GFP as a global and general parameter reliably reflects local changes induced by IPS in the alpha-range and may thus be a practical and suitable instrument in daily clinical practice.
Further investigation will be needed to obtain comparable ratios from patient EEG data. Within this context, migraine and head-ache patients will be of special interest, since previous studies along with preliminary find-ings in our clinical experience suggest that migraine patients show significantly differ-ent electrophysiologic patterns of reaction to IPS with a flashlight in comparison to healthy controls (10,12,15). Within this context, miss-ing suppression or even an activation of brain waves during 20-Hz IPS is to be ex-pected in migraine patients.
A ratio lower than 1 may be an indicator of the disturbance of neuronal excitability of the visual cortex common in migraine (1,10,12,13,15). We conclude that the ratio obtained from GFP data may provide stable parameters and reproducible results. Further studies are needed to assess the clinical rel-evance of ratios and possible correlations between ratios and clinical features. tion, partially revealed harmonics. In
Deliry J-L & M acher J-P (1989). Applica-tion de l’EEG quantitative et de la carto-graphie EEG à l’étude des psychotropes. In: Rondot P, Gaches J & Sebban C (Edi-tors), Cartographie EEG: M éthodologie et Applications Cliniques. Editions M édi-cales. Frison-Roche, Paris, France, 207-216.
6. M ichel CM , Pascual-M arqui RD, Strik WK, Koenig T & Lehmann D (1995). Frequency domain source localization show s state-dependent diazepam effects in 47-chan-nel EEG. Journal of Neural Transmission (Genetic Section), 99: 157-171.
7. Jelic V, Dierks T, Amberla K, Almkvist O, Winblad B & Nordberg A (1998). Longitu-dinal changes in quantitative EEG during long-term tacrine treatment of patients w ith Alzheimer’s disease. Neuroscience Letters, 254: 85-88.
8. Jelic V, Blomberg M , Dierks T, Basun H, Shigeta M , Julin P, Jensen M , Lannfelt L, Winblad B & Wahlund LO (1998). EEG slow ing and cerebrospinal fluid tau levels in patients w ith cognitive decline. Neuro-Report, 9: 157-160.
9. Klotz JM , Heils A & Langohr HD (1992). Quantitative und topographische Analyse des Photic-Driving-Effektes bei Patienten
mit M igraine. Nervenheilkunde, 11: 316-322.
10. Genco S, de Tommaso M , Prudenzano AM , Savarese M & Puca FM (1994). EEG features in juvenile migraine: topographic analysis of spontaneous and visual evoked brain electrical activity: a comparison w ith adult migraine. Cephalalgia, 14: 41-46. 11. Grillon C & Buchsbaum M S (1986).
Com-puted EEG-topography of response to vi-sual and auditory stimuli. Electroencepha-lography and Clinical Neurophysiology, 63: 42-53.
12. Puca FM , de Tommaso M , Tota P & Sciruicchio V (1996). Photic driving in mi-graine: correlations w ith clinical features.
Cephalalgia, 16: 246-250.
13. Scheuler W (1983). Zur klinischen Bedeu-tung der gesteigerten Photostimulations-reaktion im Alpha-Frequenzbereich. Zeit-schrift für Elektroenzephalographie, Elek-tromyographie und Verw andte Gebiete, 14: 143-153.
14. Takahashi T (1993). Activation methods. In: Niedermeyer E & Lopes da Silva F (Editors), Electroencephalography. 3rd edn. Williams & Wilkins, Baltimore, M D, USA, 241-262.
15. Tsounis S & Varfis G (1992). Alpha rhythm
pow er and the effect of photic stimula-tion in migraine w ith brain mapping. Clini-cal Electroencephalography, 23: 1-6. 16. Brandl U & Wenzel D (1989). Advanced
programming techniques for activity map-ping on personal computers. In: M aurer K (Editor), Topographic Brain M apping of EEG and Evoked Potentials. Springer, Heidelberg, Germany, 129-135. 17. Brandeis D, Lehmann D, M ichel CM &
M ingrone D (1995). M apping event-re-lated brain potential microstates to sen-tence endings. Brain Topography, 8: 1-15. 18. Lehmann D & Skrandies W (1980). Refer-ence-free identification of components of checkerboard-evoked multichannel poten-tial field. Electroencephalography and Clinical Neurophysiology, 48: 609-621. 19. Klotz JM (1993). Topographic EEG
map-ping methods. Cephalalgia, 13: 45-52. 20. Duffy FH (1989). Topographic mapping of
brain electrical activity: Clinical applica-tions and issues. In: M aurer K (Editor),
Topographic Brain M apping of EEG and Evoked Potentials. Springer, Heidelberg, Germany, 19-52.