1D.Sc., Professor Adjunto, Programa de Engenharia Biomédica (PEB) - COPPE, Universidade Federal do Rio de Janeiro, Rio de Janeiro RJ, Brasil (UFRJ); 2D.Sc., Pesquisador, PEB - COPPE / UFRJ; 3Ph.D., Professor Titular, Laboratório de Neurobiologia e Neurofisiologia Clínica, Instituto Fernandes Figueira, FIOCRUZ, Rio de Janeiro; 4Ph.D., Professor Ti t u l a r, PEB - COPPE / UFRJ. This work received finan-cial support from the Brazilian Research Agency (CNPq) and the Rio de Janeiro State Research Foundation (FAPERJ).
Received 26 July 2005, received in final form 21 October 2005. Accepted 24 November 2005.
Dr. Antonio F. C. Infantosi - Caixa Postal 68510 - 21941-972 Rio de Janeiro RJ - Brasil. E-mail: [email protected]
SPECTRAL F-TEST POWER EVALUATION IN THE EEG
DURING INTERMITTENT PHOTIC STIMULATION
Antonio Mauricio F. L. Miranda de Sá
1, Mauricio Cagy
2,
Vladimir V. Lazarev
3, Antonio Fernando C. Infantosi
4ABSTRACT - Intermittent photic stimulation (IPS) is an important functional test, which can induce the photic driving in the electroencephalogram (EEG). It is capable of enhancing latent oscillation’s manifes-tations not present in the resting EEG. However, for adequate quantitative evaluation of the photic driv-ing, these changes should be assessed on a statistical basis. With this aim, the sampling distribution of spec-tral F test was investigated. On this basis, confidence limits of the SFT-estimate could be obtained for dif-f e rent practical situations, in which the signal-to-noise ratio and the number odif-f epochs used in the esti-mation may vary. The technique was applied to the EEG of 10 normal subjects during IPS, and allowed detecting responses not only at the fundamental IPS frequency but also at higher harmonics. It also per-mitted to assess the strength of the photic driving responses and to compare them in diff e rent derivations and in different subjects.
KEY WORDS: EEG, intermittent photic stimulation, photic driving, Spectral F test, quantitative analysis.
Avaliação do teste-F espectral do EEG durante fotoestimulação intermitente
RESUMO - A fotoestimulação intermitente (FEI) é um importante teste functional, que pode induzir o f o t o re c rutamento no eletroencefalograma (EEG), sendo capaz de realçar manifestações latentes de oscilações não observadas no EEG de repouso. Entretanto, para uma análise quantitativa adequada do fotorecruta-mento, tais alterações devem ser avaliadas com base estatística. Assim, a distribuição de probabilidade do teste-F espectral (TFE) foi investigada. Neste sentido, limites de confiança para a estimativa do TFE pude-ram ser obtidos para diferentes situações práticas, nas quais a razão sinal-ruído e o número de épocas usadas na estimação podem variar. A técnica foi aplicada ao EEG de 10 sujeitos normais durante FEI, e per-mitiu a detecção de respostas não somente na freqüência fundamental da FEI como também em seus har-mônicos. Além disso, permitiu avaliar o grau de fotore c rutamento entre derivações distintas e entre dife-rentes sujeitos.
PA L AV R A S - C H AV E: EEG, fotoestimulação intermitente, fotore c rutamento, teste-F espectral, análise quanti-t a quanti-t i v a .
I n t e rmittent photic stimulation (IPS) is considere d as one of the most important functional neuro p h y s i o-logical tests that can induce photic driving in the elec-troencephalogram (EEG). It is capable of enhancing the latent oscillations’ manifestation including patho-logical alterations, which are not observable in the EEG of the resting state1 - 4. However, for an adequate quantitative evaluation of the photic driving these changes should be assessed on a statistical basis5.
Spectral F-Test (SFT) is a statistical test for assess-ing whether two sample spectra are from popula-tions with identical theoretical spectra, and has been
ob-In order to evaluate the performance of SFT in detect-ing drivdetect-ing responses, the power of the test should be estab-lished for distinct experimental conditions, i.e., diff e re n t
Mand SNR values. The probability of detection (PD) is the
a rea under the distribution of when response
oc-curs (expression 3) for abscise values greater than the t h reshold for the detection (critical value for testing the absence of response, expression 2). This process is illustrat-ed in Figure 1A for M=24 epochs, where PD is the shaded a rea. As can be noted, SNR=2 results in PD-value gre a t e r than that for SNR=1. Figure 1B displays PD for diff e re n t number of epochs (M=6, 12, 24, 48 and 96) as a monoton-ically increasing function of SNR. It can be observed that if SNR is fixed, PD increases as M is augmented. The SNR-val-ues that provide 95% of detection are also indicated by a rrows. The PD behaviour with M and SNR is due to the fact that the non-central F distribution is shifted to the right as λ( = 2M.SNR) increases, leading to greater probability of detecting responses. This can be easily seen in Fig 1A.
EEG data collectio n and pre - p rocessing – The SFT w as applied to EEG signals obtained from 10 normal childre n and adolescents (age range: 3-17 years) with no symptoms of neurological pathology and with normal visual evoked potential. None of them had a history of neurological, psy-chiatric or drug related illness. The local ethics committee approved this research.
EEG signals were re c o rded during a state of relaxed wa-kefulness (initial background, 2-3 min duration) and then over a period of 20-30 seconds during flash stimulation at the frequency of 6 Hz. The subjects kept eyes closed thro-ughout the examination. The multichannel EEG was acqui-red using the Nihon Kohden polygraph (EEG-4418) with 0 . 3 s time constant, 70 Hz high frequency filter (anti-alias-ing) and 15µV/mm sensitivity. Fourteen scalp m onopolar derivations (according to the International 10/20 System) with unilaterateral re f e rences to the corresponding earlo-bes were utilized in the EEG re c o rding. In the present study, only symmetrical occipital (O1and O2) and parietal (P3a n d P4) leads were used. The instants of the stimulation signal w e re also acquired in a separate channel in order to be used as a re f e rence when applying the signal pro c e s s i n g techniques.
The EEG signals digitized at a sampling frequency of 2 5 6 Hz, before and during stimulation, were sectioned into
M=10 epochs of equal duration (2 s). The power- s p e c t r a of the EEG before and during stimulation were estimated using the periodogram of Bartlett based on the Discre t e tion in (2) should be altered (not proved here) and the
sam-pling distribution of under H1 can be expressed as:
w h e re is non-central F distribution, λis the non-centrality parameter (SNR is the signal-to-noise ratio). A complete proof of λe x p ression is provided in1 0. It can be also derived with some further manipulations on the clas-sical results of Akaike11and Brillinger12.
w h e re ƒis the frequency index, “^” superscript denotes estimation, and Xi(f) and Yi(f), a re, re s p e c t i v e l y, the Fourier Tr a n s f o rm of the i -t hepoch of x[k] and y[k], which have been p a rtitioned into Mdisjoint segments each for carrying out the spectral estimation.
The case when no driving response occurs in the EEG leads x[k] and y[k] to be independent, Gaussian-distributed signals pertaining to populations with same theore t i c a l spectra. This reflects the null hypothesis H0, under which
is known to be distributed as8
tained. They constitute thresholds above which sta-tistical difference between the estimates can be ac-cepted.
H o w e v e r, in order to evaluate the power of SFT, i.e. the probability of correctly identifying spectral d i ff e rences (previous and during IPS), its sampling distribution should be investigated for the altern a t i-ve hypothesis (H1)9. Furt h e rm o re, on the basis of such distribution, the strength of the EEG driving re s p o n s e to the stimulation could be compared (e.g. through the confidence limits) in diff e rent cortical regions as well as in diff e rent subjects including patients versus c o n t rol group. Thus, the investigation of the sam-pling distribution of SFT under H1would bro a d e n the applicability of the technique to the EEG during IPS. This issue is exploited in the present work, where the power of SFT is assessed theore t i c a l l y. The metho-dology proposed was applied to the EEG of norm a l subjects during IPS.
METHOD
The spectral F test (SFT) for the discrete-time signals y [ k ]
( h e re assumed to re p resent an EEG lead during interm i t-tent stimulation) and x[k] (EEG signal immediately before stimulation) can be defined as8.
w h e re F2M,2M is the F- (Fisher) distribution with 2M a n d
2M degrees of freedom. Thus, for a given significance lev-el if is greater than the critical value of the F-distri-bution in (2) the hypothesis of absence of cortical re s p o n s e can be rejected.
distribu-Fig 1. A) Illustration of the PD calculation as the shaded areas under the probability density function (PDF) of the noncen -tral F-distribution defined in expression (3) (continuous line) for M=24 and for both SNR=1 (dark grey-shaded area) and SNR= 2 (light grey-shaded area). The distribution under the null-hypothesis of no response (H0) is also shown for M=24 in dashed
line. The critical value from this latter (Fc r i t- indicated by an
a rrow) is taken as the inferior limit for the integral evaluation, which results in the shaded area. B) Probability of detection (PD) with as a function of the signal-to-noise ratio (SNR e x p ressed in dB, i.e. ( S N R )d B= 1 0 • l o g ( S N R )) for diff e rent number of epochs (M=6, 12, 24, 48 and 96). SNR-values that lead to 95% expected detection rate are indicated by arrows.
Fourier Tr a n s f o rm of the 2 s duration epochs (fre q u e n c y resolution of 0.5 Hz). The SFT was calculated using the EEG p o w e r- s p e c t rum during stimulation in the numerator of e x p ression (1) and that of the EEG before stim ulation, in the denominator1 3. The critical value for the null hypothe-sis of absence of response was determined by setting a 5% p e rcentage of significance (α) in the sampling distribution of (2). This leads to critical value for equal to 2.121 3. In order to test the alternative hypothesis (H1) of the pre s-ence of a driving response, based on (3) the confids-ence lim-its (95%) were determined.
RESULTS
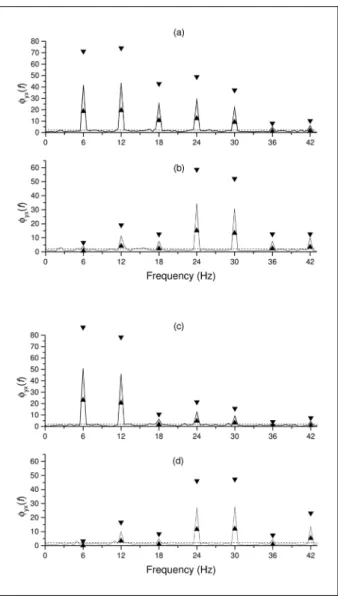
F i g u re 2 illustrates the application of the SFT tech-nique to the EEG from subject #8. It can be noted in both occipital and parietal leads that e x c e e d s the critical value (shown as a horizontal dotted line) at the stimulus frequency (6 Hz) and harmonics, even in the beta-2 and in the lower gamma bands. In addi-tion, the responses, as measured by , are stro n-ger in O1(O2) than in P3(P4), which is in accordance with the literature on the EEG photic driving2 , 4. Such d i ff e rences can be assessed through the comparison of the 95% confidence limits (indicated with trian-gles), which also indicate that the strength of the E E G
Fig 2. (obtained according to expression (1) with M=10 epochs) for subject #8 stimulated with stroboscopic flash at 6 Hz in the derivations: A) O1, B) P3, C) O2and D) P4. The criti
driving response at 6 and 12 Hz in O1( O2) are signi-ficantly higher than those at 36 and 42 Hz. On the other hand, for derivation P3( P4) the strongest driv-ing response occurs at 24 and 30 Hz.
In Figure 3 , is depicted for the first harm o n-ic of the stimulation frequency of 6 Hz in both occip-ital and parietal leads for all 10 subjects. It can be no-ted that there are substantial diff e rences in detect-ing response ( >2.12) between occipital and pari-etal leads. While O1( O2) demonstrates a 100% detec-tion, in P3( P4), only 40% of the subjects show such estimate higher than the critical value. Small diff e re n-ces were found however between homologue leads which would indicate inter-hemispheric symmetry. For the occipital leads, considering the 95% confiden-ce limits, one can state that the strength of driving
response in subjects # 9 and 10 is significantly high-er than that for the othhigh-er subjects. It is also noted that for both subjects the photic driving response is higher in P3than in P4.
DISCUSSION
The application of the Spectral F-Test allows de-tecting responses not only at the fundamental IPS f requency of 6 Hz but also at higher harmonics inclu-ding the frequencies within the upper beta and low-er gamma bands. More o v e r, using the altlow-ernative hy-pothesis of the presence of response and the 95% confidence interval it is possible to apply this statis-tical technique as an indicator of the strength phot-ic driving response. Thus, SFT can be used to compa-re the stcompa-rength of the driving compa-response in distinct brain regions, at diff e rent frequencies in the same location and in diff e rent subjects, e.g. controls and patients. This capacity (ability) can give certain advan-tage to SFT over spectral peak amplitude measure-m e n t4since the former in contrast to the latter deals with changes based on statistical criterion (significan-ce level).
The curves obtained for the probability of detect-ing a spectral change (which should reflect photic driving in the EEG during IPS) can provide import a n t information in clinical application, such as the mini-mum data stretch necessary for a 95% detection rate in a signal with a given signal-to-noise ratio. Thus, for SNR close to zero, i.e. response and background with close amplitude-values, a minimum of 48 epochs should be used to provide 95% detection. On the o-ther hand, for SNR close to –2 dB (which reflects am-plitude response nearly 1.6 times smaller than that of background EEG), this number should be doubled to maintain the same detection rate.
All these findings show a broad potential of the SFT application to the estimation of the EEG photic driving reactions, particularly in special experimen-tal and clinical conditions which demand a finer sensi-tivity of the EEG characteristics to the functional sta-tes of the brain. It looks promising in the topograph-ic approach to the study of the driving effects in the brain ontogenetic development, in the study of func-tional alterations in neurological and psychiatric dis-eases, for instance, etc. where it can improve a diag-nostic value of the IPS functional test.
REFERENCES
1. Chatrian GE, Bergamini L, Dondey M, Klass DW, Lennox-Buchthal M, Petersen I. A glossary of terms most commonly used by clinical elec-t roencephalographers. Elecelec-troenceph Clin Neurophysiol 1974;37: 538-548.
Fig 3. (obtained according to expression (1) with M= 1 0 epochs) at the frequency of stimulation (6 Hz) is indicated by a circle and the 95% confidence limits are indicated with tri -angles for each of the subjects in the derivations: A) O1, B) P3, C) O2and D) P4. Critical values (α=5%) are shown in horizon
2. Takahashi T. Activation methods. In Niedermeyer E, Lopes da Silva FH (eds). Electroencephalography: basic principles, clinical applica-tions, and related fields. 4t hEd. Baltimore: Williams & Wilkins, 1999: 261-284.
3. L a z a rev VV, Simpson DM, Schubsky BM, de Azevedo LC. Photic driv-ing in the electroencephalogram of children and adolescents: harmon-ic stru c t u re and relation to the resting state. Braz J Medi Biol Res 2001; 34:1573-1584.
4. L a z a rev VV, Infantosi AFC, Valencio-de-Campos D, de Azevedo LC. Topographic aspects of photic driving in the electroencephalogram of children and adolescents. Braz J Medi Biol Res 2004;37:879-891. 5. Miranda de Sá AM, Infantosi A F. Evaluating the entrainment of the
alpha rhythm during stroboscopic flash stimulation by means of coher-ence analysis. Med Eng Phys 2005;27:167-173.
6. Simpson DM, Tierra-Criollo CJ, Infantosi AFC. Objective response de-tection in an electroencephalogram during somatosensory stimulation. Ann Biom Med Eng 2000;28:621-698.
7. Ramos EG, Zaeyen EJB, Simpson DM, Infantosi AFC. Detecção de re
s-posta auditiva no EEG de crianças utilizando técnicas no domínio da freqüência. Rev Bras Eng Biomed 2000;16:127-137.
8. Shumway RH. Applied statistical time series analysis. London: Pre n t i c e Hall, 1988:77-84.
9. Kay SM. Fundamentals of statistical signal processing: detection the-ory. New Jersey: Prentice-Hall, 1998;2:60-93.
10. Miranda de Sá AMFL, Infantosi AFC. A c o h e rence-based technique for evaluating the degree of synchronism in the EEG during sensory stim-ulation. Rev Bras Eng Biome 2002;18:39-49.
11. Akaike H. On the statistical estimation of the frequency response func-tion of a system having multiple input. Ann Inst Stat Mth 1965;17: 185-210.
12. Brillinger DR. Time series: data analysis and theory. San Francisco: Holden-Day, 1975.