Environmental group identification for upland rice
production in central Brazil
Alexandre Bryan Heinemann
1*, Paulo Cesar Sentelhas
21
Embrapa Arroz e Feijão, Rod. GO-462, km 12 Zona Rural, C.P. 179 – 75375-000 – Santo Antônio de Goiás, GO – Brasil.
2
USP/ESALQ – Depto. de Engenharia de Biossistemas, C.P. 09 – 13418-900 – Piracicaba, SP – Brasil. *Corresponding author <[email protected]>
Edited by: Luis Reynaldo Ferracciú Alleoni
ABSTRACT: Upland rice (Oryza sativa L.) production is basically concentrated in four central Brazilian States, Mato Grosso, Goiás, Rondônia and Tocantins. To reduce the genotype and environment (G × E) interactions, the classification of environment groups was proposed. The goal of this study explores possibilities to adjust the upland rice regional breeding systems to optimally fit to the range of environments they are targeting, based on a historical yield data set of the Brazilian Geographic and Statistics Institute (IBGE, www.ibge.gov.br/home/) from 54 microregions. The specific objectives of this study were: (i) to identify and classify environmental groups in the Brazilian upland rice production area; (ii) to validate these environmental groups using yield data set from the upland rice multi-trial experiments (MTEs); (iii) and to identify the most representative site for each environmental group. For this the historical upland rice yield data from 54 microregions were detrented from the effects of technological advances and adjusted to the reference year, 2006. The adjusted yield data were used to build a matrix, which was submitted to a cluster analysis allowing the identification of three different environmental groups. These groups were classified as: highly favorable environment (HFE); favorable environment (FE); and less favorable environment (LFE). The HFE is less affected by inter-annual rainfall variability than the other two groups. The upland rice breeding programs must take into account the differences among the environmental groups to conduct their trials and suggest genotypes for the upland production area.
Keywords: environment classification, breading program, cluster analysis, yield
Introduction
Upland rice (Oryza sativa L.) (ULR) environments experience multiple abiotic stresses and are character-ized by high levels of uncertainty caused by rainfall vari-ability (Tuong et al., 2000). Production areas are charac-terized by high heterogeneity, related to both climate and soil fertility (Piggin et al., 1998). One of the main environmental limiting factors for rice production is soil water availability, mainly in the Brazilian savannahs where subsoil acidity leads to a restricted rooting depth, which increases the effects of moderate droughts. There-fore, better quantification of the existing climatic risks for ULR production is urgently needed (Howden et al., 2007; Maia et al., 2007).
Brazilian ULR breeding program looks for the de-velopment of genotypes (G) with wide adaptability across all environments (E) based on G and E interac-tion (G × E) from the multi-trial experimental yield data (MTEs). In many cases, the analyses of large scale METs can be a major impediment for the genetic progress of the crop (Vega and Chapman, 2006). To reduce the G × E or specifically the cross-over interaction, Braun et al. (1996) proposed the classification of mega-environments (MEs) and defined them as the growing region of a crop species where the environmental conditions are rela-tively homogenous. ME classification helps the breed-ing programs to target the deployment of the germplasm, and increases the heritability of selection and,
ulti-mately, the efficiency of the breeding program (Hernandez-Segundo et al., 2009).
Due to the extension of the ULR production area, the determination of MEs is generally limited by the lack of the required MTE data. Therefore, this study explores possibilities to adjust the Brazilian upland rice regional breeding systems to optimally fit the range of environ-ments they are targeting, based on a historical yield data set from the Brazilian Geographic and Statistics Institute (IBGE - www.ibge.gov.br/home/). The specific objec-tives of this study were to identify and classify environ-mental groups in the Brazilian ULR production area, to validate and classify these groups using an independent yield data set from MTEs, and to identify the most rep-resentative sites for each environmental group.
Materials and Methods
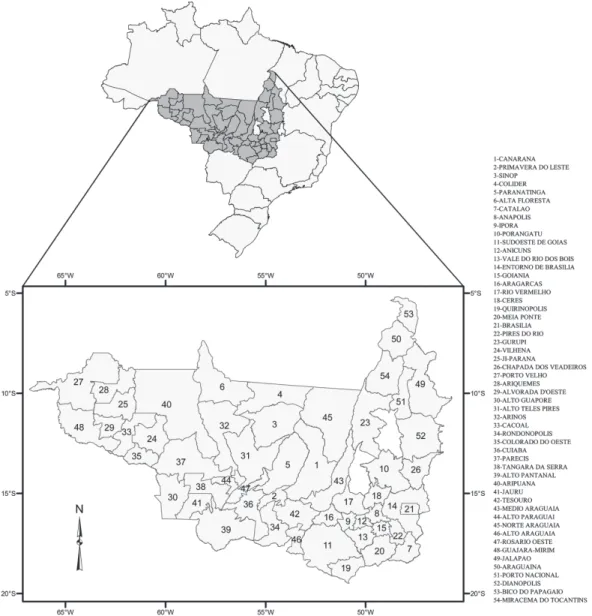
Microregions in Brazil were established and defined by Brazilian Institute of Geography and Statistics - IBGE (1990) as a group of contiguous counties in a same state. The reason for use of microregions, as the smallest scale in this study, is due to the fact that several counties have been split or merged during the last 35 years, which makes it difficult to use the upland rice historical yield from counties.
The yield from a microregion represents an average of county yields that belong to the same microregion. Figure 1 illustrates all microregions located in the four states, which do not consider the tropical rice flood area. Basically, for all these microregions, upland rice yield has increased exponentially over this period. However, the historical upland rice yield data collected by IBGE represents the interaction of climate variability and tech-nological advances for the period. As we only have in-terest on the yield impact caused by climate variability in this period, there is a need to detrend the effects of
technological advances from the yield data by adjusting them to a reference year, 2006. This procedure was made using a methodology similar to that applied by Fernandes et al. (2010) and Hollinger et al. (2001). A trend line was fit to the yield data for each microregion using a non parametric locally weighted polynomial re-gression known as loess (Cleveland, 1979). The predicted trend line values were considered as technological ad-vances. The relative deviation represents the climate variation, and was calculated based on the following equation:
1n x y RD
y
−
= (1)
where: n
RD1 is the relative deviation from the initial (1) to the last (n) yield in the period; x is the observed yield (kg ha–1
); y is the predicted yield calculated by loess regres-sion (kg ha–1
).
The adjustment of all yields for the last available yield data from AGROTEC, e.g. 2006, was made based on the following equation:
(
)
n n n RD y
AY 1*
1
1 = + (2)
where: AY is the adjusted yield (kg ha–1).
In equation (2), RD values have to be added to 1 be-cause all values are always less than 1. To develop the environmental characterization of the production area (Figure 1), a matrix was established consisting of microregion names and years (from 1975 to 2006), tak-ing into account the respective adjusted yield from each microregion and year obtained by the detrended pro-cess. This classification employed a hierarchical agglomerative clustering method (Williams, 1976) with a squared Euclidian distance as the dissimilarity mea-sure, and incremental sum of squares (Ward, 1963) as the fusion criterion. The same methodology for environ-ment characterization was used by Heinemann et al. (2008). Three classes were adopted to classify the envi-ronmental groups in the upland rice production area: highly favorable environment (HFE); favorable environ-ment (FE); and less favorable environenviron-ment (LFE).
To validate the difference among the environmental groups, we calculated the uncertainty index based on an in-dependent upland rice yield data from the breeding pro-gram multi-trial experiments (MTEs). From the yield data set of the MTEs, the yield data from the cultivar BRS Primavera, available from 1999 to 2008, were used. This cultivar was chosen because it is the most cultivated in the ULR production region, representing about 45 % of the genotypes growth and also after 1999 it has been used as a check crop in the MTEs. As the yield from the MTEs is stored by county, the BRS Primavera data yield obtained in a same cropping season, but in differ-ent counties located in the same microregion, were av-eraged to obtain the BRS Primavera yield data by microregion for each cropping season from 1999 to 2008. The uncertainty index, proposed by Heinemann et al. (2002) for each environment group was calculated accord-ing to eq. (3):
1
(
1)
22
n n
n x x
n
σ =
∑
−∑
(3)where: α is the variance of the upland rice BRS Primavera yield data for a chosen cropping season in different microregions located at the same environmen-tal group, n is the number of trials for a given cropping season and x is the BRS Primavera yield data for a given trial and cropping season, and eq. (4):
1( ) n y
ny
σ
=
∑
(4)where: y is the uncertainty index for each environmen-tal group for BRS Primavera yield data from 1999 to 2008 cropping seasons; and ny is the number of years for each environmental group.
The most representative sites for each environment group were determined based on the average of the ad-justed yield frequency occurrences.
Results
Environment groups identification for upland rice production area
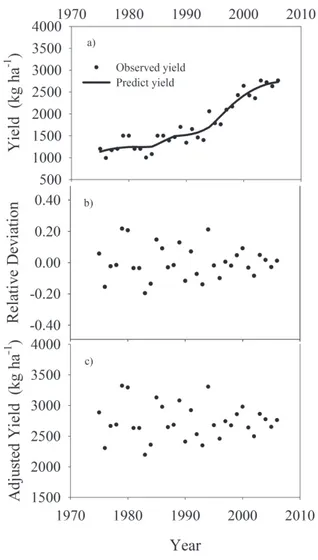
The detrended process is an important step for evalu-ating yield variability of series for long periods. As men-tioned before, all the microregions evaluated in this study were submitted to the detrended process, which made it possible to identify and classify the environmen-tal groups in relation to upland rice adjusted yield as a function of their predominant climatic conditions. An example of the detrended process is presented for the Parecis microregion, located in the Mato Grosso State (Figure 2). The loess trend line over the upland rice
served yield data (Figure 2a) has a defined tendency of yield increase, evidencing the presence of technological advances in this microregion. For this microregion, rela-tive yield deviation ranged from -0.20 to 0.22 (Figure 2b) and the adjusted yield from 2194 to 3321 kg ha–1 (Figure 2c).
Based on the cluster analysis of the historical ad-justed yield data from the AGROTEC database, the up-land rice production region was classified in the three environmental groups (Figure 3). The HFE is composed by 11 microregions: Sinop (3); Colider (4); Alta Floresta (6); Arinos (32); Alto Teles Pires (31); Parecis (37); Norte Araguaia (45); Jauru (41); and Alto Pantanal (39), in the state of Mato Grosso, and Colorado do Oeste (35) and Vilhena (24), in the state of Rondônia (Figures 1 and 3). Silva and Assad (2001), based on a regional climatic risk assessment, also described the Mato Grosso state as a favorable environment for upland rice production, with a well distributed rainfall during the growing season, a lower rainfall inter-annual variability and a large win-dow of sowing dates. This environment had the highest average of adjusted yield (2,740 kg ha–1) and minimum and maximum adjusted yield of 1720 and 4,629 kg ha–1
. The majority of their microregions have the adjusted yields in the second quartile (Figure 4a). This environ-ment also shows the lowest variation in the relative de-viation (Figure 4b), which means that the upland rice production is more stable.
The average adjusted yield for each microregion clas-sified as HFE is illustrated in the upper part of Figure 5. The highest averaged adjusted yield for this environ-ment was obtained in the microregion of Arinos, MT, with more than 3,000 kg ha–1 (Figure 5). The HFE is char-acterized by having higher average yield in the north re-gion of the Mato Grosso State and it decreases moving
to south, with exception to Jauru and Alto Pantanal, east and west directions. Probably, the decrease on the aver-age adjusted yield from north to south can be explained by changing in the rainfall inter-annual variability due to the fact that the north area is affected by atmospheric systems from the Amazonia region, such as the tropical Mesoscale Convective Complex and south region by the extratropical system such as cold fronts and instabili-ties (Reboita et al., 2010; Keller Filho et al., 2005).
The FE is composed by 16 microregions distributed in three States, Rondônia, Mato Grosso, and Goiás. In this environment, the minimum, maximum and average values of adjusted yield were 1,061, 3,260 and 2,247 kg ha–1. For FE, the adjusted yield and the relative devia-tion are distributed equality in the third and second quartile (Figure 4a and 4b). The highest averaged ad-justed yield was found in Anápolis, a microregion of the Goiás State (Figure 5).
The LFE is composed by 27 micro-regions located in four states, Tocantins, Goiás, Mato Grosso and Rondônia, considered the largest part of the upland rice production area of Brazil. However, most of the microregions in this environment are located in the Tocantins and Goiás States. In this environment, the minimum, maximum and average values of adjusted yield were 859, 3,129 and 1,725 kg ha–1. The highest aver-age adjusted yield was found in the Ceres microregion, state of Goiás, and the lowest in the Araguaína microregion, state of Tocantins (Figure 5).
The relative density of the three environmental groups is shown in Figure 6a. The average of adjusted yields in-creased from LFE to HFE as well as their standard devia-tions.
Figure 4 – Variation of upland rice adjusted yield (a) and its relative deviation (b) for the three environmental groups in Brazil Central region: less favorable (LFE), favorable (FE) and highly favorable (HFE) environment.
Validation of the environmental groups
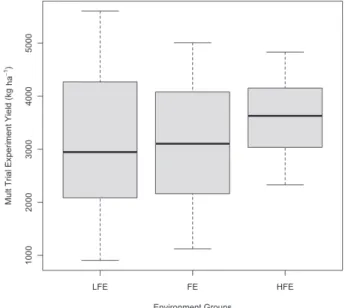
To validate the three environmental groups, MTEs up-land rice yield data from cultivar the BRS Primavera were used. Table 1 shows the microregions where MTEs were conducted and the considered cropping seasons. The variation of MTEs yield data for each environmental group is presented in
Figure 7. The lowest variation occurred at the best envi-ronmental group (HFE). The minimum, maximum and average MTEs yields for this group were 2,331, 4,832 and 3,551 kg ha–1
. The highest yield variation was found in LFE, the minimum, maximum and average METs yield being 906, 5604 and 3094 kg ha–1. For FE, the minimum, maximum and average MTEs yields were 1,124, 5,078 and 3,104 kg ha–1
. The yield data variability from the MTEs (Figure 7) indicates the same trend observed for adjusted yield from the AGROTEC database (Figure 4a). The average MET yields values for LFE and FE are almost the same (Figure 6b), although LFE has shown the lowest standard deviation. The HFE for MET yields have the highest yield as well as standard deviation.
The uncertainty index for the METs yields (Table 1) is much higher for LFE than for FE and HFE, the differences among the uncertainties are also higher for FE in relation to HFE than for LFE in relation to FE. The same trend is ob-served for the average yield as well as for the relative density (Figure 6b). However, for adjusted yield data from the AGROTEC database, the differences among environmental groups for the average data (Figure 4a) and relative density (Figure 6a) are more evident.
Discussion
This study is based on the concept that it is possible to use the upland rice adjusted yield from IBGE histori-cal series (AGROTEC database) to identify environmen-tal groups for upland rice production in central Brazil. We identified three environmental groups with differ-ent levels of yield variation, the LFE group having the highest yield variation. The yield data analysed from the METs showed the same yield variation trend observed from adjusted yields, LFE presenting also the highest
Figure 6 – Relative density for the less favorable (LFE), favorable (FE) and highly favorable (HFE) environmental groups for: a) adjusted yield from AGROTEC data base and b) BRS Primavera yield from the multi-trial environments (MTEs).
Figure 7 – Variation of BRS Primavera multi-trail upland rice yields for the three environment groups in Brazil Central region: less favorable (LFE), favorable (FE), and highly favorable (HFE) environments. Figure 5 – Mean upland rice adjusted yield (AGROTEC data
Numbers refer to the microregions in Figure 1 legend.
Table 1 – Microregions and crop seasons in the upland rice breeding program multi-trial experiments (MTEs) used for the validation process of environmental identification and their uncertainty index.
s t n e m o r i v n E ) E F H ( t n e m n o r i v n E e l b a r o v a F y l h g i
H FavorableEnvironment(FE) LowFavorableEnvironment(LFE)
n o s a e S p o r
C Microregion CropSeason Microregion CropSeason Microregion
0 0 / 9
9 31 99/00 30 99/00 53
0 0 / 9
9 35 99/00 1 99/00 23
0 0 / 9
9 37 99/00 15 99/00 10
0 0 / 9
9 24 99/00 34 99/00 51
1 0 / 0
0 39 00/01 30 99/00 2
1 0 / 0
0 4 00/01 28 99/00 11
1 0 / 0
0 3 00/01 15 00/01 20
1 0 / 0
0 24 00/01 13 00/01 10
2 0 / 1
0 39 01/02 8 00/01 51
2 0 / 1
0 31 01/02 28 00/01 27
2 0 / 1
0 4 01/02 15 00/01 2
2 0 / 1
0 41 01/02 13 00/01 11
2 0 / 1
0 3 02/03 8 01/02 25
2 0 / 1
0 24 02/03 28 01/02 11
3 0 / 2
0 39 02/03 15 02/03 23
3 0 / 2
0 4 02/03 13 02/03 25
3 0 / 2
0 41 03/04 28 02/03 51
3 0 / 2
0 3 03/04 15 03/04 7
3 0 / 2
0 24 03/04 38 03/04 25
4 0 / 3
0 4 04/05 8 03/04 20
4 0 / 3
0 3 04/05 28 03/04 27
4 0 / 3
0 24 04/05 15 04/05 7
5 0 / 4
0 39 04/05 13 04/05 51
5 0 / 4
0 31 05/06 8 04/05 27
5 0 / 4
0 32 05/06 15 04/05 11
5 0 / 4
0 41 05/06 13 05/06 25
5 0 / 4
0 3 06/07 8 05/06 20
5 0 / 4
0 24 06/07 21 06/07 23
6 0 / 5
0 39 06/07 15 06/07 25
6 0 / 5
0 41 06/07 38 07/08 33
6 0 / 5
0 3 06/07 13 07/08 23
6 0 / 5
0 24 07/08 8 07/08 22
7 0 / 6
0 39 07/08 28 07/08 27
7 0 / 6
0 31 07/08 15
7 0 / 6
0 41 07/08 38
7 0 / 6
0 3 07/08 13
8 0 / 7
0 31
8 0 / 7
0 41
8 0 / 7 0 3 8 0 / 7
0 24
x e d n i y t n i a t r e c n
yield variation. The uncertainty index based on MTEs with BRS Primavera yield data was higher for LFE and lower for HFE (Table 1). Probably, the main reason for this is the rainfall inter-annual variability among the en-vironmental groups once those experiments in the multi-trial system have the same fertilization and crop man-agement procedures. Other differences observed be-tween adjusted yield data from AGROTEC database and yield data from MTEs include the yield variability (Fig-ure 7) as well as the relative density (Fig(Fig-ure 6b). For LFE and FE from the MTEs data were not much different as LFE and FE from the AGROTEC database (Figure 4a). The reason for this is based on the fact that yield from the AGROTEC data base came from rice producers and these producers located at LFE may have practiced a low input agriculture due to the high probability of low yields, which increases the uncertainty and decreases the adoption of better crop management practices. On the other hand, as already explained, the experiments in the MTEs have the same high tech fertilization and crop management procedures, which minimize yield differ-ences among favorable cropping seasons between LFE and FE.
Environmental groups and breeding program
This analysis and the subsequent site clustering were based solely on grain yield. We assumed the adjusted grain yield as being representative of all traits that collectively determine upland rice productivity in an environment. The location of the experimental trials under the most representative environment groups are crucial for deter-mining the true value of a given genotype to be used for both genetics and plant breeding applications. Basically, breeding activities for upland rice in Brazil are based on direct selection for grain yield. Based on that, the HFE can be considered the best environmental group to compare genotype performance by direct selection for grain yield. This environmental group is expected to have less influence of climatic variability, as those caused by the El Niño Southern Oscillation (ENSO) phenomena in the other environments, and, conse-quently, the lowest difference between potential and ac-tual upland rice yields. For this environment, upland rice genotypes that have high effective water use should be recommended for production.
Effective water use implies in maximum soil water capture for transpiration which also involves reduced non-stomatal transpiration and minimum water loss by soil evaporation (Blum, 2009). Modern cultivars, e.g. BRS Primavera and BRSMG Curinga, are good ex-amples of genotypes with higher effective water use than old cultivars such as Douradão (Heinemann et al., 2011). Modern plant breeding has been more success-ful in favorable growing conditions than in unfavorable conditions (Araus et al., 2002; Byerlee and Husain et al., 1993). Based on the frequency of average adjusted yields, the microregions of Jauru, Norte-Araguaia, Sinop, Parecis, Colíder (MT), Colorado-do-Oeste and Vilhena (RO) are the most representative for HFE. For
these microregions highest frequency of averaged ad-justed yield ranged from 2,600 to 2,800 kg ha–1. These microregions are the best candidates to receive genotype trials for highest yields. On the other hand, breeding pro-grams focusing on drought resistance or tolerance should have their trials conducted preferably in LFE, where climatic variability will allow the upland rice crop to face water deficit more frequently.
The most representative sites for receiving MTEs at LFE are Paranatinga, Primavera-do-Leste, Alto-Paraguai (MT), Cacoal, Ji-Paraná (RO), Meia-Ponte, Porangatu, Iporá, Pires-do-Rio, Catalão (GO), Porto-Nacional (TO) and Brasília (DF). For these microregions, the highest fre-quency of average adjusted yield ranged from 1800 to 1900 kg ha–1. For FE, the most representative microregions are Aripuanã, Alto Araguaia, Rosário Oeste, Tangará-da-Serra, Rondonópolis (MT), Guajará-Mirim (RO), Chapada dos Veadeiros, Vale do Rio dos Bois, Goiânia and Anicuns (GO). The highest frequency of average adjusted yield ranged from 2,100 to 2,400 kg ha–1.
Breeding programs such as the Brazilian upland rice program can benefit from this knowledge by actively se-lecting parental materials from key sites for crossing, and by selecting and testing the derived lines at key lo-cations within these environmental groups.
Acknowledgements
To CNPq, for the support of the research project n. 471853/2010-0.
References
Araus, J.L.; Slafer, G.A.; Reynolds, M.P; Royo, C. 2002. Plant breeding and drought in C3 cereals: what should we breed for? Annals of Botany 89: 925-940.
Blum, A. 2009. Effective use of water (EUW) and not water-use efficiency (WUE) is the target of crop yield improvement under drought stress. Field Crops Research 112: 119-123.
Braun, H.J.; Rajaram, S.; Van Ginel, M. 1996. CIMMYT’s approach to breeding for wide adaptation. Euphytica 92: 175-183.
Byerlee, D.; Husain, T. 1993. Agricultural research strategies for favorable and marginal areas: the experience of farming systems research in Pakistan. Experimental Agriculture 29: 155-171. Chaib Filho, H.; Garagorry, F.L.; Machado Júnior, J.R.R. 2002.
Utilization of AGROTEC/Cerrados data base to evaluate the agriculture evolution at Cerrados. Embrapa Cerrados, Planaltina, DF, Brazil. 15 p. (Boletim de pesquisa e desenvolvimento, 54) Available at: http://www.cpac.embrapa.br/publicacoes/bolpd/ 1 [Accessed Jan. 6, 2011]. (in Portuguese).
Cleveland, W.S. 1979. Robust locally weighted regression and smoothing scatterplots. Journal of the American Statistical Association 74: 829-836.
Instituto Brasileiro de Geografia e Estatística [IBGE]. 1990. Brazilian Regional Geographic Division in Mesoregions and Microregions. IBGE, Rio de Janeiro, RJ, Brazil. v.1. (in Potuguese).
Fernandes, D.S.; Heinemann, A.B.; Paz, R.F.L.; Amorim, A.O. 2010. Performance of quantitative drought indices in the upland rice yield estimates. Pesquisa Agropecuária Brasileira 45: 771-779. (in Portuguese, with abstract in English).
Heinemann, A.B.; Stone, L.F.; Fageria, N.K. 2011. Transpiration rate response to water deficit during vegetative and reproductive phases of four upland rice cultivars. Scientia Agricola 68: 24-30.
Heinemann, A.B.; Dingkuhn, M.; Luquet, D.; Combres, J.C.; Chapman, S. 2008. Characterization of drought stress environments for upland rice and maize in central Brazil. Euphytica 162: 395-410.
Heinemann, A.B.; Hoogenboom, G.; Chojnicki B. 2002. The impact of potential errors in rainfall observation on the simulation of crop growth, development and yield. Ecological Modelling 157: 1-21.
Hernandez-Segundo, H.; Capettini, F.; Trethowan, R; Van Ginkel, M.; Mejia, A.; Carballo, A.; Crossa, J.; Vargas, M.; Balbuena-Melgarejo, A. 2009. Mega-environment identification for barley based on twenty-seven years of global grain yield data. Crop Science 49: 1705-1718.
Hollinger, S.E.; Ehler, E.J.; Carlson, R.E. 2001. Midwestern United States corn and soybean yield response to changing El Ninõ-Southern oscillation conditions during the growing season. p. 33-56. In: Hatfield, J.L.; Volenec, J.J.; Dick, W.A.; Kral, D.M., eds. Impacts of El Niño and climate variability on agriculture. American Society of Agronomy, Madison, WI, USA. (Special Publication, 63).
Howden, S.M.; Soussana, J-F.; Tubiello, F.N.; Chhetri, N.; Dunlop, M.; Meinke, H. 2007. Adapting agriculture to climate change. Proceedings of the National Academy of Sciences of the United States of America 104: 19691-19696.
Keller Filho, T.; Assad, E.D.; Lima, P.R.S.R. 2005. Rainfall homogeneous areas in Brazil. Pesquisa Agropecuária Brasileira 40: 311-322. (in Portuguese, with abstract in English). Maia, A.H.N.; Meinke, H.; Lennox, S.; Stone, R.C. 2007. Inferential,
non-parametric statistics to assess quality of probabilistic forecast systems. Monthly Weather Review 135: 351-362.
Piggin, C.; Courtois, B.; George, T.; Pandey, S.; Lafitte, R.; Kirk, G.; Kondo, M.; Leung, H.; Nelson, R.; Olofsdotter, M.; Prot, J.C.; Reversat, G. 1998. The IRRI Upland Rice Research Program. International Rice Research Institute, Los Banõs, Philippines. (IRRI. Discussion Paper Series, 25).
Reboita, M.S.; Gan, M.A.; Rocha, R.P.; Ambrizzi, T. 2010. Precipitation regimes in South America: a bibliography review Revista Brasileira de Meteorologia 25: 185-204. (in Portuguese, with abstract in English).
Silva, S.C.; Assad, E.D. 2001. Regional climatic risks zoning for upland rice in the States of Goiás, Mato Grosso, Mato Grosso do Sul, Minas Gerais, Tocantins, and Bahia. Revista Brasileira de Agrometeorologia 9: 536-543. (in Portuguese, with abstract in English).
Tuong, T.P.; Kam, S.P.; Wade, L.; Pandey, S.; Bouman, B.A.M.; Hardy, B., eds. 2000. Characterizing and Understanding Rainfed Environments. International Rice Research Institute, Los Banõs, Philippines.
Vega, A.J.; Chapman, S.C. 2006. Defining sunflower selection strategies for a highly heterogeneous target population of environments. Crop Science 46: 136-144.
Ward, J.H. 1963. Hierarchical grouping to optimize an objective function. Journal of the American Statistical Association 58: 236-244.
Williams, W.T. 1976. Pattern Analysis in Agricultural Science. Elsevier Scientific, Amsterdam, The Netherlands.