Vol.46, n. 3 : pp. 323-332, June 2003
ISSN 1516-8913 Printed in Brazil
BRAZILIAN ARCHIVES OF
BIOLOGY AND TECHNOLOGY
A N I N T E R N A T I O N A L J O U R N A L
Evaluation of the Average Performance of Topcrosses
Among Food and Grain Type Soybean
Gilberto K. Yokomizo
1∗and Natal A. Vello
21
Embrapa Amapá; CPAFAP; Rod. JK km 05; C. P. 10; 68902-280; Macapá - AP - Brazil. 2Departamento de Genética; ESALQ/USP; C. P. 83; 13400-970; Piracicaba - SP - Brazil
ABSTRACT
The food type soybean (exotic) are, in general, non-adapted to the Brazilian growing conditions. A breeding strategy to develop adapted food type soybean should involve crossing exotic with the available grain type genotypes. We evaluated the performance of topcrosses among food type and grain type soybeans. Best progenies showed different performance rates in each environment and they were not always the same in the different environments and joint analysis of lodging (L), plant height at maturity (PHM) and agronomic value (AV) was essential to avoid selection of plants with good performance for one trait and bad for another.) Piracicaba autumn environment (PA) caused low individual plant yield performance (IPY), and consequently, cultivation was not economically viable in this period. Best progenies presented appropriate trait averages for inclusion in the category of vegetable soybean in all evaluated environments.
Key Words: Soybean, food type soybean, edamame, topcross, vegetal breeding
∗ Author for correspondence
INTRODUCTION
Soybean [Glycine max (L.) Merrill] is classified in two groups according to its main use: a) grain type soybean that is employed mainly for meal and oil production, it has an unpleasant flavor and shows average grain size, with one hundred seed weight (HSW) varying between 10 and 19 g and; b) food type soybean that has a pleasant flavor and is formed by two subgroups, the first with a HSW smaller than 10 g, consumed in the sprouts and natto (fermented) forms and, the second with a HSW of 20 g or more, which is consumed directly by humans principally in the immature pod form (R6 stage on the Fehr and Caviness scale, 1977) as a snack. This latter subgroup is also denominated vegetable soybean, green soybean or edamame and
incorporates the sweet soybean (kuromame) and salad soybean (Vello, 1992), which have their own characteristics.
flavor and high lipoxigenases and anti-nutritional contents.
A new farmer category has recently appeared in Brazil, with interest in the food type soybean with big seeds to explore the growing market for use in direct human feeding and for export to oriental countries and, also, to the United States and Australia.
The exotic genotypes are not adapted to Brazilian growing conditions and show early flowering (Santos, 1988). The association among these two traits produces plants with very low development and, as a response, low grain yield. Another problem with food type soybean genotypes is the low physiological quality of the seeds, which causes a fast decline in germination capacity and seedling vigor. Breeders usually cross exotic with adapted grain type genotypes aiming to add in a single plant the genes for increased direct human consumption quality of the exotic genotypes with those for photoperiod adaptation, high grain yield and high physiological seed quality of adapted genotypes.
The objective of this study was to evaluate the performance of topcrosses among food type and grain type soybean.
MATERIALS AND METHODS
The genetic material involved in this work was 24 F9:4 progenies from 15 topcrosses among large seed exotic lines (food type soybean) that participated as female parental with two adapted male cultivars (Doko and FT-2). The objective was to aggregate in a single plant the food type characteristics from exotic parents with adaptability from the adapted parents. The controls were the IAC PL-1, Tamba, Late Giant and Nimame genotypes.
The experiment was carried out in field areas of the Department of Genetics of ESALQ-USP, in Piracicaba, located at 22°42’33" South latitude and 47°38’00" West longitude at 540 m of altitude. The environments were: Piracicaba-summer (PS), with sowing on November 15, 1996 and Piracicaba-autumn (PA), with sowing on March 07, 1997 and Anhembi-summer (AS), with sowing on November 17, 1996. The experimental design was a randomized complete block with two replications stratified in two groups (sets), with 12 experimental lines and four controls. Ten hills constituted the plot.
The evaluated traits were: number of days to maturity (NDM), character counted from emergence until maturity, stage R8 on the Fehr and Caviness scale; plant height at maturity (PHM), in cm, measured as the distance between the soil and the inflorescence insertion most distant from main stem, analyzed at R8 stage; lodging (L), evaluated at maturity based on the scale of visual scores, varying from score 1 (plant erect) to 5 (plant totally prostrated); pod width by visual score (PWV), applied in the middle of distal locus, based on a scale from 1 (narrow pod) to 5 (wide pod), analyzed at R8 stage; individual plant yield (IPY), in grams, evaluated after pod threshing of individual plants; one hundred seed weight (HSW), in grams, calculated by the weight of 100 seeds per individual plant. agronomic value (AV), evaluated at maturity, corresponding to a global index including yield, general plant vigor, plant sanity, leaf retention, green stem presence/absent, using visual scores varying from 1 (bad plant) up to 5 (good plant);
For the individual environment the adopted model was (Vencovsky, 1992 and Cruz and Regazzi, 1994):
Yijk = µ + Gi + Rj + (C/R)jk + eijk
where:
Gi: effect of ith treatment; Rk: effect of kth replication;
(C/R)jk : effect jth group (set) within of the kth replication;
eijk : random error.
The following model was used for the joint analysis (Vencovsky, 1992):
Yceik = µ + Gi + Ee +Rk+ (C/R)Ecek + GEie + eceik
where:
Gi: effect of ith treatment; Ej : effect of eth environment; Rk: effect of kth replication;
(C/R)E
cek: effect of
c
thgroup (set)
within the
k
threplication in the
e
thenvironment;
GE
ei: first order interaction among
treatments and environments;
e
ceik: random error.
average of all progenies was obtained from the following expression:
Where,
Dmi: is the average performance from ith progeny;
: is the progeny average for the trait under evaluation;
:is the average of the controls or general average of the progenies).
RESULTS AND DISCUSSION
The individual analysis of variance showing the progeny results are presented in Table 1. Among progeny differences were significant in all the evaluated environments, indicating the genetic differences existence among treatments. In the joint analysis of variance of the three environments (Table 2), the progenies showed significant differences for all the evaluated traits at the 1% level of probability by the F test, indicating the presence of genetic differences among the progenies; certainly, this is a consequence of the genetic diversity among the exotic type food parents that participated in the topcrosses.
Table 1 - Mean squares and significance for seven traits1 in the analysis of variance of treatments and their progenies (Pro). Piracicaba-summer (PS), sowing on 15/Nov/96; Piracicaba-autumn (PA), sowing on 07/March/97; Anhembi-summer (AS), sowing on 17/Nov/96.
S.V. D.F. Lt AVt NDM PHM PWVt HSW IPY
Treatment s
PS 27 0.0588** 0.00698** 209.48** 287.7** 0.02659** 31.93** 1973,1** PA 0.1448** 0.01658** 52.29* 306.3** 0.01572** 7.61** 421,6** AS 0.0586* 0.02026** 187.84** 376.5** 0.01701** 27.26** 1047,9** Pro PS 23 0.6390** 0.00698** 223.24** 289.4** 0.02670** 26.23** 1758,2**
PA 0.1362** 0.01377** 50.93* 302.2** 0.01501** 6.146* 336,17** AS 0.0647* 0.02076** 205.42** 431.3** 0.01747** 28.365** 1153,8** Residue2 PS 33 0.0178 0.00232 5.80 43.5 0.00332 1.01 261,7
PA 0.0276 0.00413 24.42 40.4 0.00351 2.63 78,9 AS 0.0269 0.00482 15.01 17.8 0.00271 2.15 166,3 Total 63
C.V.% PS 6,5 3.00 1.95 11.5 3.26 4.68 16.6 PA 9,6 4.84 4.51 16.6 3.26 8.03 43.0 AS 10,8 4.38 3.05 8.4 2.99 6.62 17.5
Mean PS 2,04 1.60 124 57.4 1.77 21.4 97.7
PA 1,73 1.33 110 38.3 1.82 20.2 20.6
AS 1,51 1.59 127 50.1 1.74 22.1 73.5
1. Traits: NDM: number of days to maturity; PHM: plant height at maturity, in cm; L: lodging, score 1 to 5; PWV: pod width by visual score, score 1 to 5; IPY: individual plant yield, in grams; HSW: one hundred seed weight, in grams; AV: agronomic value, score 1 to 5.
2. Residue: (Treat x Replication) + (Control x Set/Replication); t. Data transformed in .
* and ** : indicate significant at the 5% and 1% levels of probability, respectively.
i
x
Dmi xi xp
xp
=
(
−)
.100x p
5 , 0 +
Table 2 - Mean squares and significance of treatments, their components and among groups for the seven studied traits1 in the joint analysis of variance (three environments). Piracicaba-summer (PS), sowing on 15/Nov/96; Anhembi-summer (AS), sowing on 17/Nov/96 and Piracicaba-autumn (PA), sowing on 07/March/97.
Source of variation
d.f Lt AVt NDM PHM PWVt HSW IPY
Environment (E) 2 4.2536** 1.38626** 4968.4** 5407.0** 0.09166** 57.34** 90712.7** Treatments 27 0.1599** 0.01975** 251.5** 817.6** 0.04642** 44.15** 2109.5** Progeny (P) 23 0.1766** 0.01747** 257.3** 894.3** 0.04606** 42.36** 2215.6** Checks (T) 3 0.0751* 0.03637** 180.4** 145.1** 0.00983* 66.85** 844.8** P vs T 1 0.0054 0.01521* 154.3** 976.0** 0.14418** 17.20** 2385.5**
Rep/E 3 0.0676** 0.01554 9.2 74.0 0.00996* 2.34 414.8
Conj/Rep/E 6 0.0425 0.00167 30.4 71.0 0.00390 1.85 76.1
P x E 46 0.0461** 0.01204** 111.7** 65.3** 0.00747** 9.34** 527.7** T x E 6 0.0333 0.01304** 20.9 165.4** 0.00411 25.99** 1859.6** Groups x E 2 0.2630** 0.00868 47.6* 68.9 0.00071 15.44** 424.0
Residue 99 0.0241 0.00376 15.1 443.5 0.00318 1.93 168.9
Total 191
C.V.% 8.92 4.11 3.24 12.2 3.24 6.47 20.3
Mean 1.76 1.51 120 48.6 1.78 21.3 64.0
1. Traits: NDM: number of days to maturity; PHM: plant height at maturity, in cm; L: lodging, score 1 to 5; PWV: pod width visual score, score 1 to 5; IPY: individual plant yield, in grams; HSW: one hundred seed weight, in grams;
AV: agronomic value, score 1 to 5. 2. Residue: (Treat x Rep) + (Control x Set/Rep); t. Data transformed in .
* and ** : indicate significance at the 5% and 1% level of probability, respectively.
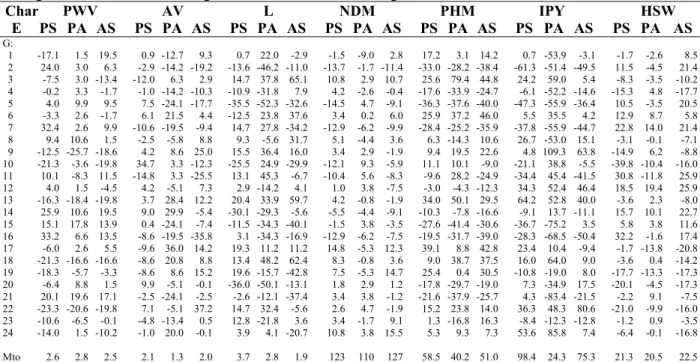
Table 3 - Relative performance of each progeny (G) in percentage of their general average (MTo) for seven traits1, in each environment (E): Piracicaba-summer (PS), Piracicaba-autumn (PA) and Anhembi-summer (AS). Soy: PV, sowing on 15/Nov/96; AV, sowing on 17/Nov/96 and PU, sowing on 07/March/97.
Char PWV AV L NDM PHM IPY HSW
E PS PA AS PS PA AS PS PA AS PS PA AS PS PA AS PS PA AS PS PA AS
G:
1 -17.1 1.5 19.5 0.9 -12.7 9.3 0.7 22.0 -2.9 -1.5 -9.0 2.8 17.2 3.1 14.2 0.7 -53.9 -3.1 -1.7 -2.6 8.5 2 24.0 3.0 6.3 -2.9 -14.2 -19.2 -13.6 -46.2 -11.0 -13.7 -1.7 -11.4 -33.0 -28.2 -38.4 -61.3 -51.4 -49.5 11.5 -4.5 21.4 3 -7.5 3.0 -13.4 -12.0 6.3 2.9 14.7 37.8 65.1 10.8 2.9 10.7 25.6 79.4 44.8 24.2 59.0 5.4 -8.3 -3.5 -10.2 4 -0.2 3.3 -1.7 -1.0 -14.2 -10.3 -10.9 -31.8 7.9 4.2 -2.6 -0.4 -17.6 -33.9 -24.7 -6.1 -52.2 -14.6 -15.3 4.8 -17.7 5 4.0 9.9 9.5 7.5 -24.1 -17.7 -35.5 -52.3 -32.6 -14.5 4.7 -9.1 -36.3 -37.6 -40.0 -47.3 -55.9 -36.4 10.5 -3.5 20.5 6 -3.3 2.6 -1.7 6.1 21.5 4.4 -12.5 23.8 37.6 3.4 0.2 6.0 25.9 37.2 46.0 5.5 35.5 4.2 12.9 8.7 5.8 7 32.4 2.6 9.9 -10.6 -19.5 -9.4 14.7 27.8 -34.2 -12.9 -6.2 -9.9 -28.4 -25.2 -35.9 -37.8 -55.9 -44.7 22.8 14.0 21.4 8 9.4 10.6 1.5 -2.5 -5.8 8.8 9.3 -5.6 31.7 5.1 -4.4 3.6 6.3 -14.3 10.6 26.7 -53.0 15.1 -3.1 -0.1 -7.1 9 -12.5 -25.7 -18.6 4.2 8.6 25.0 15.5 36.4 16.0 3.4 2.9 -1.9 9.4 19.5 22.6 4.8 109.3 63.8 -14.9 6.2 -8.8 10 -21.3 -3.6 -19.8 34.7 3.3 -12.3 -25.5 24.9 -29.9 -12.1 9.3 -5.9 11.1 10.1 -9.0 -21.1 38.8 -5.5 -39.8 -10.4 -16.0 11 10.1 -8.3 11.5 -14.8 3.3 -25.5 13.1 45.3 -6.7 -10.4 5.6 -8.3 -9.6 28.2 -24.9 -34.4 45.4 -41.5 30.8 -11.8 25.9 12 4.0 1.5 -4.5 4.2 -5.1 7.3 2.9 -14.2 4.1 1.0 3.8 -7.5 -3.0 -4.3 -12.3 34.3 52.4 46.4 18.5 19.4 25.9 13 -16.3 -18.4 -19.8 3.7 28.4 12.2 20.4 33.9 59.7 4.2 -0.8 -1.9 34.0 50.1 29.5 64.2 52.8 40.0 -3.6 2.3 -8.0 14 25.9 10.6 19.5 9.0 29.9 -5.4 -30.1 -29.3 -5.6 -5.5 -4.4 -9.1 -10.3 -7.8 -16.6 -9.1 13.7 -11.1 15.7 10.1 22.7 15 15.1 17.8 13.9 0.4 -24.1 -7.4 -11.5 -34.3 -40.1 -1.5 3.8 -3.5 -27.6 -41.4 -30.6 -36.7 -75.2 3.5 5.8 3.8 11.6 16 33.2 6.6 13.5 -8.6 -19.5 -35.8 3.1 -34.3 -16.9 -12.9 -6.2 -7.5 -19.5 -31.7 -39.0 -28.3 -68.5 -50.4 32.2 -1.6 17.4 17 -6.0 2.6 5.5 -9.6 36.0 14.2 19.3 11.2 11.2 14.8 -5.3 12.3 39.1 8.8 42.8 23.4 10.4 -9.4 -1.7 -13.8 -20.8 18 -21.3 -16.6 -16.6 -8.6 20.8 8.8 13.4 48.2 62.4 8.3 -0.8 3.6 9.0 38.7 37.5 16.0 64.0 9.0 -3.6 0.4 -14.2 19 -18.3 -5.7 -3.3 -8.6 8.6 15.2 19.6 -15.7 -42.8 7.5 -5.3 14.7 25.4 0.4 30.5 -10.8 -19.0 8.0 -17.7 -13.3 -17.3 20 -6.4 8.8 1.5 9.9 -5.1 -0.1 -36.0 -50.1 -13.1 1.8 2.9 1.2 -17.8 -29.7 -19.0 7.3 -34.9 17.5 -20.1 -4.5 -17.3 21 20.1 19.6 17.1 -2.5 -24.1 -2.5 -2.6 -12.1 -37.4 3.4 3.8 -1.2 -21.6 -37.9 -25.7 4.3 -83.4 -21.5 -2.2 9.1 -7.5 22 -23.3 -20.6 -19.8 7.1 -5.1 37.2 14.7 32.4 -5.6 2.6 4.7 -1.9 15.2 23.8 14.0 36.3 48.3 80.6 -21.0 -9.9 -16.0 23 -10.6 -6.5 -0.1 -4.8 -13.4 0.5 12.8 -21.8 3.6 3.4 -1.7 9.1 1.3 -16.8 16.3 -8.4 -12.3 -12.8 -1.2 0.9 -3.5 24 -14.0 1.5 -10.2 -1.0 20.0 -0.1 3.9 4.1 -20.7 10.8 3.8 15.5 5.3 9.3 7.3 53.6 85.8 7.4 -6.4 -0.1 -16.8
Mto 2.6 2.8 2.5 2.1 1.3 2.0 3.7 2.8 1.9 123 110 127 58.5 40.2 51.0 98.4 24.3 75.3 21.3 20.5 22.5 1. Traits: NDM: number of days to maturity; PHM: plant height at maturity, in cm; L: lodging, score from 1 to 5; PWV: pod width visual score, score from 1 to 5; IPY: individual plant yield, in grams; HSW: one hundred seed weight, in grams; AV: agronomic value, score from 1 to 5.
5 , 0 +
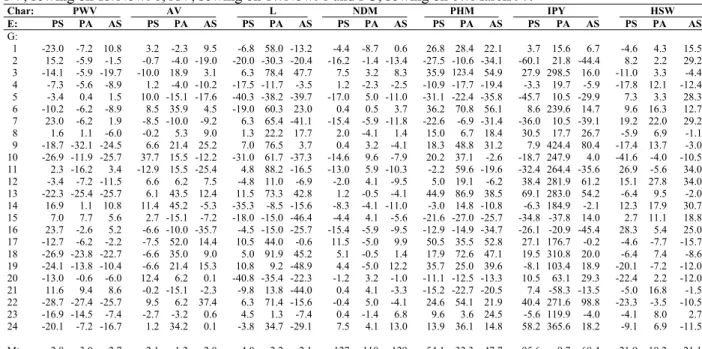
The comparison of the average performance of each progeny in relation to the average of all progenies or to the average of all controls, allowed the determination of a superior or inferior percentage limit for each evaluated material in relation to the references.
Table 3 shows in percentage, the average performances of some individual progenies in relation to their general average (Mto) without the controls. In the Piracicaba-summer (PS) environment, the best pod width visual score (PWV) performances were obtained by progenies number 2, 7, 14, 16 and 21 with scores at least 20% higher than their average. In the Piracicaba-autumn (PA) environment, the individual performance of progenies 8, 14, 15 and 21 were at least 10% higher. In the environment Anhembi-summer (AS), the best performances were observed for the progenies 1, 14, 15, 16 and 21, with increases higher than 13%. Most progenies showed similar performances in the three environments, the exceptions were probably those highly sensitive to environmental variations.
Table 4 presents a comparison among the performances of the progenies and the controls, which are commercial food type cultivars. Eight progenies were superior to the controls, specially progenies 2, 7, 14, 16 and 21, with PWV values 11 to 23% higher. The autumn (PA) conditions caused a loss in the progeny competitiveness and, therefore, only five progenies (5, 8, 14, 15 and 21) were superior, presenting scores less than 10% higher. In the AS environment, the progeny performance was similar to that observed in PA, and only progenies 1 and 14 presented superior averages. The variation range of the F9:4 performance was similar to that obtained by Yokomizo (1994) for the F5:4 generation, with values between -30 and 30%. Progenies 14 and 16 also stood out in the F5:4 while all the others were also superior in F5:4, except progeny 2 (Yokomizo, 1994).
The agronomic value trait (AV) presented progenies with performances ranging from -10 to 10% of the controls, except for progeny 10 that showed a superior performance in relation to the general average of the PS environment (Table 3). A wider variation range among the progenies was observed in the PA conditions. Progenies 6, 13, 14, 17, 18 and 24 were at least 20% superior to the general average. In Anhembi-summer (AS), two progenies (9 and 22) showed superior AV performance (at least 20%) compared to the other
progenies. When the three environments were compared, inversions in the progeny behavior were observed; for example; those of progenies 10, 18 and 19 varied according to the tested environment (Table 3). Only six progenies (25% of a total of 24) showed AV performance approximately 10% superior in relation to the controls average (Table 4), with progeny 9 being outstanding. An interesting fact was observed in the autumn conditions (PA), with 15 progenies (62.5% of 24) outperforming the controls average. In special, progenies 6, 9, 13, 14, 17, 18 and 24 outperformed the controls AV scores by at least 20%. This was explained by the good adaptation of these progenies and, also, by the fact that the controls had their averages drastically reduced in the fall as confirmed by the AV scores of 1.18 and >2.00 in the fall and summer, respectively. In the PS environment (Table 4), six progenies (1, 9, 13, 17, 19 and 22) presented superior performance (10%) compared with the controls average. Progenies 6, 9, 13, 14 and 17 were superior in at least two environments, but none was superior in all the three environments. Progeny variation range was inside the limits obtained in the F5:4 generation (Yokomizo, 1994). An interesting fact was that only progeny 24, with positive performance values in the three environments, did not present superior performance for AV in F5:4 (Yokomizo, 1994).
performances in the PS environment were obtained by progenies number 2, 5, 10, 14 and 20, with averages near or better than -20% in comparison to the all controls average, which presented a very high average (L 4,0). There was a general decrease of L in PU and, with that, the controls average also decreased. The best values (smallest L score) were obtained for progenies 2, 5 and 20, repeating the performances in the PV environment. The AS environment had a larger number of progenies with better performance (smaller L score) than the controls average, with the ten best progenies presenting estimates between -20% and -50%. The performance range remained close to that observed for the F5:4 generation (Yokomizo, 1994). Progenies number 7, 10, 16, 19 and 20 presented larger L in F5:4 (Yokomizo, 1994) and, therefore, low performance.
Earlier plants in terms of number of days to maturity trait (NDM) are desirable up to a certain limit and, in relation to the general average, negative values are important. In the PS environment (Table 3), progenies 2, 5, 7, 10, 11 and 16 progenies were the best with values inferior to -10%. The autumn conditions in Piracicaba (PA) caused a larger uniformity in NDM and only progeny 1 stood out. Similarly, in the AS environment, only progenies 2, 7 and 14 stood out. Best conditions for the maximum discrimination among the progenies for NDM were obtained in the environment with high fertility and favorable photoperiod (PS). In relation to the controls average (Table 4), in the PS environment, higher earliness was observed in progenies 2, 5, 7, 10 and 16, with estimates near to -15%. In the fall, the progenies presented closer averages and, in the PA environment the best performances were near to -5%, especially progeny 1. In the AS environment, six progenies (25% of 24) presented values near to -10% in relation to the controls average. This indicated that progenies 7 and 16 were earlier than the average controls in all environments. The NDM averages obtained in this work were smaller than those observed by Yokomizo (1994) in the F5:4 generation. Progeny 14 was favorable in the F9:4 and in the F5:4 (Yokomizo, 1994) generation. The plant height at maturity (PHM) trait presents peculiarities because, although superior performances are wanted, there is a limit after which larger PHM can cause undesirable high plant lodging. Averages of up to 25% increase in PHM could be considered as acceptable and,
above this limit, there could be great chances of lodging in favorable conditions. For example, progenies 13 and 17 had superior (30%) PHM performances associated with values near to 20% or more for L in relation to the general average (Table 3). In the PS environment, progenies 3, 6, 19 could be selected with PHM increases near 25% over the general average. But in the autumn environment (PA), the progenies with PHM averages of 24 to 79% above the progeny mean presented higher lodging chance. Using the PHM and L traits associated, it could be considered that in the PA environment the best progenies showed PHM values very near to the average. The same occurred for the AS environment, where the best progenies for PHM presented problems related to high L averages. Progeny 19 was an exception showing adequate PHM and L performances, that is, more height without tendency to lodging. As a general tendency, the best progenies presented PHM values ≥10% higher than the general average (Table 3).
For the individual plant yield trait (IPY), Table 3 showed that in the favorable PS environment the best progenies presented yield averages at least 23% superior to the general average, with distinction for progeny 13. In the autumn conditions (PA), there were significant changes in the progeny behavior, with scores well above or below the general average and seven progenies showing IPY averages at least 48% superior. Progeny 9 was outstanding presenting yield
≥100% than the general average in the PA environment while progenies 9, 12, 13 and 22 stood out in the AS environment. Analyzing the progeny IPY performances in the three environments, it was observed that progenies 3 and 9 were superior in two of the three tested environments, while progenies 12, 13 and 22 were superior in all the three environments. In spite of the fact that some progenies were only average in comparison with the others, those with IPY near to the general average in both the environments PS (98.42g) and AS (75.27g), could be considered promising. In the progenies analysis in relation to the controls average (Table 4), 13 progenies (54% of 24) were obtained with superior IPY performance. Progenies 7, 12, 13, 21 and 24 with yield increase of 30% or more were outstanding. In the autumn (PA) there were 21 progenies (87.5% of 24) with IPY higher than the average of the controls. The adverse conditions in autumn (PA) reduced the progeny and control IPY and, therefore, a higher limit (about 500%) for the progeny performances in relation to the controls was adopted as economically viable. Progeny 9 showed this limit. In the AS environment, 16 progenies (67% of 24) showed IPY superior to the average of the controls, with distinction for progenies 9, 12, 13 and 22 with 50% or more. The comparison of the progeny IPY with the average IPY of the controls (Table 4) indicated that the results of this work were similar to those obtained in the F5:4 generation by Yokomizo (1994), except for the performances obtained in the autumn (PA). Among the best progenies, only progeny 24 did not reached high IPY in the F5:4 (Yokomizo, 1994).
Considering seed size, evaluated as the one hundred seed weight (HSW), progenies 7, 11 and 16 showed outstanding performance in the PS
Table 4 - Relative performance of each progeny in percentage of general average of the controls (MTe) for seven traits1, in each environment: Piracicaba-summer (PS), Piracicaba-autumn (PA) and Anhembi-summer (AS). Soy: PV, sowing on 15/Nov/96; AV, sowing on 17/Nov/96 and PU, sowing on 07/March/97.
Char: PWV AV L NDM PHM IPY HSW
E: PS PA AS PS PA AS PS PA AS PS PA AS PS PA AS PS PA AS PS PA AS
G:
1 -23.0 -7.2 10.8 3.2 -2.3 9.5 -6.8 58.0 -13.2 -4.4 -8.7 0.6 26.8 28.4 22.1 3.7 15.6 6.7 -4.6 4.3 15.5 2 15.2 -5.9 -1.5 -0.7 -4.0 -19.0 -20.0 -30.3 -20.4 -16.2 -1.4 -13.4 -27.5 -10.6 -34.1 -60.1 21.8 -44.4 8.2 2.2 29.2 3 -14.1 -5.9 -19.7 -10.0 18.9 3.1 6.3 78.4 47.7 7.5 3.2 8.3 35.9 123.4 54.9 27.9 298.5 16.0 -11.0 3.3 -4.4 4 -7.3 -5.6 -8.9 1.2 -4.0 -10.2 -17.5 -11.7 -3.5 1.2 -2.3 -2.5 -10.9 -17.7 -19.4 -3.3 19.7 -5.9 -17.8 12.1 -12.4 5 -3.4 0.4 1.5 10.0 -15.1 -17.6 -40.3 -38.2 -39.7 -17.0 5.0 -11.0 -31.1 -22.4 -35.8 -45.7 10.5 -29.9 7.3 3.3 28.3 6 -10.2 -6.2 -8.9 8.5 35.9 4.5 -19.0 60.3 23.0 0.4 0.5 3.7 36.2 70.8 56.1 8.6 239.6 14.7 9.6 16.3 12.7 7 23.0 -6.2 1.9 -8.5 -10.0 -9.2 6.3 65.4 -41.1 -15.4 -5.9 -11.8 -22.6 -6.9 -31.4 -36.0 10.5 -39.1 19.2 22.0 29.2 8 1.6 1.1 -6.0 -0.2 5.3 9.0 1.3 22.2 17.7 2.0 -4.1 1.4 15.0 6.7 18.4 30.5 17.7 26.7 -5.9 6.9 -1.1 9 -18.7 -32.1 -24.5 6.6 21.4 25.2 7.0 76.5 3.7 0.4 3.2 -4.1 18.3 48.8 31.2 7.9 424.4 80.4 -17.4 13.7 -3.0 10 -26.9 -11.9 -25.7 37.7 15.5 -12.2 -31.0 61.7 -37.3 -14.6 9.6 -7.9 20.2 37.1 -2.6 -18.7 247.9 4.0 -41.6 -4.0 -10.5 11 2.3 -16.2 3.4 -12.9 15.5 -25.4 4.8 88.2 -16.5 -13.0 5.9 -10.3 -2.2 59.6 -19.6 -32.4 264.4 -35.6 26.9 -5.6 34.0 12 -3.4 -7.2 -11.5 6.6 6.2 7.5 -4.8 11.0 -6.9 -2.0 4.1 -9.5 5.0 19.1 -6.2 38.4 281.9 61.2 15.1 27.8 34.0 13 -22.3 -25.4 -25.7 6.1 43.5 12.4 11.5 73.3 42.8 1.2 -0.5 -4.1 44.9 86.9 38.5 69.1 283.0 54.2 -6.4 9.5 -2.0 14 16.9 1.1 10.8 11.4 45.2 -5.3 -35.3 -8.5 -15.6 -8.3 -4.1 -11.0 -3.0 14.8 -10.8 -6.3 184.9 -2.1 12.3 17.9 30.7 15 7.0 7.7 5.6 2.7 -15.1 -7.2 -18.0 -15.0 -46.4 -4.4 4.1 -5.6 -21.6 -27.0 -25.7 -34.8 -37.8 14.0 2.7 11.1 18.8 16 23.7 -2.6 5.2 -6.6 -10.0 -35.7 -4.5 -15.0 -25.7 -15.4 -5.9 -9.5 -12.9 -14.9 -34.7 -26.1 -20.9 -45.4 28.3 5.4 25.0 17 -12.7 -6.2 -2.2 -7.5 52.0 14.4 10.5 44.0 -0.6 11.5 -5.0 9.9 50.5 35.5 52.8 27.1 176.7 -0.2 -4.6 -7.7 -15.7 18 -26.9 -23.8 -22.7 -6.6 35.0 9.0 5.0 91.9 45.2 5.1 -0.5 1.4 17.9 72.6 47.1 19.5 310.8 20.0 -6.4 7.4 -8.6 19 -24.1 -13.8 -10.4 -6.6 21.4 15.3 10.8 9.2 -48.9 4.4 -5.0 12.2 35.7 25.0 39.6 -8.1 103.4 18.9 -20.1 -7.2 -12.0 20 -13.0 -0.6 -6.0 12.4 6.2 0.1 -40.8 -35.4 -22.3 -1.2 3.2 -1.0 -11.1 -12.5 -13.3 10.5 63.1 29.3 -22.4 2.2 -12.0 21 11.6 9.4 8.6 -0.2 -15.1 -2.3 -9.8 13.8 -44.0 0.4 4.1 -3.3 -15.2 -22.7 -20.5 7.4 -58.3 -13.5 -5.0 16.8 -1.5 22 -28.7 -27.4 -25.7 9.5 6.2 37.4 6.3 71.4 -15.6 -0.4 5.0 -4.1 24.6 54.1 21.9 40.4 271.6 98.8 -23.3 -3.5 -10.5 23 -16.9 -14.5 -7.4 -2.7 -3.2 0.6 4.5 1.3 -7.4 0.4 -1.4 6.8 9.6 3.6 24.5 -5.6 119.9 -4.0 -4.1 8.0 2.7 24 -20.1 -7.2 -16.7 1.2 34.2 0.1 -3.8 34.7 -29.1 7.5 4.1 13.0 13.9 36.1 14.8 58.2 365.6 18.2 -9.1 6.9 -11.5
Mte 2,8 3,0 2,7 2,1 1,2 2,0 4,0 2,2 2,1 127 110 129 54,1 32,3 47,7 95,6 9,7 68,4 21,9 19,2 21,1 1. Traits: NDM: number of days to maturity; PHM: plant height at maturity, in cm; L: lodging, score from 1 to 5; PWV: pod width visual score, score from 1 to 5; IPY: individual plant yield, in grams; HSW: one hundred seed weight, in grams; AV: agronomic value, score from 1 to 5.
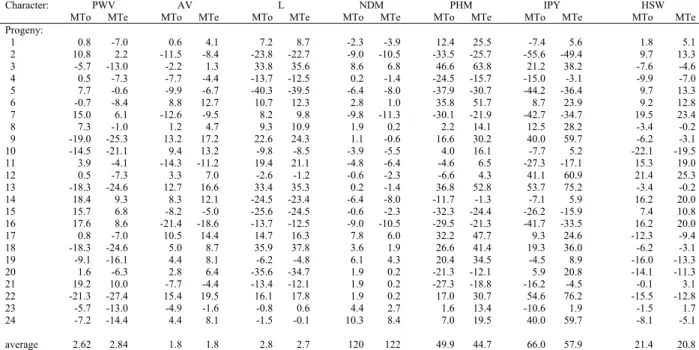
In the joint analysis of the three environments (Table 5) for the pod width visual score trait (PWV), the analysis of the progeny performances in relation to the general topcross averages presented as most promising the same progenies outstanding in the PV environment (Tables 3 and 4). Progenies 2, 7, 14, 15, 16 and 21 stood out with scores at least 10% higher than the general average. Table 5 showed that some progenies PWV scores coincided with those of the two references (general topcross average (Mto) and general control average (Mte)). Progenies 7, 14, 15, 16 and 21 presented PWV scores at least 6% higher than the references. The range F9:4 progeny performances decreased in relation to that of the F5:4 generation (Yokomizo, 1994), but the superior progenies coincided in both generations.
Seven progenies (6, 9, 10, 13, 14, 17 and 22) showed higher AS trait than the Mto and Mte, in the favorable PS environment (Table 5). Their performances were at least 8% superior to that of the references. Progenies 18 and 19 stood out when compared to the Mte. Except for progeny 10, the others six F9:4 progenies were also superior in the F5:4 generation (Yokomizo, 1994).
The joint analysis of lodging in the three environments (Table 5) indicated that the
progenies presented similar performances to the Mto and Mte references. Progenies 2, 5, 14, 15 and 20 were outstanding with lodging scores 23% smaller than the references. Among the five best F9:4 progenies only two did not present appropriate performance in the F5:4 (Yokomizo, 1994).
The trait number of days to maturity (NDM, Table 5) presented small variation among the averages of the progenies and, the earliest were progenies 2, 7, 14 and 16, with values within -6% and -11% of the NDM progeny average. The earliest progenies in the joint analysis of the three environments were the same observed individually in each environment (Tables 3 and 4). However, only progenies 2 and 14 were earlier in F9:4 than in the F5:4 generation (Yokomizo, 1994).
The joint analysis of individual plant yield (IPY, Table 5) in the three environments showed that the best performances were presented by the progenies 3, 9, 12, 13, 18, 22 and 24, with increases ranging from 19% to 76% over the Mto and Mte. Among the seven F9:4 distinctions, only progeny 24 was inferior in the F5:4 (Yokomizo, 1994). Taking a individual plant productivity of 50 g/hill as an acceptable minimum, all progenies with positive IPY performance estimates in relation to the references could be considered appropriate.
The seed size trait was evaluated by the weight of one hundred seeds (HSW, Table 5) and 20g was taken as the acceptable minimum. Therefore, all
progenies with positive performance could be considered appropriate. Progenies 1, 2, 5, 6, 7, 8, 9, 11, 12, 14, 15 and 16 were superior in a comparison with the Mto performance, while progenies 21 and 23 were also included in the list when the comparison involved Mte. As a consequence of the among plant within progeny selection practiced along the generations, progenies 2, 3, 4 and 6 that did not possess average above 20g in F5:4 generation (Yokomizo, 1994) showed greater scores the F9:4, reaching potential for selection .
Table 5 - Relative performance of each progeny in percentage of their general average (MTo) or of the average of the controls (Mte) for seven traits1, in the three combined environment. Piracicaba-summer (PS), sowing on 15/Nov/96; Anhembi-summer (AS), sowing on 17/Nov/96 and Piracicaba-autumn (PA), sowing on 07/March/97.
Character: PWV AV L NDM PHM IPY HSW
MTo MTe MTo MTe MTo MTe MTo MTe MTo MTe MTo MTe MTo MTe
Progeny:
1 0.8 -7.0 0.6 4.1 7.2 8.7 -2.3 -3.9 12.4 25.5 -7.4 5.6 1.8 5.1 2 10.8 2.2 -11.5 -8.4 -23.8 -22.7 -9.0 -10.5 -33.5 -25.7 -55.6 -49.4 9.7 13.3 3 -5.7 -13.0 -2.2 1.3 33.8 35.6 8.6 6.8 46.6 63.8 21.2 38.2 -7.6 -4.6 4 0.5 -7.3 -7.7 -4.4 -13.7 -12.5 0.2 -1.4 -24.5 -15.7 -15.0 -3.1 -9.9 -7.0 5 7.7 -0.6 -9.9 -6.7 -40.3 -39.5 -6.4 -8.0 -37.9 -30.7 -44.2 -36.4 9.7 13.3 6 -0.7 -8.4 8.8 12.7 10.7 12.3 2.8 1.0 35.8 51.7 8.7 23.9 9.2 12.8 7 15.0 6.1 -12.6 -9.5 8.2 9.8 -9.8 -11.3 -30.1 -21.9 -42.7 -34.7 19.5 23.4 8 7.3 -1.0 1.2 4.7 9.3 10.9 1.9 0.2 2.2 14.1 12.5 28.2 -3.4 -0.2 9 -19.0 -25.3 13.2 17.2 22.6 24.3 1.1 -0.6 16.6 30.2 40.0 59.7 -6.2 -3.1 10 -14.5 -21.1 9.4 13.2 -9.8 -8.5 -3.9 -5.5 4.0 16.1 -7.7 5.2 -22.1 -19.5 11 3.9 -4.1 -14.3 -11.2 19.4 21.1 -4.8 -6.4 -4.6 6.5 -27.3 -17.1 15.3 19.0 12 0.5 -7.3 3.3 7.0 -2.6 -1.2 -0.6 -2.3 -6.6 4.3 41.1 60.9 21.4 25.3 13 -18.3 -24.6 12.7 16.6 33.4 35.3 0.2 -1.4 36.8 52.8 53.7 75.2 -3.4 -0.2 14 18.4 9.3 8.3 12.1 -24.5 -23.4 -6.4 -8.0 -11.7 -1.3 -7.1 5.9 16.2 20.0 15 15.7 6.8 -8.2 -5.0 -25.6 -24.5 -0.6 -2.3 -32.3 -24.4 -26.2 -15.9 7.4 10.8 16 17.6 8.6 -21.4 -18.6 -13.7 -12.5 -9.0 -10.5 -29.5 -21.3 -41.7 -33.5 16.2 20.0 17 0.8 -7.0 10.5 14.4 14.7 16.3 7.8 6.0 32.2 47.7 9.3 24.6 -12.3 -9.4 18 -18.3 -24.6 5.0 8.7 35.9 37.8 3.6 1.9 26.6 41.4 19.3 36.0 -6.2 -3.1 19 -9.1 -16.1 4.4 8.1 -6.2 -4.8 6.1 4.3 20.4 34.5 -4.5 8.9 -16.0 -13.3 20 1.6 -6.3 2.8 6.4 -35.6 -34.7 1.9 0.2 -21.3 -12.1 5.9 20.8 -14.1 -11.3 21 19.2 10.0 -7.7 -4.4 -13.4 -12.1 1.9 0.2 -27.3 -18.8 -16.2 -4.5 -0.1 3.1 22 -21.3 -27.4 15.4 19.5 16.1 17.8 1.9 0.2 17.0 30.7 54.6 76.2 -15.5 -12.8 23 -5.7 -13.0 -4.9 -1.6 -0.8 0.6 4.4 2.7 1.6 13.4 -10.6 1.9 -1.5 1.7 24 -7.2 -14.4 4.4 8.1 -1.5 -0.1 10.3 8.4 7.0 19.5 40.0 59.7 -8.1 -5.1 average 2.62 2.84 1.8 1.8 2.8 2.7 120 122 49.9 44.7 66.0 57.9 21.4 20.8 1. Traits: NDM: number of days to maturity; PHM: plant height at maturity, in cm; L: lodging, score from 1 to 5; PWV: pod width visual score, score from 1 to 5; IPY: individual plant yield, in grams; HSW: one hundred seed weight, in grams; AV: agronomic value, score from 1 to 5.
CONCLUSIONS
- Best progenies showed distinct performance in various environments. These were in one environment not always the same as those of a different environment;
- The joint analysis of L, PHM and AV was essential to avoid selection of plants that presented good performance for one trait and poor for another;
- The PA environment caused low IPY performance and, therefore, cultivation in this period was not economically viable;
RESUMO
A soja tipo alimento (genótipos exóticos), geralmente, não são adaptados às condições de cultivo do Brasil. Uma estratégia de melhoramento visando desenvolver uma soja tipo alimento adaptada pode envolver o cruzamento do genótipo exótico com os adaptados do tipo grão. O objetivo desta pesquisa foi avaliar o desempenho de topocruzamentos de soja tipo alimento com tipo grão. Os resultados obtidos foram: a) as melhores progênies apresentaram taxas diferentes de desempenho em cada ambiente; e b) a análise conjunta para L (acamamento), PHM (altura da planta na maturidade) e AV (valor agronômico) foram essenciais para auxiliar na seleção de plantas com bom desempenho para um caráter e mau em outro; c) o ambiente PA (Piracicaba outono) causou baixo desempenho para IPY (produção de grãos por planta), e consequentemente, o cultivo neste período do ano não é economicamente viável; d) as melhores progênies apresentaram médias apropriadas para inclusão na categoria de soja alimento em todo os ambientes.
REFERENCES
Carrão-Panizzi, M. C. (1989), Breeding soybean for human consumption. In: WORLD SOYBEAN RESEARCH CONFERENCE, 4. Proceedings. Buenos Aires : Associacion Argentina de la Soja. pp. 1101-1105.
Cruz, C. D. and Regazzi, A. J. (1994), Interação genótipos x ambientes. In: _____. Modelos biométricos aplicados ao melhoramento genético.
Viçosa : Imprensa Universitária da UFV. pp. 1-34. Dashiell, K. E.; Ariyo, O. J.; Bello, L. and Ojo, K.
(1994), Genotype x environment interaction and simultaneous selection for high yield and stability in
soybean (Glycine max (L.) Merr.). Annals of Applied Biology, 124 : (1), 133-139.
Fehr, W. R. and Caviness, C. E. (1977), Stages of soybean development. Iowa State University of Science and Technology. (Special Report, 80). 12 pp. Orf, J. H. (1989), Breeding soybeans lacking
antinutritional factors. In: WORLD SOYBEAN RESEARCH CONFERENCE, 4.. Proceedings. Buenos Aires : Associacion Argentina de la Soja. pp. 1091-1100.
Rackis, J. J.; Sessa, D. J. and Honig, D. H. (1979), Flavor problems of vegetable food proteins. Journal of the American Oil Chemists Society, 56 : (3), 262-271.
Sakiyama, N. S.; Sediyama, T.; Sediyama, C. S. and Reis, M. S. (1988), Interação genótipo x ambiente e seus efeitos na escolha de localidades para avaliação de linhagens de soja (Glycine max (L.) Merrill).
Revista Ceres, 35 : (201), 486-493.
Santos, A. L. C. (1988), Variabilidade entre genótipos de soja (Glycine max (L.) Merrill) nas fases imatura e madura de desenvolvimento. Dissertação (Mestrado) - Escola Superior de Agricultura "Luiz de Queiroz", Universidade de São Paulo. Piracicaba. 135 pp. Vello, N. A. (1992), Ampliação da base genética do
germoplasma e melhoramento da soja na ESALQ-USP. In: Câmara, G. M. S.; Marcos Filho, J. and Oliveira, E. A. M. (eds.). Simpósio sobre cultura e produtividade da soja. Piracicaba : FEALQ. pp. 60-81. Vencovsky, R. (1992), Componentes da variação
fenotípica: Análise em vários ambientes. In: Vencovsky, R. and Barriga, P. (eds.). Genética Biométrica no Fitomelhoramento. Ribeirão Preto : Sociedade Brasileira de Genética. pp. 233-333. Yokomizo, G. K. (1994), Desempenho e variabilidade
de topocruzamentos F5:4 tipo alimento x tipo grão em
soja. Dissertação (Mestrado) - Escola Superior de Agricultura "Luiz de Queiroz", Universidade de São Paulo. Piracicaba. 121 pp.