A Work Project, presented as part of the requirements for the Award of a Masters Degree in Management from the NOVA – School of Business and Economics in accordance with the
Double Degree Program (LUISS Guido Carli).
Enterprise Risk Management Adoption:
An Empirical Investigation of its Effects on Firm Performance
Federica Carcani #2258
A Project carried out on Finance and Accounting area, under the supervision of: Professor Leonor Ferreira and Professor Vittorio Vecchione
Abstract
Enterprise Risk Management (ERM) is gaining relevance among financial and non-financial companies but its benefits still are uncertain. This paper aims at investigating the relationship between ERM adoption and firm performance based on a sample of 1130 non-financial companies belonging to the STOXX® index. A content analysis of individual accounts is performed to distinguish adopters, and a regression analysis explores the effect of ERM adoption on firm performance, proxied by Tobin’s Q. The findings suggest that there is a
statistical significant positive effect of ERM adoption on firm performance, meaning that firms are benefiting from the implementation of this process.
1. Introduction
Enterprise Risk Management (ERM) is a new process for managing risks. It entails the adoption of an integrated approach to risks, a focus on all risk categories (financial, operational and strategic risk) and the definition of risk as both upside and downside volatility1. These characteristics oppose ERM to the Traditional Risk Management (TRM), which rather focuses on the separate mitigation of pure risks, in particular financial risks. ERM is gaining momentum among firms: according to a survey conducted by the ERM Initiative in 2014 the percentage of adopting companies increased dramatically from 8.8% in 2009 to 24.6% in 2013 in the U.S. This is mainly because firms are coping with increased complexity in risks (Beasley, Branson, and Hancock 2014), in particular after the 2007 crisis. Since 2005, Standard & Poor’s has included ERM as a different rating category for the credit
rating of insurance companies, and is currently enhancing this requirement to non-financial companies. Furthermore, in 2004 the Committee of Sponsoring Organizations of the Tradeway Commission (COSO) issued the Enterprise Risk Management – Integrated Framework providing guidance to adopter firms on how to apply ERM. These circumstances brought more and more firms to adopt this process, even thanks to its predicted benefits: increased efficiency and awareness of risks, improved decision making and resource allocation, reduced earnings volatility (Gates, Nicolas, and Walker 2012). All these effects combined are supposed to improve firm performance. Nonetheless, there are still some obstacles in the implementation of ERM process. Management and Boards of Directors are uncertain about the value creation opportunities arising from investment in risk management,
1This concept is close to the Chinese thought of risk: weiji (risk) is the combination of wei (danger) and ji (opportunity)
and they are feeling the presence of more pressing needs. However, before adopting ERM they want to ascertain that it adds value (Barton, Shenkir and Walker, 2010).
The increased diffusion of ERM and the reluctance of companies to adopt it before proving its benefits trigger the motivation to investigate the effects of ERM adoption on firm performance. The latter would represent the main research question of this work project. Other purposes are to characterize adopters in terms of some accounting variables and to investigate whether different sectors benefit more from ERM adoption.
This empirical exploratory research focuses on a sample of 1130 companies in the non-financial industry belonging to the STOXX® index and representing five geographical areas (Pacific, Europe, North America, Latin America and Asia). Evidence of ERM adoption has been derived from the presence of keywords in individual accounts of the companies. This research contributes to prior studies by investigating this relationship on a wider sample, checking for sector2
and geographical differences.
The Work Project is structured as follows. Section 2 defines Enterprise Risk Management, lists its benefits and costs and explains the existing regulatory guidances. Section 3 continues with an overview of the existing literature. After drawing on the research questions in Section 4, Section 5 focuses on the methodology, the sample and data collection methods are described and the model of research is specified. Dependent and independent variables are explained conceptually and their proxies are specified. Section 6 focuses on data analysis and results (descriptive and empirical) and finally Section 7 concludes, lists limitations of the study and gives suggestions for further research.
2
2. What is Enterprise Risk Management?
Enterprise Risk Management is “the process by which companies identify, measure, manage
and disclose all key risks to increase value to stakeholders” (Segal, 2011). Besides this broad definition, there is still not a consensus on what constitutes ERM. The extant literature and regulatory bodies3 tend to approach the subject from different point of views, but common characteristics stand out.
Firstly, ERM takes an integrated approach to risks. Traditionally, companies have managed risks individually, in a silo-based fashion, each department focusing on their respective threats. Enterprise Risk Management, on the contrary, proposes to manage all company’s risks as a portfolio. This results in increased efficiency, since the offsetting nature of some risks reduce the cost of mitigation. Moreover, by taking on a comprehensive view, it is aligned with the business strategy, leading to the achievement of strategic goals.
Secondly, it includes all risk categories. There are various definitions of risks in the ERM context. COSO defines them as “events that can have a negative impact, preventing value creation” (COSO, 2004), while events that can have positive impacts are defined as
opportunities. A different definition is given by Standards Australia and New Zealand, for which risk is the “the chance that something happens that will have an impact on objectives”
(Australian/New Zealand Standards, 2004). It also specifies that it can both have positive or negative impact. A similar approach is taken by Sobel and Reding (2004) who define business risk as “uncertainties that can impact the company’s ability to achieve its objectives
3
and can result in interdependent outcomes, both positive and negative” (Sobel and Reding
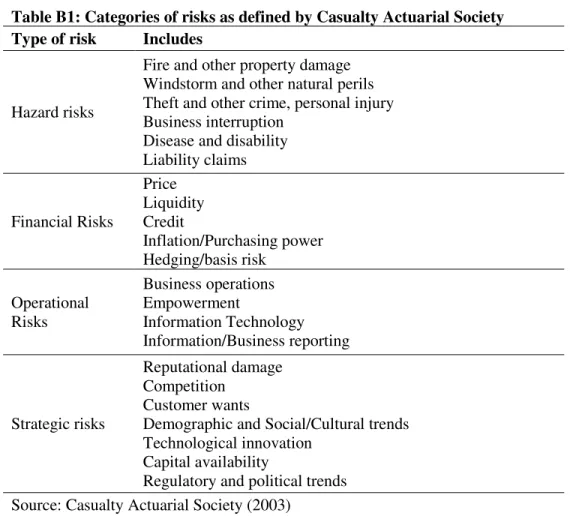
2004). This research applies the broader definition, which includes both positive and negative volatility, since it mostly reflects the ERM definition of risk as “deviation from expected” (Segal, 2011). For what concerns risk categories, the Casualty Actuarial Society provides a comprehensive list of risks that include: hazard risks, financial risks, operational risks and strategic risks (See Table B1 in Appendix B). Traditional risk management focused mainly on financial risks, defined as “unexpected changes in market variables and including market, credit and liquidity risk” (Segal 2011). Operational and strategic risk, defined respectively as “unexpected changes in elements related to operations (human resources, technology and processes)” (Segal, 2011) and to strategy formulation or execution, have been neglected by
the majority of risk management programs mainly because of problems in quantification and because of the apparent superiority of financial risks. ERM, instead, identifies and measures all risks, including strategic and operational ones. Indeed, as a 2006 Conference Board survey states, the majority of directors (53%) believe that strategic risks are more threatening that financial risks, even among the financial sector4.
Thirdly, in the ERM context, risk is defined as both upside and downside volatility. ERM adds completeness to TRM by considering not only downside risk exposure for mitigation but also upside risk exposure for exploitation. In this way, ERM contributes to decision making by linking risk and return, without sacrificing potential value-creating business opportunities. The latter, namely the possibility of balancing risk and return management, is part of what Nocco and Stulz (2006) call the “macro-benefits” of ERM. Indeed, they state
4Brancato et al., 2006. “The Role of U.S. Corporate Boards in Enterprise Risk Management”, The Conference Board
that this program permits senior managers to measure and monitor the risk-return trade-off: the more risk a company (or another entity) is taking the higher return it gets. Through ERM, this trade-off is optimized. They also talk about micro benefits: an enhanced risk culture5 that permeates the entire company and leads to a better decision-making process. For example, managers and all employees in the firm could be able to careful evaluate risk and return of a project in the same way, leading to a consensus about any action plan.
Balancing Benefits and Costs of ERM implementation
Managers and Board of Directors are, indeed, skeptic about adopting ERM because of the uncertain balance between benefits and costs of its implementation. Sim Segal (2011) comprehensively identifies the benefits of ERM, and the parties that are better off by its adoption. Shareholderscan obtain a “higher probability of achieving returns” (Segal, 2011) since through ERM the company can more easily execute its strategic plan and give an impactful response to its major threats. The firm can become more shock resistant, reduce volatility of results and deliver stronger performance. Primary shareholders can also count on better disclosures, and consequently on enhanced information about the risks and opportunities of their investment. Board of Directors can be more confident regarding the understanding of risks inside the company thanks to the rigorous structure of the program, enabling their effective management. The C-Suite can benefit from the increased shock resistance and a more powerful tool to communicate this information to stakeholders. The latter can lead to higher stock prices, since they are able to timely respond to stock analysts’
valuation about their capability of facing risks. Management gains from the structured
5
decision making process embedded in ERM, thanks to which it is easier to choose among projects with different risk-return profiles. In addition, they are able to prioritize the limited resources they have and better allocate them. Lastly, regulators benefit from the lower systemic risk triggered by the adoption of ERM in large scale. Besides those benefits, ERM is primarily a source of competitive advantage for companies: it leads to a better shock resistance, reducing earnings volatility and increasing performance, improving market reputation thus leading to a higher company value.
The major barrier to ERM adoption is that many companies do not regard its benefits as exceeding the costs of implementation. In particular, the adoption of such a program requires some financial efforts, which companies are reluctant to take because of the presence of other priorities or insufficient resources. For example, the implementation of ERM requires setting up a risk committee or other bodies in order to oversee the process. Furthermore, change management is not easy to coordinate. It would be necessary to instruct employees to such a process and implement some training. The whole company would have to change mindset regarding risk management, and this would require some time and costs. This research aims exactly at proving the creation of value to companies deriving from ERM adoption.
3. Literature review
3.1. ERM Guidances
rating evaluation on ERM applies. Below, a brief description of the most relevant ones (COSO, AS/NZ 4360-2009, Standard and Poor’s, Turnbull Guidance) together with a small presentation of the value-based ERM framework ideated by Sim Segal (2011).
1. COSO Enterprise Risk Management – Integrated Framework
In 1992 COSO issued the Internal Control – Integrated Framework, aiming at helping companies improving their internal control system and comply with the Sarbanes-Oxley act, as a reaction to a period of several accounting and business scandals. In 2004 COSO issued the Enterprise Risk Management – Integrated Framework6.
Within this framework, ERM should be supportive of an entity’s objectives: Strategic (“
high-level goals, aligned with and supporting its mission”), Operations (“effective and efficient use of its resources”), Reporting (reliability of reporting), Compliance (“compliance with applicable laws and regulations”). COSO also defines the components of the process: Internal
environment, Objective setting, Event identification, Risk assessment, Risk response, Control activities, Information and communication, Monitoring. Objectives and components work in concert and the entire program is not thought as a “serial process” but it is rather a “multidirectional, iterative process” (COSO, 2004). This type of framework, furthermore,
addresses ERM applicable to all industries and all categories of risks.
2. Joint Australia/New Zealand 4360-2004 Standards, ISO 31000-2009
This Australian and New Zealanders standard sets very general rules about risk management, applicable to all kinds of organizations. The framework is composed as follows:
6Here COSO defines ERM as “a process, effected by an entity’s board of directors, management an
communicate and consult internal and external stakeholders about the process, establish the context in which the process takes place, identify risks, analyse risks, evaluate risks, treat risks, monitor and review.
3. Standard and Poor’s Enterprise Risk Management
As already mentioned, S&P included ERM as a different rating category in the valuation of U.S. insurance companies. This sets some criteria to evaluate the effective application of ERM by insurers. In order to evaluate the risk management of a company, S&P looks at five indicators: Risk-management culture, Risk control, Extreme events management, Risk and capital models, and Strategic risk management (Standard and Poor’s, 2005). Through this evaluation it then categorizes companies on a scale rating the ERM advancement. In 2007, Standard and Poor’s announced the intention to enhance the ERM evaluation to rating
process of non-financial companies.
4. Combined Code and Turnbull Guidance
The Financial Reporting Council in UK firstly issued the Combined Code in 2003, in which it defined the board’s role as to provide an effective framework to assess and manage risks.
In 2005, it also issued a revised version of the guidance on the Combined Code, suggesting to consider a number of elements when assessing a company’s risk and control processes:
Risk assessment, Control environment and control activities, Information and communication, Monitoring.
5. Value-based ERM Framework
identify the potential impact on the company baseline value (present value of all the cash flows to the firm), first on an individual and then on an integrated basis. Thirdly, risk decision making helps making decisions on how to manage risk exposure within risk tolerance and how to implement the strategic planning. Lastly, risk messaging consists in the communication of the process both internally and externally.
For the purpose of this research, there will not be any differentiation in terms of guidances, since they all share the same underlying principles, which is to propose a process to comprehensively identify and manage risks. The increased attention manifested through the issuance of such guidances may signal the recognition of ERM benefits by those regulators, namely the positive effect that ERM adoption may have on firm performance.
3.2. Previous empirical results
implementation and those investigating performance and shareholder value creation deriving from ERM (Gatzert and Martin, 2013). Some studies are twofold on both purposes.
a) Determinants of ERM implementation
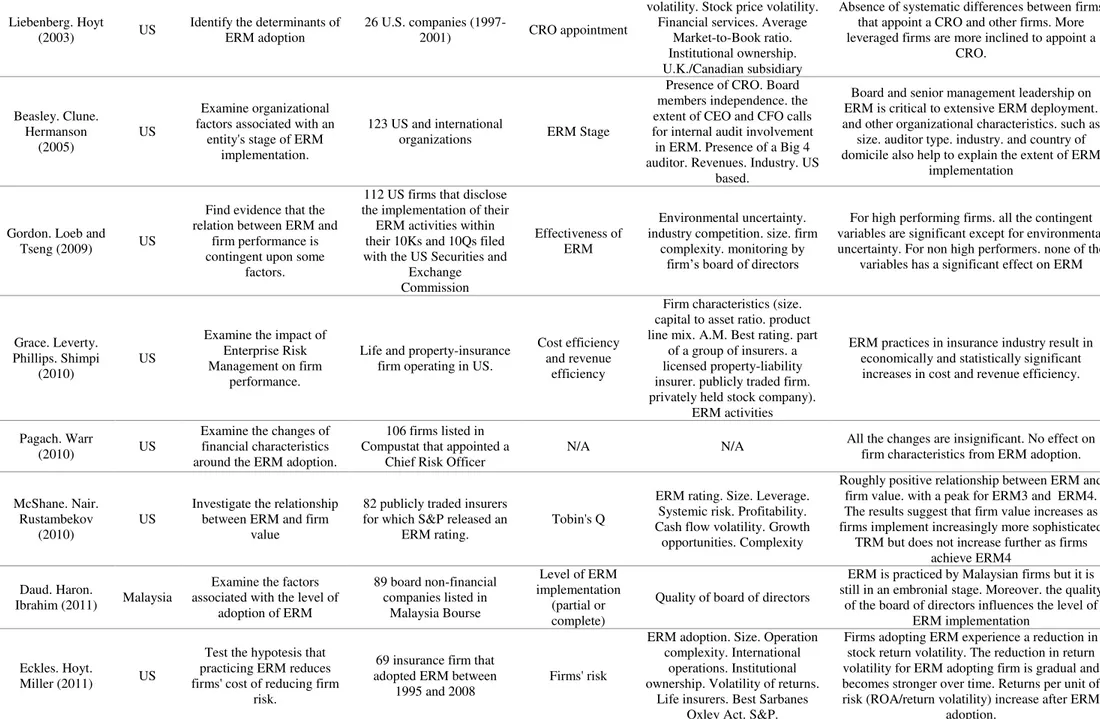
Liebenberg and Hoyt (2003) are among the first to run empirical studies on ERM. Their focus is on the identification of the determinants of ERM adoption. Utilizing the appointment of a Chief Risk Officer as a proxy for the adoption of ERM, they found that more leveraged firms are more prone to appoint a Chief Risk Officer (CRO), but no significant differences regarding other variables were observed. Beasley, Clune and Hermanson (2005), instead, found that board and senior manager leadership has an impact in ERM implementation, but also size, auditor type, industry and country of domicile can explain the extent of ERM deployment. In contrast to the previous studies with US samples, Daud, Haron and Ibrahim (2011) examined the factors associated with the level of ERM implementation on Malaysian firms. Their results show that ERM is adopted in Malaysia, even if at a very early stage, and the factor influencing the level of advancement is the quality of the board of directors. A Malaysian sample was adopted also by Golshan and Rasid (2012) who found evidence only for financial leverage and the presence of a Big Four auditor.
b) Impact of ERM on shareholder value or performance
proxy for firm performance). This approach differs from the majority of research, which uses Tobin’s Q as a proxy for firm performance. Pagach and Warr (2010), whose study examines
the change of financial characteristics around ERM adoption, take a different approach. They measure the change in Earnings volatility, Leverage, Return on equity (ROE), Slack, Opacity, Market-to-book ratio, R&D expense on total asset, Duration ratio, Loan loss provision and Tier 1 Risk adjusted capital ratio before and after the CRO appointment, finding no significant effect. McShane, Nair and Rustambekov (2010) found a roughly positive relationship between ERM rating and Tobin’s Q, but results show that the firm value
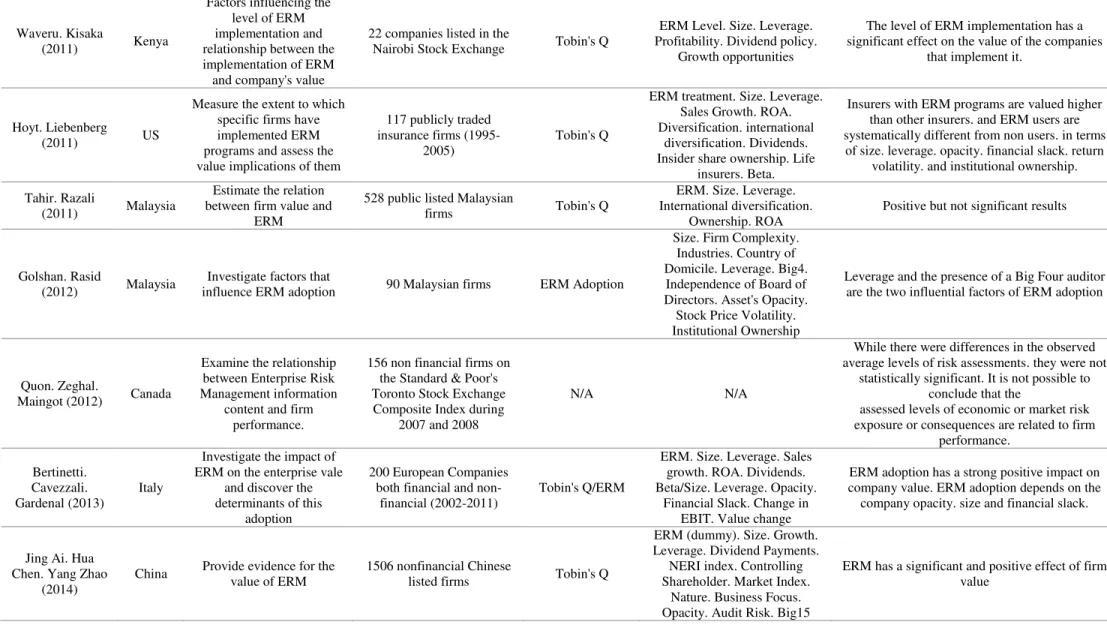
increases with a more sophisticated TRM and not with the adoption of ERM. Tobin’s Q as a proxy for firm value has been adopted also by Waveru and Kisaka (2011) for a Kenyan sample and by Tahir and Razali (2011) for a Malaysian sample. While the former found a significant effect of ERM level on firm value, the latter found still positive but not significant results. Hoyt and Liebenberg (2011) applied the same approach for an US sample, finding that insurers with ERM programs are more valued than other non-adopters. Bertinetti, Cavezzali and Gardenal (2013) conducted a twofold study for financial and non-financial European companies. Firstly, they focused on the relationship between ERM and Tobin’s Q, finding strong positive results, and secondly they studied the factors affecting ERM adoption, finding significant results for company opacity, size and financial slack. More recently, Ai, Chen and Zhao (2014) found evidence for a positive and significant relation between ERM and firm value in Chinese non-financial firms.
and book value of liabilities, divided by the book value of assets, and it is a proxy for firm value. The main contribution of this research is to include a wider sample in terms of geography, counting not only European companies but also North American, Latin American, Asian and Pacific observations, and check for sector differences in the non-financial industry. Furthermore, a most recent period is observed, namely 2005-2014. In order to build the methodology and empirical model, Bertinetti, Cavezzali and Gardenal (2013) are benchmarked because of the similarity in the purpose, which is to investigate the relation between ERM adoption and firm value and performance.
4. Methodology and Data
This is an exploratory study aiming at investigating whether a positive relation exists between ERM adoption and firm performance.
In order to characterize ERM adopters, it is necessary to identify the common elements of companies who implement this model. Therefore, a preliminary research question is:
RQ1: Which are the characteristics of ERM adopters?
The main question to be answered is:
RQ2: Does the adoption of ERM affect firm performance?
Within the ERM context, sector differences exist. This is because they have different level of volatility with respect to the market. Within the non-financial industry, Kleffner et al. (2003) found that energy firms were more likely to adopt ERM with respect to others because of their deregulated and volatile environment, which stimulated the adoption of ERM to protect the firm value. This clearly leads to the third and last question:
In order to answer the first question a descriptive analysis is carried out. Then, an empirical model will be tested in order to answer the two last questions.
4.1. Sample
This research focuses on non-financial firms. The reason behind this is that financial companies have been more heavily regulated in the area of risk management (i.e. Basel Accords and Standard & Poor’s ERM enhancement) and they may adopt ERM driven by
Table 1: Initial sample, exclusion criteria and final sample
Initial
Sample
Exclusion criteria Final Sample
# By Country
Financial companies
Lack of relevant accounting data
Asia 499 106 84 309
Europe 600 132 119 349
Latin America 200 51 76 73
North America 600 122 128 350
Pacific 101 28 24 49
# By Sector
Consumer Discretionary 307 0 102 205
Consumer Staples 167 0 43 124
Energy 106 0 29 77
Financials 439 439 0 0
Healthcare 145 0 38 107
Industrials 338 0 83 255
IT 161 0 57 104
Material 177 0 35 142
Telecommunication Services
50 0 16 34
Utilities 110 0 28 82
Total 2000 1130
The period of study is 2005-2014, in order to have observation both before and after the 2007 crisis, an event that triggered awareness about the weakness of existing risk management models. In particular, it is reasonable to assume that most of the adoption has been done from 2005, because of the issuance of the most relevant frameworks (COSO and AS/NZ 4630) between 2004 and 2005.
4.2. Data Collection
appropriate measure. Beasley, Branson and Hancock (2014), indeed, state that organizations are not likely to formally designate an individual as the CRO or equivalent executive and in their survey, only 31% of respondents designated one. In an attempt to optimally identify adopters, Bloomberg database has been used in order to perform a content analysis on companies’ individual accounts, filtering them by the sentences “Enteprise Risk Management”, “Enterprise Risk Management (ERM)” and “Enteprise-wide Risk Management”.
4.3. Model Specification
To empirically investigate the relationship between ERM adoption and firm performance, a regression equation has been drawn. It is not possible to perform a simple OLS regression, because of the particular nature of the database, in which the same company presents data for different consequent years. The OLS model, indeed, ignores this nature and would consider each observation as correspondent to a different individual. A fixed effect panel regression model is utilized, in order to take into account the unobservable heterogeneity that exists over time and is correlated with the explanatory variables. An example could be the ability of management, a characteristic that cannot be observed but at the same time greatly impacts the implementation of management models. The appropriateness of such model is also confirmed by the Hausman test7, which permits to reject the null hypothesis of a non-systematic difference between the coefficients. A preliminary univariate analysis was performed and the computations have been performed on Stata®.
7The Hausman test compares two types of estimators (in this case random effect vs. fixed effects). The null hypothesis is
𝑄𝑖𝑡 = 𝛽0+ 𝛽1𝐸𝑅𝑀𝑖𝑡+ 𝛽2𝑆𝐼𝑍𝐸𝑖𝑡+ 𝛽3𝑃𝑅𝑂𝐹𝐼𝑇𝐴𝐵𝐼𝐿𝐼𝑇𝑌𝑖𝑡+ 𝛽4𝐿𝐸𝑉𝐸𝑅𝐴𝐺𝐸𝑖𝑡+ 𝛽5𝐺𝑅𝑂𝑊𝑇𝐻𝑖𝑡+
𝛽6𝐷𝐼𝑉𝐼𝐷𝐸𝑁𝐷𝑆𝑖𝑡+ 𝛽7𝑀𝐾𝑇𝑅𝐼𝑆𝐾𝑖𝑡+ 𝛽8𝐼𝐴𝑆𝐼𝐹𝑅𝑆𝑖𝑡+ 𝑢𝑖𝑡+ 𝜀𝑖𝑡 [1]
Following the hypothesis that ERM adoption affects firm performance, Tobin’s Q is considered as a proxy for firm performance and ERM is the main independent variable. This model specification has been taken from Bertinetti, Cavezzali and Gardenal (2013). A panel data specification is used for 1130 companies during 10 years (2005-2014) for a total of 11300 observations.
4.3.1. Dependent variable
Tobin’s Q is taken as a dependent variable. It is measured as:
Q =
[2]
Where:
Market value of firm = Market value of equity + Book value of liabilities [3]
Tobin’s Q is a proxy for firm performance from the investors’ perspective, namely
shareholders. Theory suggests that when Q is lower than one, the stock is undervalued, the contrary when Q is greater than one. According to Hoyt and Liebenberg (2011), Tobin’s Q is an appropriate performance measure because it reflects future expectations, differently from other accounting measures like Return on assets (ROA). Indeed, the benefits derived from ERM are not immediately realized. Lindenberg and Ross (1981) state that Tobin’s Q is
Stulz (1994) assert the superiority of Tobin’s Q, by referring to the unnecessary risk adjustment or normalization when using this proxy.
4.3.2. Independent variables
Enterprise Risk Management
The aforementioned benefits of ERM adoption hypothesize a positive relation between this variable and firm performance. As suggested by Pagach and Warr (2010), ERM should decrease the probability of achieving lower tail outcomes. Previous studies found that among insurers, ERM adopters were valued 16.7% more (Hoyt and Liebenberg, 2008). Bertinetti, Cavezzali and Gardenal (2013) found similar results for both financial and non-financial firms, where ERM adopters were valued 12.2% more than non-adopters did. These results suggest that ERM should increase firm performance and therefore:
H1: ERM is positively related to firm performance
Firm Size
Firm size is proxied by the natural logarithm of total assets. As stated by Tongli et al. (2005), firm size must be controlled for. Indeed, superior performance can be attributed to different firm sizes. Bertinetti, Cavezzali and Gardenal (2013) find a negative significant relationship between firm size and Tobin’s Q. Lang and Stulz (1994) and Allayannis and Weston (2001)
also find a significantly negative relation between size and firm value. Therefore a negative relationship between firm size and performance can be expected.
Financial Leverage
leverage have a positive impact on performance because of tax savings deriving from it. This is the base of Modigliani Miller second theorem (1963). On the other, the probability of default also increases. Based on this, a negative relationship between leverage and performance is hypothesized.
Profitability
Profitability can be defined as the ability of the firm to make a profit after considering any cost, and it is proxied by ROA. The latter is defined as Net income on Total assets and measures how a company is able to generate revenue from its investment of assets. It is very likely that Tobin’s Q is affected by profitability: the more a company is profitable, the more it creates value, thus the more the stock value is likely to increase. Allayannis and Weston (2001) affirm that profitable firms are likely to trade at a premium. Thus, a positive relationship between profitability and performance is predictable.
Growth Opportunities
They are proxied by annual percentage sales growth. Following the research of Gaver (1993) and Smith and Watts (1992), it is possible to notice that high-growth firms can benefit from higher performance. In the model theorized by Bertinetti, Cavezzali and Gardenal (2013), indeed, growth opportunities, measured by sales growth, have positive but not significant impact on firm value. Therefore a possible hypothesis can be a positive relationship between growth opportunities and performance.
Market Risk
representing the percent change in the stock price following a one per cent change in the market index price. Liebenberg and Hoyt (2011) argue that variation in Q is driven from greater volatility. Furthermore, Bertinetti, Cavezzali and Gardenal (2013) find significant and positive result on firm value. It can be then predicted that a positive relationship exists between market risk and firm performance.
Dividends
Dividends are proxied by a dummy variable taking value 1 when a dividend payment took place, and 0 otherwise. It is possible to assume that there is a positive relationship between firm performance and dividends, since dividends payout indicates that the firm has sufficient resources to make such payments. Moreover, dividend payments positively affect shareholder value creation, both according to Gordon’s (1962) theoretical framework of the “Bird in Hand” and to empirical results finding positive and significant relation between
dividends and firm performance (Ajanthan, 2013). IAS/IFRS
5. Data Analysis and Results
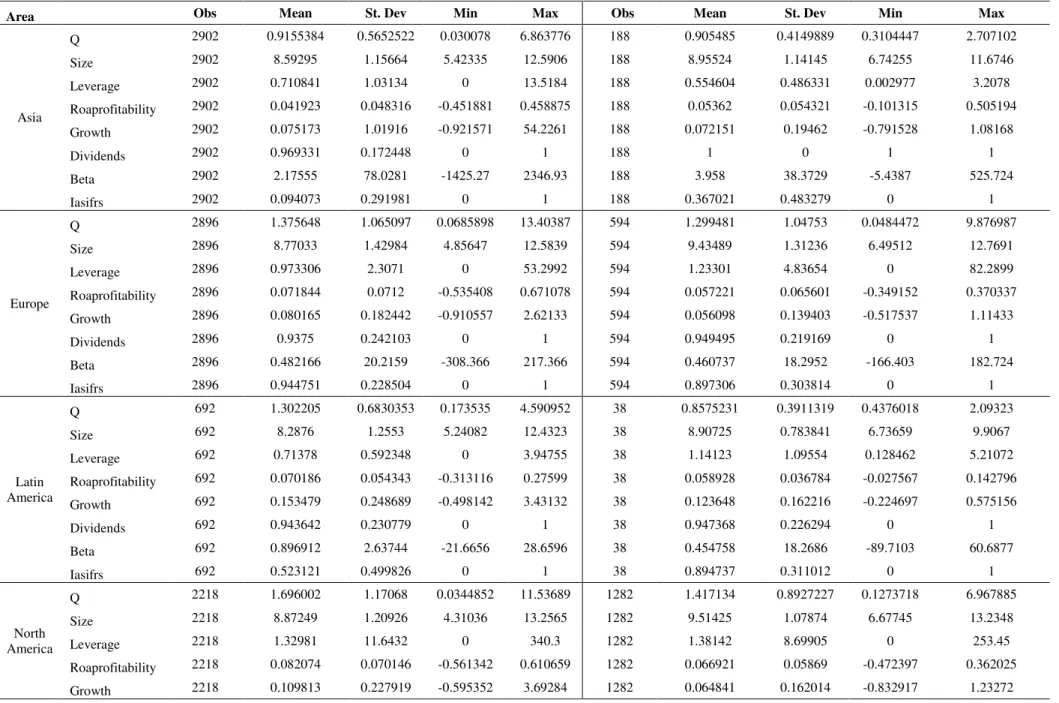
5.1. Descriptive analysis
A descriptive analysis has been carried on the whole sample as well as on subgroups by geographical area and by sector, differentiating between ERM adopters and non-adopters. This helped answering the first research question, about the identification of common characteristics of ERM adopters. Chart 1 shows the percentage of adopters in the sample. From the data it is possible to notice that the number of adopters increased steadily from 4.78% of the whole sample in 2005 to 36.11% in 2014.
Chart 1: ERM Adopters
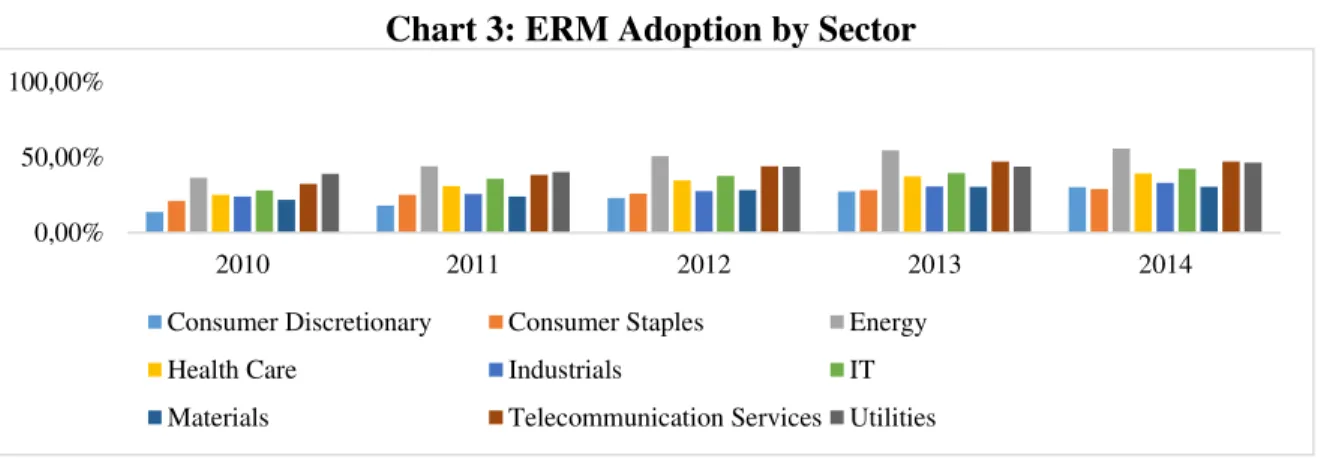
This appears to be true also for every subgroup. Pacific and North America mostly represent early adopters, as well as Energy and Utilities industries. These trends are maintained over time, even though the number of adopters considerably increased also in the other subgroups, as shown in Charts 2 and 3.
Chart 2: ERM Adoption by Area
4,78% 6,55% 9,03% 11,50% 14,87%
24,16% 28,05% 31,42% 34,25%
36,11%
0,00% 20,00% 40,00% 60,00% 80,00% 100,00%
2005 2006 2007 2008 2009 2010 2011 2012 2013 2014
0,00% 20,00% 40,00% 60,00% 80,00% 100,00%
2010 2011 2012 2013 2014
Chart 3: ERM Adoption by Sector
Table A4 in Appendix A shows the percentage of adopters crossed between countries and sectors. Turning to descriptive results, on average companies show a Q equal to 1.32, meaning that on average companies in the sample are overvalued. The minimum value for this variable is 0.03 and the maximum is 13.40. Size presents an average value of 8.80 log million, in a distribution which contains maximum value of 13.26 and minimum of 4. The distribution of leverage presents a mean value of 0.99, according to which the sample on average presents a nearly balanced amount of debt and equity. The sample presents a positive average for profitability (6.65%) and annual growth (0.09%), meaning that the sample contains on average profitable and growing firms. This is also true for the mean value of the beta (0.84) which shows an average positive systematic risk of the sample (See Table A1 in Appendix A).
After depicting a general picture of the sample, separate descriptive results have been drawn for adopters and non-adopters. Regarding the totality of the sample it has been possible to observe that adopters have an average Q higher than non-adopters, meaning that they are valued more than non-adopters. They are also bigger and more leveraged. Adopters present higher profitability, higher sustainable growth, lower beta and tend to pay more dividends. They are also typically IAS/IFRS non-adopters (See Table A2 in Appendix A).
0,00% 50,00% 100,00%
2010 2011 2012 2013 2014
Consumer Discretionary Consumer Staples Energy
Health Care Industrials IT
These results are consistent with findings in previous studies. In particular, similar results about higher size and financial leverage of ERM adopters were found by Hoyt and Liebenberg (2003, 2011), Beasley, Clune and Hermanson (2005), Golshan and Rasid (2012), Bertinetti Cavezzali and Gardenal (2012). This research adds to the previous findings, by showing that adopters tend to pay more dividends than non-adopters, grow less, have lower betas and do not adopt IAS/IFRS standards.
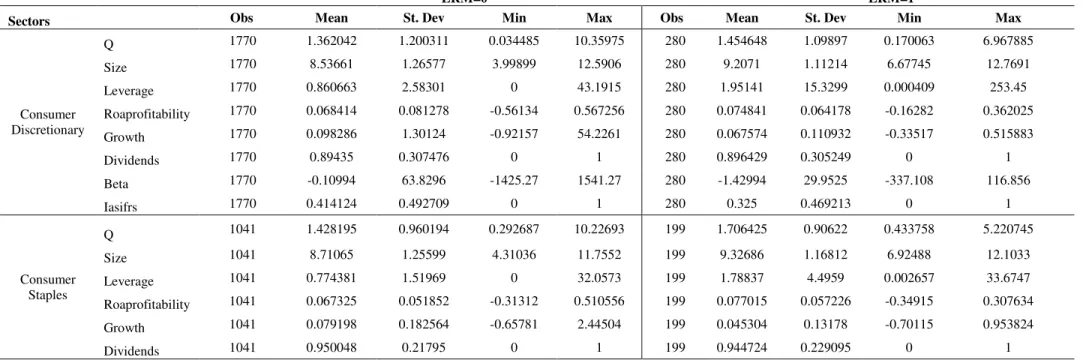
A deeper analysis was carried on every subgroup (See Table B4 and B5 in Appendix B for more details). The aforementioned characteristics of adopters are somewhat confirmed in all the five areas. In each of them, ERM adopters’ Q is lower than non-adopters’. In North and
Latin America and Europe, adopters are less profitable though. In Asia, they are less leveraged and show a higher beta. The same is true also looking at sector subgroups. Adopters’ Q is higher than non-adopters’ only in four sectors, namely Consumer Staples,
5.2. Regression results
Table A5 in Appendix A presents the regressions results. The univariate results show that ERM adoption has a significant negative impact on Tobin’s Q, with a coefficient equal to
-0.075 meaning that ERM adopters have a lower Q by 0.075 than non-adopters. The statistical significance of this coefficient can be observed through the p-value equal to zero, lower than 0.05 thus leading to the conclusion that the result is statistically significant at a five per cent significance level. Despite this results, the explanatory power of the model is very low (R2=0.0001), thus the model is not strong enough.
between ERM and IAS/IFRS adoption, the coefficient results to be negative and non-statistically significant, while the coefficient on ERM increases.
By performing an F-test it is possible to assess that all the independent variables included in the model are jointly significant, thus the regression exists.
The results obtained are in line with previous research by Waveru and Kisaka (2011), Hoyt and Liebenberg (2011), Bertinetti, Cavezzali and Gardenal (2013), Ai, Chen, Zhao (2014) in that it finds a positive and significant relationship between ERM adoption and firm performance.
It is possible to obtain more accurate results by lagging the ERM variable by two years (Table A5 in Appendix A, column (4)). This means that the dummy variable will turn into 1 after two years from the first ERM adoption. Indeed, it is reasonable to assume that markets do not immediately react to the ERM adoption, if it appears, but it will take some time for the information to be reflected into firm’s value8. This modification helps improving the
model. The coefficient is now 0.1028 with a p-value equal to 0.00, meaning that ERM adopters have an higher Q by 0.10 than non-adopters, thus they perform better. The effects of the other variables remain the same. From now on, this model will be taken into account in order to check for country and sector differences. Also checking for robustness of the results9, the positive and significant relationship remains.
8
In particular it is hypothesized that one year after the first adoption is needed to set up the process, while during the second year the company can start implementing it appropriately.
9By typing “robust” at the end of the regression it is possible to control for heteroskedasticity, a phenomenon that often
Performing the analysis for every sub group, the results hold only for some of them (See Tables B6 and B7 in Appendix B)10. The relationship is positive and significant only in the North American and European area. In the other seems to be positive and non-significant, except for Latin America in which it is negative and non-significant. Country differences may be in particular driven from different levels of GDP, thus a control variable for real GDP growth is also included. Nonetheless, the results do not change and the explanatory power of the model (R2) does not improve. Besides macroeconomic variables, culture differs a lot between different countries, and consequently the approach to risk, which may be the underlying reason for such differences. Lastly, also the age of a company may be a discriminator: firms who are older may be in a stable or declining growth phase, thus needing for new ways to tackle different categories of risks. For what concerns sectors, the relationships holds only for some of them. In particular, ERM positively and significantly impact Q only in the Consumer Discretionary, Consumer Staples, Health Care, Industrials and Utilities sectors, but when coefficients’ robustness is controlled for, only the Health Care sector shows significant results. The others show non-significant relationships. It is possible that uncontrolled effects have stepped in, like cyclicality. This could be driven by the sensitivity to economic cycles. Indeed, both Utilities and Energy sectors are highly sensitive to economic and political cycles. Consumer Discretionary, Industrials and Materials sectors are cyclical as well, meaning that they perform well when the economy goes well. Consumer Staples and Health Care sectors are, on the contrary, non-cyclical and characterized by stable demand. Different sectors also cope with different kind of risks; therefore, even if Enterprise
10
Risk Management comprehensively manages all categories of risks, some of them may react differently to a new risk management model.
An additional and fundamental argument that can explain the differences in results is related to how companies disclose ERM adoption. Since regulators do not mandate the adoption of such a process to non-financial companies, and its implementation is voluntary, there is not a unique way through which they disclose information about ERM adoption. Therefore, those results may be driven by different levels of advancement in ERM implementation, that can be only checked through an accurate analysis of how companies disclose it.
5.3. Additional analysis
In order to internally validate the ERM variable and to further explore the inequality of ERM adoption, a disclosure analysis has been carried out. In particular, a convenience sample has been built, namely, the Telecommunication sector has been analysed because of limited dimension (34 firms). The first objective is to make sure that those companies who were identified as ERM adopters are actually implementing it. The results show that there were a very small percentage of errors. Only 8% (3 over 34) of the companies’ analysed result not to implement ERM when instead were identified as ERM adopters. The reason is mainly that there are companies who mention Enterprise Risk Management in their accounts only as a future objective, without practically implementing it. Secondly, the advancement of implementation was to be explored. The results show that there is actually difference among companies when it comes to disclose ERM adoption. A scoring criterion was identified.
Table 2: Scoring criteria for ERM disclosure 0 Not mention
Table 2: Scoring criteria for ERM disclosure
2
Mention Enterprise Risk Management or a synonym
(Enterprise-wide risk management, holistic risk management, strategic risk management)
3 Implement Enteprise Risk Management
4 Extensively implement Enterprise Risk Management, identifying the process
Results show that the majority of adopters fall in the category 1 or 2. In particular, category 1 entails the compliance with one of the guidances explained in section 3.1., thus not specifically representing a regulatory framework and leaving room for discretion. Therefore, since the majority of companies limits ERM disclosure to mentioning the adoption, it is very difficult to assess the advancement or quality of implementation. The more advanced an ERM process is, the most it can contribute to firm performance. Given the broad variability and discretion around implementation quality, it is then challenging to assess its real impact on it.
An additional analysis was carried out to check the existence of the relationship between ERM adoption and firm performance by using other proxies than Tobin’s Q. Profit Margin
(Net Income/Sales), Operating Margin (Earnings Before Interests and Taxes/Sales), Natural logarithm of Enterprise Value, ROA (Net Income/Total Assets), ROE (Net Income/Shareholder’s Equity) and Economic Value Added/Total Assets have been assessed.
6. Conclusion
The purpose of this Work Project was to empirically investigate the impact of Enterprise Risk Management on firm performance. Enterprise Risk Management is a process for managing risk differing from traditional risk management: it takes an integrated approach, it considers all categories of risks and focuses on both upside and downside volatility. This paper started from analyzing the predicted benefits of ERM implementation, mainly better shock resistance, reduced earnings volatility and increased performance, improved market reputation and higher company value, as well as organizational costs. It then examined previous literature, focusing on studies dealing both with determinants of ERM adoption and with the relationship between ERM adoption and shareholder value creation. Regulatory guidance was scrutinized, even if none of them mandates ERM implementation. A sample of 1130 companies from the STOXX® index was taken, including North and Latin America, Europe, Pacific and Asia geographies as well as Consumer Discretionary, Consumer Staples, Energy, Health Care, Industries, Information Technology, Materials, Telecommunication Services, and Utilities sectors during the period 2005-2014. Data was collected from Bloomberg database and individual company reports were analysed to find evidence of ERM adoption. A regression equation was specified, including Tobin’s Q as a dependent variable
performed on every subgroup lead to the conclusion that the relationship holds only in North America and Europe, and in the Consumer Discretionary, Consumer Staples, Health Care, Industrials and Utilities sectors. A disclosure analysis helped to internally validate the ERM variable, and to assess the variability among the quality and advancement of ERM implementation.
As a result of this research, some recommendations arise for institutions related to the adoption of ERM. A better geographical distinction may be utilized when defining an ERM guidance, since cultural and macroeconomic differences are not to be neglected. Moreover, it was noticed that sectors have different shock resistance, and it would be appropriate also to discriminate in this sense. Furthermore, minimum requirements for disclosures, and standardization of them, may be imposed to ERM adopters.
References
Ai, Jing, Hua Chen, and Yang Zhao. 2014. “Does ERM Improve Firm Value? Evidence from Listed Chinese Nonfinancial SOEs.” Fox School of Business Working Paper, Available at SSRN: http://ssrn.com/abstract=2538915. Accessed on 22/1/2015
Ajanthan, Alagathurai. 2013. “The Relationship between Dividend Payout and Firm Profitability:
A Study of Listed Hotels and Restaurant Companies in Sri Lanka.” International Journal of Scientific and Research Publications, 3(6): 1-6
Allayannis, George, and James Weston. 2001, “The Use of Foreign Currency Derivatives and Firm Market Value.” Review of Financial Studies, 14: 243-276.
Australian/New Zealand Standard. 2004. Risk Management. AS/NZS 4360:2009. 3rd ed Sydney and Wellington: Standards Australia Ltd. And Standards New Zealand
Barton, Thomas L., William. G. Shenkir, and Paul L. Walker. 2010. “ERM After the Financial
Crisis.” Financial Executive International Magazine, April 2010: 18-22
Beasley, Mark S., Bruce Branson, and Bonnie Hancock.2014. “Report on the Current State of
Enterprise Risk Oversight.” 5th Edition ERM Initiative Raleigh, NC: NC State. June 2014.
Beasley, Mark S., Richard Clune, and Dana Hermanson.(2005), “Enterprise Risk Management:
An Empirical Analysis of Factors Associated with the Extent of Implementation.” Journal of Accounting and Public Policy 24(6): 521-531.
Bertinetti, Giorgio S., Elisa Cavezzali, and Gloria Gardenal. 2013. “The Effect of Enterprise Risk Management Implementation on the Firm Value of European Companies.” Università Ca' Foscari Venezia Working Paper No. 10/2013. Available at SSRN: http://ssrn.com/abstract=2326195. Accessed on 20/01/2015
Brancato, Carolyn, Matteo Tonello, Hellen Hexter, and Katharine R. Newman. 2006. “The Role of U.S. Corporate Boards in Enterprise Risk Management.” The Conference Board Research Report No. R-1390-06-RR. Available at SSRN: http://ssrn.com/abstract=941179. Accessed on 31/05/2015
Casualty Actuarial Society.2003. “Overview of Enterprise Risk Management.” The CAS Enterprise Risk Management Committee Casualty Actuarial Society Forum Summer 200: 99-164
Committee of Sponsoring Organizations of the Treadway Commission (COSO). 2004.
“Enterprise Risk Management - Integrated Framework.” available at http://www.coso.org, accessed
07/01/2013.
D’Arcy, Stephen P.2001. “Enterprise Risk Management.” Journal of Risk Management of Korea 12(1): 207-228.
Daud, Wan N. W., Hasnah Haron, and Daing N. Ibrahim.2011. “The Role of Quality Board of
Directors in Enterprise Risk Management (ERM) Practices: Evidence from Binary Logistic Regression.” International Journal of Business and Management 6(12): 205-211.
Eckles, David L., Robert E. Hoyt, and Steve M. Miller. Forthcoming. “The Impact of Enterprise Risk Management on the Marginal Cost of Reducing Risk: Evidence from the Insurance Industry.” Journal of Banking and Finance
Financial Reporting Council.2003.”The Combined Code on Corporate Governance.” Published by the Financial Reporting Council.
Gates, Stephen, Jean-Louis Nicolas, and Paul L. Walker.2012. “Enterprise Risk Management: A
Process for Enhanced Management and Improved Performance.” Management Accounting Quarterly 13(3): 28-38
Gatzert, Nadine, and Michael Martin. 2013. “Determinants and Value of Enterprise Risk
Management: Empirical Evidence from the Literature.” Risk Management and Insurance Review 18(1): 29-53
Gaver, Jennifer J., and Kenneth M. Gaver. 1993. “Additional Evidence on the Association between the Investment Opportunity Set and Corporate Financing, Dividend, and Compensation Policies.” Journal of Accounting and Economics, 16(1-3): 125-160.
Golden, Sean. 2011. “China’s Perception of Risk and the Concept of Comprehensive National Power.” The Copenhagen Journal of Asian Studies, 29(2): 79-109
Golshan, Nargess M., and Siti Z. A. Rasid. 2012. “Determinants of Enterprise Risk Management
Adoption: An Empirical Analysis of Malaysian Public Listed Firms.” International Journal of Social and Human Sciences, 6(2): 119-126.
Gordon, Myron. 1962. “The Savings, Investment and Valuation of a Corporation.” Review of Economics and Statistics, 44(1): 37-51.
Gordon, Lawrence A., Martin P. Loeb, and Chih-Yang Tseng. 2009. “Enterprise Risk
Management and Firm Performance: A Contingency Perspective.” Journal of Accounting and Public Policy 28(4): 301-327.
Grace, Martin, J. Tyler Leverty, Richard D. Phillips, and Prakash Shimpi.2013. “The Value of
Investing in Enterprise Risk Management.” The Journal of Risk and Insurance, 82(2): 289–316
Hoyt, Robert E., and Andre P. Liebenberg. 2011. “The Value of Enterprise Risk Management.” Journal of Risk and Insurance, 78(4): 795-822.
Lang, Larry H. P., and Rene M. Stulz. 1994. “Tobin’s Q, Corporate Diversification, and Firm Performance.” Journal of Political Economy,102(6): 1248-1280.
Lindenberg, Eric B., and Stephen R. Ross. 1981, “Tobin’s Q Ratio and Industrial Organization.” Journal of Business, 54(1): 1-32.
Kleffner, Anne E., Ryan B. Lee, and Bill McGannon. 2003. “The Effect of Corporate Governance on the Use of Enterprise Risk Management: Evidence from Canada.” Risk Management and Insurance Review 6(1): 53-73
McShane, Michael K., Anil Nair, and Elzotbek Rustambekov. 2011. “Does Enterprise Risk
Management Increase Firm Value?” Journal of Accounting, Auditing & Finance 16(4): 641-658.
Mehr, Robert I., and Bob A. Hedges. 1963. Risk Management in the Business Enterprise. Homewood, IL: Richard D. Irwin.
Nocco, Brian W., and René M. Stulz. 2006. “Enterprise Risk Management: Theory and Practice.” Journal of Applied Corporate Finance 18(4): 8-20
Pagach, Donald, and Richard Warr.2010. “The Effects of Enterprise Risk Management on Firm
Performance.” North Carolina State University, Raleigh Working Paper
Quon,Tony K., Daniel Zeghal, and Michael Maingot. 2012. “Enterprise Risk Management and Firm Performance.” Procedia – Social and Behavioral Sciences 62: 263-267
Segal, Sim. 2011. Corporate Value of Enterprise Risk Management: The Next Step in Business Management. Hoboken, New Jersey: John Wiley & Sons, Inc
Smith, Clifford W. Jr., and Ross L., Watts.1992. “The Investment Opportunity Set and Corporate Financing, Dividend and Compensation Policies.” Journal of Financial Economics, 32(3): 263-292.
Standard and Poor’s, 2005.“Evaluating The Enterprise Risk Management Practices Of Insurance
Companies.” New York: Standard and Poor’s LLP. Available at: www.standardandpoors.com/ratingsdirect. Accessed on 18/02/2015
Stardard and Poor’s, 2008. “Standard and Poor’s to apply Enterprise Risk Analysis to Corporate Ratings.” New York: Standard and Poor’s LLP. Available at: www.standardandpoors.com/ratingsxpress. Accessed on 18/02/2015
Tahir, Izah M., and Ahmad E., Razali. 2011. “The Relationship between Enterprise Risk
Management and Firm Value: Evidence from Malaysian Public Listed Companies.” International Journal of Economics and Management Sciences 1(2): 32-41.
Tongli, Lin, Er J., Ping, and Winston C., Kwok. 2005. “International Diversification and Performance: Evidence from Singapore.” Asia Pacific Journal of Management, 22(1): 65-88
Waveru, Nelson, and Eric S., Kisaka. 2011. “The Effect of Enterprise Risk Management
APPENDIX A
Table A1: Descriptive statistics (whole sample)
Variable Obs Mean Std. Dev Min Max
Q 11300 1.32145 0.99821 0.03008 13.4039
Size 11300 8.80433 1.30706 3.99899 13.2565
Leverage 11300 0.99967 6.1787 0 340.3
Roaprofitability 11300 0.06645 0.14248 -0.5613 8.62417
Beta 11300 0.84225 43.0602 -1425.3 2346.93
Growth 11300 0.08968 0.57003 -0.92157 54.22613
Dividends 11300 0.90708 0.29033 0 1
Iasifrs 11300 0.409026 0.491675 0 1
Table A2: Descriptive statistics for ERM non-adopters/adopters ERM=0
Variable Obs Mean Std. Dev Min Max
Q 9032 1.316041 1.01302 0.030078 13.40387
Size 9032 8.663085 1.300337 3.998987 13.25646 Roaprofitability 9032 0.064693 0.065681 -0.56134 0.671078
Leverage 9032 0.943173 5.953121 0 340.3
Growth 9032 0.094179 0.619247 -0.92157 54.22613
Dividends 9032 0.905447 0.292612 0 1
Beta 9032 1.009193 46.79646 -1425.27 2346.934
Iasifrs 9032 0.414637 0.492687 0 1
ERM=1
Variable Obs Mean Std. Dev Min Max
Q 2268 1.342976 0.936803 0.048447 11.07831
Size 2268 9.366811 1.175974 6.495121 13.23475 Roaprofitability 2268 0.073457 0.289722 -0.4724 8.624167
Leverage 2268 1.22466 7.002278 0 253.4499
Growth 2268 0.071779 0.302525 -0.83292 12.12761
Dividends 2268 0.91358 0.281045 0 1
Beta 2268 0.17744 22.7378 -337.108 525.7243
Table A3: Pearson Correlation Matrix
Q Erm L2. Erm Size Leverage Roaprofitability Growth Dividends Beta Iasifrs Rgdpg
Q 1
Erm
--. 0.0411 1
L2. 0.0294 0.7922 1
Size -0.3021 0.2255 0.1867 1
Leverage 0.0117 0.0329 0.0092 0.045 1
Roaprofitability 0.3105 0.0288 0.0313 -0.1238 -0.0198 1
Growth 0.0597 -0.0051 -0.0131 -0.0181 -0.0017 0.0243 1
Dividends -0.1412 -0.0016 0.0322 0.103 -0.048 -0.0045 -0.0663 1
Beta -0.0139 -0.0165 -0.0043 -0.0039 -0.0187 0 -0.0038 0.0235 1
Iasifrs 0.044 -0.044 -0.0126 -0.0168 -0.0094 0.0461 0.0229 0.1332 0.014 1
Rgdpg -0.1343 -0.1125 -0.0692 -0.1213 -0.0362 -0.0258 0.0554 0.1228 -0.0098 -0.2419 1
Table A4: Percentage of adopters by sector in each area
Adopters in 2014 Asia Europe
North America
Latin
America Pacific
Consumer discretionary 6.06% 26.15% 63.49% 0.00% 14.29%
Consumer staples 3.33% 21.43% 68.57% 0.00% 50.00%
Energy 0.00% 37.50% 64.29% 33.33% 85.71%
Health Care 0.00% 38.71% 63.64% 0.00% 25.00%
Industrials 11.63% 32.97% 66.10% 23.08% 33.33%
Information technology 19.51% 28.57% 70.73% 0.00% 100.00%
Materials 4.88% 27.50% 68.75% 17.65% 41.67%
Telecommunication services 60.00% 53.33% 83.33% 0.00% 0.00%
Table A5: Regression results
Q (1) (2) (3) (4) 11 (5)
Intercept 1.34 3.89 3.89 1.79 1.85
(0.0066)*** (0.1457)*** (0.51191)*** (0.47252)*** (0.48756)***
ERM -0.0754 0.046 0.066
(0.0199)*** (0.0205)** (0.0239)***
L2.ERM 0.1028 0.1053
(0.0327)*** (0.0388)***
Size -0.3048 -0.33062 -0.0731 -0.0856
(0.0166)*** (0.01739)*** (0.0493) (0.0537)
Roaprofitability 0.5128 0.5126 0.4493 0.4057
(0.0430)*** (0.0430)*** (0.3996) (0.3688)
Leverage 0.00148 0.00148 0.00333 0.00332
(0.0009) (0.0009) (0.00235) (0.00229)
Growth 0.04874 0.04858 0.04002 0.0293
(0.0093)*** (0.0093)*** (0.0144)** (0.0081)***
Dividends 0.07263 0.06969 0.0775 0.0443
(0.0339)** (0.0340)** (0.0665) (0.0682)
Beta -0.00005 -0.00005 -0.00027 -0.00011
(0.00012) (0.00012) (0.00085) (0.00084)
IAS/IFRS 0.0140 -0.0040
(0.0315) (0.0473)
ERM*IAS/IFRS -0.06275 -0.0987
(0.0389) (0.0789)
RGDPG 3.3476
(0.4919)***
Observation 11300 11300 11300 11300 11300
R-Squared 0.0001 0.1309 0.1317 0.1449 0.0433
F-Stat 14.29 79.32 61.99 3.83 33.77
Rho 0.7167 0.6915 0.6913 0.7401 0.7544
*** p-value < 1% ** p-value < 5% * p-value < 10%
11
APPENDIX B
Table B1: Categories of risks as defined by Casualty Actuarial Society Type of risk Includes
Hazard risks
Fire and other property damage Windstorm and other natural perils Theft and other crime, personal injury Business interruption
Disease and disability Liability claims
Financial Risks
Price Liquidity Credit
Inflation/Purchasing power Hedging/basis risk
Operational Risks
Business operations Empowerment
Information Technology Information/Business reporting
Strategic risks
Reputational damage Competition
Customer wants
Demographic and Social/Cultural trends Technological innovation
Capital availability
Regulatory and political trends Source: Casualty Actuarial Society (2003)
Table B2: Variables definition
Variables Definition
Q Market value of firm / Total Assets
ERM Dummy. ERM=1 from the first year of adoption, ERM=0 otherwise Size Natural logarithm of Total Assets
Roaprofitability ROA. Net income / Total Assets Leverage Total Debt / Total Equity
Growth Sales growth
Dividends Dummy. Dividends=1 if firm paid dividends, Dividends=0 otherwise
Beta Percent change in the stock price following a 1% change in the market index price
Chart B1: Areas and Sectors Breakdown
North America 31%
Europe 31% Asia
27%
Latin America 7%
Pacific 4%
Areas
Consumer Discretionary
23%
Consumer Staples 18%
Energy 13% Health Care
11% Industrials
9% Information
Technology 9%
Materials 7%
Telecommunicatio n Services
7%
Utilities 3%
Table B3: Literature review
Author Country Focus Sample Dependent
variable Independent Variable Findings
Liebenberg. Hoyt
(2003) US
Identify the determinants of ERM adoption
26 U.S. companies
(1997-2001) CRO appointment
Size. Leverage. Earnings volatility. Stock price volatility.
Financial services. Average Market-to-Book ratio. Institutional ownership. U.K./Canadian subsidiary
Absence of systematic differences between firms that appoint a CRO and other firms. More leveraged firms are more inclined to appoint a
CRO. Beasley. Clune. Hermanson (2005) US Examine organizational factors associated with an
entity's stage of ERM implementation.
123 US and international
organizations ERM Stage
Presence of CRO. Board members independence. the extent of CEO and CFO calls for internal audit involvement in ERM. Presence of a Big 4 auditor. Revenues. Industry. US
based.
Board and senior management leadership on ERM is critical to extensive ERM deployment. and other organizational characteristics. such as size. auditor type. industry. and country of domicile also help to explain the extent of ERM
implementation
Gordon. Loeb and
Tseng (2009) US
Find evidence that the relation between ERM and
firm performance is contingent upon some
factors.
112 US firms that disclose the implementation of their ERM activities within their 10Ks and 10Qs filed with the US Securities and
Exchange Commission
Effectiveness of ERM
Environmental uncertainty. industry competition. size. firm
complexity. monitoring by firm’s board of directors
For high performing firms. all the contingent variables are significant except for environmental uncertainty. For non high performers. none of the
variables has a significant effect on ERM
Grace. Leverty. Phillips. Shimpi
(2010)
US
Examine the impact of Enterprise Risk Management on firm
performance.
Life and property-insurance firm operating in US.
Cost efficiency and revenue
efficiency
Firm characteristics (size. capital to asset ratio. product line mix. A.M. Best rating. part
of a group of insurers. a licensed property-liability insurer. publicly traded firm. privately held stock company).
ERM activities
ERM practices in insurance industry result in economically and statistically significant increases in cost and revenue efficiency.
Pagach. Warr
(2010) US
Examine the changes of financial characteristics around the ERM adoption.
106 firms listed in Compustat that appointed a
Chief Risk Officer
N/A N/A All the changes are insignificant. No effect on firm characteristics from ERM adoption.
McShane. Nair. Rustambekov
(2010)
US
Investigate the relationship between ERM and firm
value
82 publicly traded insurers for which S&P released an
ERM rating.
Tobin's Q
ERM rating. Size. Leverage. Systemic risk. Profitability. Cash flow volatility. Growth
opportunities. Complexity
Roughly positive relationship between ERM and firm value. with a peak for ERM3 and ERM4. The results suggest that firm value increases as firms implement increasingly more sophisticated
TRM but does not increase further as firms achieve ERM4
Daud. Haron.
Ibrahim (2011) Malaysia
Examine the factors associated with the level of
adoption of ERM
89 board non-financial companies listed in
Malaysia Bourse
Level of ERM implementation
(partial or complete)
Quality of board of directors
ERM is practiced by Malaysian firms but it is still in an embronial stage. Moreover. the quality
of the board of directors influences the level of ERM implementation
Eckles. Hoyt.
Miller (2011) US
Test the hypotesis that practicing ERM reduces firms' cost of reducing firm
69 insurance firm that adopted ERM between
1995 and 2008
Firms' risk
ERM adoption. Size. Operation complexity. International
operations. Institutional ownership. Volatility of returns.
Table B3: Literature review
Author Country Focus Sample Dependent
variable Independent Variable Findings
Waveru. Kisaka
(2011) Kenya
Factors influencing the level of ERM implementation and relationship between the implementation of ERM and company's value
22 companies listed in the
Nairobi Stock Exchange Tobin's Q
ERM Level. Size. Leverage. Profitability. Dividend policy.
Growth opportunities
The level of ERM implementation has a significant effect on the value of the companies
that implement it.
Hoyt. Liebenberg
(2011) US
Measure the extent to which specific firms have implemented ERM programs and assess the value implications of them
117 publicly traded insurance firms
(1995-2005)
Tobin's Q
ERM treatment. Size. Leverage. Sales Growth. ROA. Diversification. international
diversification. Dividends. Insider share ownership. Life
insurers. Beta.
Insurers with ERM programs are valued higher than other insurers. and ERM users are systematically different from non users. in terms
of size. leverage. opacity. financial slack. return volatility. and institutional ownership.
Tahir. Razali
(2011) Malaysia
Estimate the relation between firm value and
ERM
528 public listed Malaysian
firms Tobin's Q
ERM. Size. Leverage. International diversification.
Ownership. ROA
Positive but not significant results
Golshan. Rasid
(2012) Malaysia
Investigate factors that
influence ERM adoption 90 Malaysian firms ERM Adoption
Size. Firm Complexity. Industries. Country of Domicile. Leverage. Big4. Independence of Board of Directors. Asset's Opacity. Stock Price Volatility. Institutional Ownership
Leverage and the presence of a Big Four auditor are the two influential factors of ERM adoption
Quon. Zeghal.
Maingot (2012) Canada
Examine the relationship between Enterprise Risk Management information
content and firm performance.
156 non financial firms on the Standard & Poor's Toronto Stock Exchange
Composite Index during 2007 and 2008
N/A N/A
While there were differences in the observed average levels of risk assessments. they were not
statistically significant. It is not possible to conclude that the
assessed levels of economic or market risk exposure or consequences are related to firm
performance.
Bertinetti. Cavezzali. Gardenal (2013)
Italy
Investigate the impact of ERM on the enterprise vale
and discover the determinants of this
adoption
200 European Companies both financial and
non-financial (2002-2011)
Tobin's Q/ERM
ERM. Size. Leverage. Sales growth. ROA. Dividends. Beta/Size. Leverage. Opacity.
Financial Slack. Change in EBIT. Value change
ERM adoption has a strong positive impact on company value. ERM adoption depends on the company opacity. size and financial slack.
Jing Ai. Hua Chen. Yang Zhao
(2014)
China Provide evidence for the value of ERM
1506 nonfinancial Chinese
listed firms Tobin's Q
ERM (dummy). Size. Growth. Leverage. Dividend Payments.
NERI index. Controlling Shareholder. Market Index.
Nature. Business Focus. Opacity. Audit Risk. Big15
Table B4: Descriptive results by Area by adopters/non-adopters
ERM=0 ERM=1
Area Obs Mean St. Dev Min Max Obs Mean St. Dev Min Max
Asia
Q 2902 0.9155384 0.5652522 0.030078 6.863776 188 0.905485 0.4149889 0.3104447 2.707102
Size 2902 8.59295 1.15664 5.42335 12.5906 188 8.95524 1.14145 6.74255 11.6746
Leverage 2902 0.710841 1.03134 0 13.5184 188 0.554604 0.486331 0.002977 3.2078
Roaprofitability 2902 0.041923 0.048316 -0.451881 0.458875 188 0.05362 0.054321 -0.101315 0.505194
Growth 2902 0.075173 1.01916 -0.921571 54.2261 188 0.072151 0.19462 -0.791528 1.08168
Dividends 2902 0.969331 0.172448 0 1 188 1 0 1 1
Beta 2902 2.17555 78.0281 -1425.27 2346.93 188 3.958 38.3729 -5.4387 525.724
Iasifrs 2902 0.094073 0.291981 0 1 188 0.367021 0.483279 0 1
Europe
Q 2896 1.375648 1.065097 0.0685898 13.40387 594 1.299481 1.04753 0.0484472 9.876987
Size 2896 8.77033 1.42984 4.85647 12.5839 594 9.43489 1.31236 6.49512 12.7691
Leverage 2896 0.973306 2.3071 0 53.2992 594 1.23301 4.83654 0 82.2899
Roaprofitability 2896 0.071844 0.0712 -0.535408 0.671078 594 0.057221 0.065601 -0.349152 0.370337
Growth 2896 0.080165 0.182442 -0.910557 2.62133 594 0.056098 0.139403 -0.517537 1.11433
Dividends 2896 0.9375 0.242103 0 1 594 0.949495 0.219169 0 1
Beta 2896 0.482166 20.2159 -308.366 217.366 594 0.460737 18.2952 -166.403 182.724
Iasifrs 2896 0.944751 0.228504 0 1 594 0.897306 0.303814 0 1
Latin America
Q 692 1.302205 0.6830353 0.173535 4.590952 38 0.8575231 0.3911319 0.4376018 2.09323
Size 692 8.2876 1.2553 5.24082 12.4323 38 8.90725 0.783841 6.73659 9.9067
Leverage 692 0.71378 0.592348 0 3.94755 38 1.14123 1.09554 0.128462 5.21072
Roaprofitability 692 0.070186 0.054343 -0.313116 0.27599 38 0.058928 0.036784 -0.027567 0.142796
Growth 692 0.153479 0.248689 -0.498142 3.43132 38 0.123648 0.162216 -0.224697 0.575156
Dividends 692 0.943642 0.230779 0 1 38 0.947368 0.226294 0 1
Beta 692 0.896912 2.63744 -21.6656 28.6596 38 0.454758 18.2686 -89.7103 60.6877
Iasifrs 692 0.523121 0.499826 0 1 38 0.894737 0.311012 0 1
North America
Q 2218 1.696002 1.17068 0.0344852 11.53689 1282 1.417134 0.8927227 0.1273718 6.967885
Size 2218 8.87249 1.20926 4.31036 13.2565 1282 9.51425 1.07874 6.67745 13.2348
Leverage 2218 1.32981 11.6432 0 340.3 1282 1.38142 8.69905 0 253.45
Roaprofitability 2218 0.082074 0.070146 -0.561342 0.610659 1282 0.066921 0.05869 -0.472397 0.362025