Vol.48, n. 2 : pp. 275-284, March 2005
ISSN 1516-8913 Printed in Brazil
BRAZILIAN ARCHIVES OF
BIOLOGY AND TECHNOLOGY
A N I N T E R N A T I O N A L J O U R N A L
Genetic, Morphological and Spatial Characterization of two
Populations of
Mabea fistulifera
Mart. (Euphorbiaceae), in
Different Successional Stages
Maíra Figueiredo Goulart
1, Sérvio Pontes Ribeiro
2and Maria Bernadete Lovato
1*1Universidade Federal de Minas Gerais; Instituto de Ciências Biológicas; Departamento de Biologia Geral;
Av. Antônio Carlos, 6627; lovatomb@mono.icb.ufmg.br; 31270-901; Belo Horizonte - MG - Brazil; 2Universidade
Federal de Ouro Preto; Instituto de Ciências Exatas e Biológicas; Departamento de Ciências Biológicas; Campus Morro de Cruzeiro; 35400-000; Ouro Preto - MG - Brazil
ABSTRACT
Two populations of Mabea fistulifera (Euphorbiaceae) located at Rio Doce State Park (Minas Gerais, Brazil) in
places characterized as in different successional stages, were investigated through genetic and ecological traits. Twenty randomly chosen individuals from each population had its genetic data assessed by 43 RAPD markers and were also evaluated through five morphologic traits and its spatial distribution. Both Shannon’s index and AMOVA reveled that most of the genetic variation was found between individuals within populations and about 9% of variation was located between populations. Moreover, populations differed genetically, but presented similar values of genetic diversity. Morphologic data showed differences between populations. Significant correlations among matrix of genetic, geographic and morphologic distances were obtained considering both populations, and spatially closer individuals were more similar genetically, characterizing genetic substructured populations.
Key words:Mabea fistulifera, genetic diversity, RAPD, tree architecture, spatial distribution, successional gradient.
*
Author for correspondence
INTRODUCTION
The neotropical genus Mabea (Euphorbiaceae) contains about 50 species (Martinez et al., 2000), among which, Mabea fistulifera is a medium-sized pioneer tree species that occurs commonly in semidecidous tropical environments on the south-eastern Brazil (Lorenzi, 1992; Olmos and Boulhosa, 2000). It is a species with a generalist range of pollinators, whose inflorescences present rich nectar source capable to attract a great variety of animals (Torres de Assumpção, 1981; Vieira et al., 1991; Ferrari and Strier, 1992; Vieira and Carvalho-Okano, 1996; Olmos and Boulhosa, 2000). Mabea fistulifera represents a key food
resource during the dry season, and therefore, its use is recommended in recovering programs of fragmented and degraded environments (Olmos and Boulhosa, 2000). It is a pioneer species, well adapted to poor nutrient soils and open areas, and is useful for helping the establishment of different plant species (Lorenzi, 1992).
(Random Amplified Polymorphic DNA). Regardless its limitations, the RAPD technique has been recommended by many authors due to facilities such as low cost, rapidity, little DNA demand, high potential to detect polymorphism and the fact that no previous genetic information of the species is necessary (Lacerda et al., 2002). Some pioneer long-lived species can remain in the community even after the environment has been modified by succession, depending on several ecological and evolutionary selective pressures (Ribeiro and Brown, 1999; Ribeiro et al., 2003). This seems to be the case of M. fistulifera, for which founder and persistent populations can be identified. Population ecology along successional processes is still little available in literature (Bazzaz, 1996). In general, studies have demonstrated that plants of founder populations are small and present an inferior competitive capacity when compared to persistent ones (Bazzaz, 1996; Ribeiro et al., 2003), and in the first ones, there is a higher variance in many adaptive traits (Gray, 1987; Bazzaz, 1996). Few authors have tried to demonstrate whether those populations would have a different genetic composition (Gray, 1987). Natural selection imposed by the changing environment over successional time is supposed to cause genetic differentiation between populations at different successional ages (Hartnett et al., 1987). Moreover, it is expected that founder populations would present a higher genetic diversity than the persistent ones (Gray, 1987). These differences can be caused not only by natural selection but also by the declining number of individuals in the population (Gray, 1987) or genetic drift (Hartnett et al., 1987), although there is lack of empirical evidences (Gray 1987).
In this work, genetic and ecological aspects of M. fistulifera were investigated. The aims were to analyze and correlate genetic data, morphologic traits and spatial distribution of individuals from two populations of this species, both in Rio Doce State Park (Minas Gerais, Brazil) located in areas characterized as in different successional stages.
MATERIALS AND METHODS
Study location
Rio Doce State Park (19o48’-19o29’S and 42o 38’-42o28’O) is the largest reserve of Atlantic rainforest in Minas Gerais state, with almost
36,000 ha(Stallings et al., 1991). The park has been considered an area of special biological relevance and, therefore, it is a high priority site for scientific researches in Minas Gerais (Costa et al., 1998). The Park vegetation is classified as semi-deciduous tropical rainforest (Stallings et al., 1991). Populations of M. fistulifera can be found in many places, especially along the roads and in secondary vegetation. The studied populations were sampled from “Salão Dourado” site, a constantly disturbed area along a backfire track, which was fired in the nineties, and at “Porto Capim” site, a secondary low forest type, along a local walkway, which was fired 35 years ago. The two sites are separated by around 15 km in straight line along the main axis of the Park area. A previous evaluation of the studied sites has shown that “Salão Dourado” community has less tree densities (0.2 ± 0.08 trees/m2) than in “Porto Capim” (0.3 ± 0.09 trees/m2). In addition, light availability and soil exposure patterns support “Porto Capim” plant community as more advanced in succession than those in the backfire area of “Salão Dourado” (M. F. Goulart, unpublished data).
Genetic study
Twenty randomly chosen individuals from each population were sampled. Genomic DNA was extracted from approximately 200 mg of young leaves using the cetytrimethylammonium bromide (CTAB) protocol described by Doyle and Doyle (1987), with modifications suggested by Ferreira and Grattapaglia (1996) and Lacerda et al. (2001). After visual quantification under ultraviolet light, by comparison with standard DNA concentrations, DNAs were diluted in TE buffer to a final concentration of about 5ng / ✁✂
Five 10-mer random primers from Operon Technologies Inc. were used for DNA amplification. A18, C11, C13, C18 and C19 were selected in a pilot survey as suggested by Palacios and Gonzáles-Candelas (1997) and Lacerda et al. (2001), revealing sharp and reproducible RAPD fragments.
A polymerase chain reaction (PCR) was carried out in 12 ✁ ✄☎✄✆✁ ✝ ☎ ✁
✞ ✟✠ ✡
☎☛✄✆☞☛☞☛✌ ✍✎
mM Tris (pH 8.0), 50 mM KCl, 2 mM MgCl2, 0.1 mM of
each ✏
✑✒✓ ✔ ✎✂✕ ✖ ✗ ☎✘ ✙ ✚☞ ✟✠
✚✔ ✍ ✞
following PCR conditions: an initial denaturation step of 95oC for 1 min, followed by 35 cycles each of 94oC for 10 s, 36oC for 1 min, 72oC for 2 min and a final extension step of 72oC for 7 min. The products were analyzed by electrophoresis in 1% agarose gels, made with 1x TBE buffer, stained with ethidium bromide and visualized under ultraviolet light. After a run of approximately 3 h (100 Volts) the gels were photographed for analysis. Molecular size of the fragments was estimated using a 100 pb ladder (Life Technologies). Negative controls, omitting DNA in order to verify possible contamination and positive controls containing DNA that result in good amplification, were used.
Morphological and spatial characterization
Several morphologic and architectural traits were measured from the same 40 individuals used in the genetic study. The circumference of the trunk at 1.30 m height (circumference at breast height) was measured, as well as the total height, the height of the first ramification, the height in which crown initiates and the maximum diameter of crown. The distance between each individual and its closest neighbor were measured in the field, and by drawing a diagram, the spatial distribution of the studied trees of each population were obtained.
Statistical analysis
RAPD were scored as presence (1) or absence (0) of bands and matrix of RAPD phenotypes was assembled. Only data from intensely stained unambiguous, clear bands were used for statistical analysis.
An adaptation of Shannon’s index of diversity, used to approach phenotypic diversity was estimated as suggested by Yeh et al. (1995) and Lacerda et al. (2001): Ho = -Σpi log2 pi / n where pi was the frequency of the presence or absence of the band, and n the number of markers evaluated. The index was used to quantify the degree of within-population diversity (Ho), the average diversity over both populations (Hpop) and the diversity of both populations considered together (Hsp). Therefore, it was possible to calculate the proportion of diversity within (Hpop / Hsp) and between populations [(Hsp – Hpop) / Hsp].
A pairwise Euclidian distance matrix was generated using the program AMOVA-PREP (obtained from M. P. Miller: web site http://herb.bio.nau.edu/~miller/amovaprp.htm) and
used as the input for the program WINANOVA 1.55 (http://lgb.unige.ch/software/win/amova/), used to perform an Analysis of Molecular Variance (AMOVA), partitioning the variation into within and between population components (Excoffier et al., 1992). The program was also used to perform a nonparametric test for the homogeneity of molecular variance (HOMOVA) and to obtain ✁
✄ ✝ ✆✁ ✞ ✠
✔ ✆
Fst analogue index that indicated the genetic divergence between populations (Wright, 1951). Populations were compared by traits median using the non-parametric test of Kruscal-Wallis. Principal Component Analysis (PCA) was carried out to illustrate differences among populations, using molecular data (only polymorphic bands) and morphological characteristics, also indicating possible associations among the evaluated traits. Mantel tests were conducted in order to verify possible correlation among matrix of genetic distance, morphological and spatial distance, evaluating all 40 individuals and populations separately (Sokal, 1979).
RESULTS
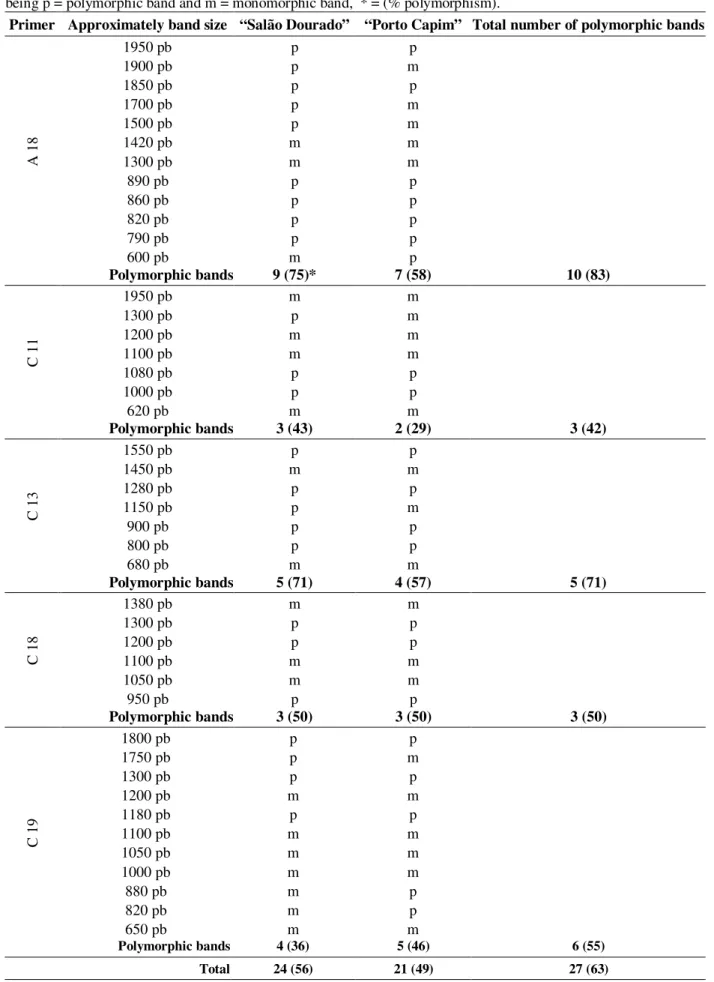
Table 1 - Characteristics of the amplification patterns obtained for individuals of two populations of M. fistulifera, being p = polymorphic band and m = monomorphic band, * = (% polymorphism).
Primer Approximately band size “Salão Dourado” “Porto Capim” Total number of polymorphic bands
1950 pb p p
1900 pb p m
1850 pb p p
1700 pb p m
1500 pb p m
1420 pb m m
1300 pb m m
890 pb p p
860 pb p p
820 pb p p
790 pb p p
A
18
600 pb m p
Polymorphic bands 9 (75)* 7 (58) 10 (83)
1950 pb m m
1300 pb p m
1200 pb m m
1100 pb m m
1080 pb p p
1000 pb p p
C
11
620 pb m m
Polymorphic bands 3 (43) 2 (29) 3 (42)
1550 pb p p
1450 pb m m
1280 pb p p
1150 pb p m
900 pb p p
800 pb p p
C
13
680 pb m m
Polymorphic bands 5 (71) 4 (57) 5 (71)
1380 pb m m
1300 pb p p
1200 pb p p
1100 pb m m
1050 pb m m
C
18
950 pb p p
Polymorphic bands 3 (50) 3 (50) 3 (50)
1800 pb p p
1750 pb p m
1300 pb p p
1200 pb m m
1180 pb p p
1100 pb m m
1050 pb m m
1000 pb m m
880 pb m p
820 pb m p
C
19
650 pb m m
Polymorphic bands 4 (36) 5 (46) 6 (55)
Nevertheless, AMOVA demonstrated statistic significance for ✂st value (P<0.001), showing that the studied populations differed genetically in spite of high variability within population.
Shannon’s index of within population diversity was 0.41 for “Salão Dourado” and 0.38 for “Porto Capim”. The index estimations showed some variation between primers (Table 2), also reported by other authors (Lacerda et al., 2001).
For AMOVA, the variance within population was not significantly different between “Porto Capim” and “Salão Dourado” (molecular homogeneity test; Bp = 0.00015, P > 0.05).
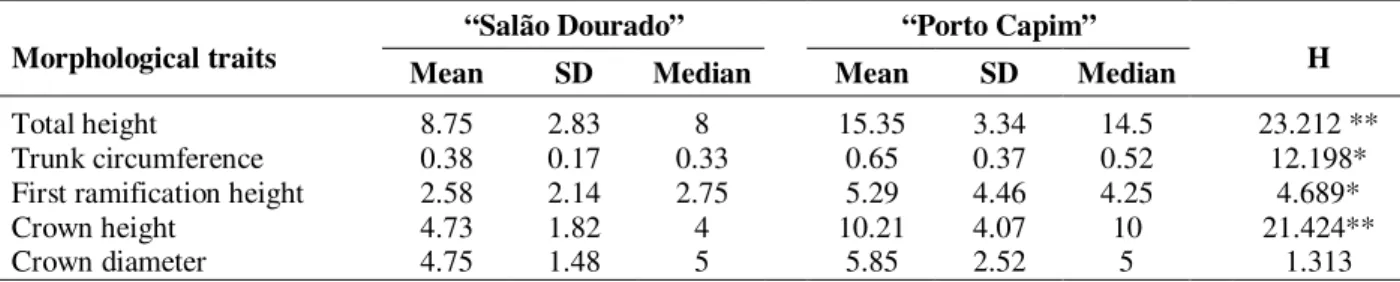
Morphologic data revealed that M. fistulifera individuals from “Porto Capim” were in average almost two times bigger than those from “Salão Dourado”. The evaluated traits differed among populations (P<0.05), except the maximum diameter of crown (Table 4).
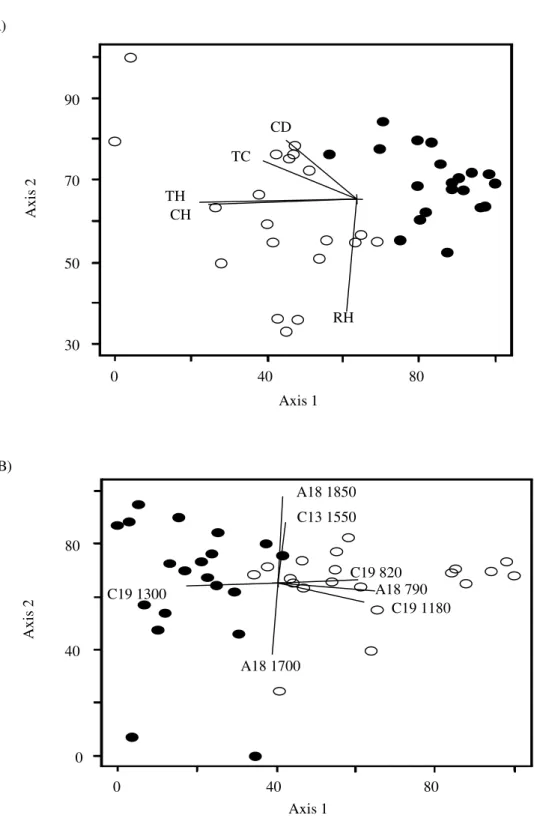
Spatial distribution of M. fistulifera trees showed that population density was higher in “Salão Dourado” (0.10 ± 0.05 trees/m2) than in “Porto Capim” (0.05 ± 0.02 trees/ m2), with mean distance between the individuals as 58 m in the former and as 98 m in the latter population. Principal Component Analysis (PCAs) showed that morphological traits were more efficient in discriminating the populations, i.e. grouping individuals of the same locality, than genetic parameters (Figs 1a and 1b). For morphological data, the first two factors explained about 83% of the total variation, while for RAPD only 25% of the variation could be explained. Moreover, the diagram illustrated some trait associations, for example, total height and crown height, as well as trunk circumference and crown diameter.
Table 2 - Estimates of Shannon’s index for individuals of M. fistulifera. Data shows phenotypic diversity (Ho), populations average diversity (Hpop), diversity considering both populations (Hsp), proportion of diversity within (Hpop / Hsp) and between populations [(Hsp – Hpop) / Hsp].
Primer “Salão Dourado” (Ho) “Porto Capim” (Ho) Hpop Hsp Hpop/Hsp (Hsp-Hpop)/Hsp
A18 0.552 0.436 0.494 0.549 0.901 0.099
C11 0.345 0.180 0.262 0.296 0.886 0.114
C13 0.528 0.471 0.500 0.511 0.978 0.022
C18 0.441 0.490 0.466 0.477 0.976 0.024
C19 0.158 0.340 0.249 0.297 0.838 0.162
Mean 0.405 0.383 0.394 0.426 0.916 0.084
Table 3 - Analysis of Molecular Variance (AMOVA) for individuals of M. fistulifera. The data show the degrees of freedom (df), sum of squares deviation (SSD), means square deviation (MSD), variance component estimates, the percentage of total variance contributed by each component (% Total) and the probability of obtaining a more extreme component estimate by chance alone (P value).
Source of variation df SSD MSD Variance component % Total P value
Among population 1 12.225 12.225 0.406 8.97 < 0.001
Within population 3 8 156.350 4.114 4.115 91.03
Table 4 - Morphological traits of individuals from two populations of M. fistulifera. Data shows means, standard deviation (SD) and median values, in meters, and also the results of Kruscal-Wallis tests (H), revealing whether medians differ among populations (* P < 0.05, ** P < 0.001).
“Salão Dourado” “Porto Capim”
Morphological traits
Mean SD Median Mean SD Median H
Total height 8.75 2.83 8 15.35 3.34 14.5 23.212 **
Trunk circumference 0.38 0.17 0.33 0.65 0.37 0.52 12.198*
First ramification height 2.58 2.14 2.75 5.29 4.46 4.25 4.689*
Crown height 4.73 1.82 4 10.21 4.07 10 21.424**
Figure 1 - Diagrams of Principal Component Analysis. Black circles represent individuals of M.
fistulifera from “Salão Dourado” and white circles the ones from “Porto Capim”. In A only morphological traits are considered (CD = crown diameter, TC = trunk circumference, TH = total height, CH = crown height, RH = first ramification height) and in B only genetic data, based on 28 polymorphic RAPD markers, but only the ones exhibiting r2 > 0.4 are shown.
TH
TC
RH CH
CD
0 30
40 80
50 70 90
Axis 1
A
x
is
2
A)
A18 1850
A18 1700
A18 790 C13 1550
C19 1300
C19 1180 C19 820
0 0
40 80
40 80
Axis 1
A
x
is
2
Table 5 - Mantel tests for individuals of M. fistulifera from two populations. Data show R value and tests significance (*P < 0.05, **P < 0.001) when compared matrix of genetic, morphological and spatial distance, in pairs.
Distances Both populations “Porto Capim” “Salão Dourado”
Genetic x spatial 0.170 ** 0.270 * 0.206 *
Genetic x morphological 0.279 ** 0.158 0.090
Morphological x spatial 0.368 ** 0.049 -0.132
Tests of Mantel demonstrated correlation (P<0.05) among matrix of genetic and geographic distance, genetic and morphologic distance and geographic and morphologic distance, when all the 40 individuals were evaluated (Table 5). However, when individuals were evaluated inside populations, only a correlation between genetic and geographic distance was found, revealing that spatially-closer individuals tended to be more similar genetically, even inside the same population.
DISCUSSION
The breeding system is a characteristic of plants life history highly associated with genetic variability within populations. In general, a higher within-population diversity is found in outcrossing than in selfing species (Hamrick and Godt, 1989; Nybom and Bartish, 2000). For this reason, it would be expected a high genetic diversity for individuals within populations of M. fistulifera, as it shows self-incompatibility system (Vieira and Carvalho-Okano, 1996). In fact, our data showed comparatively higher values of genetic diversity within population when compared with other tree species (Lacerda et al., 2001). Mabea fistulifera showed intra-population diversity even higher than others obligatory crossing tropical tree species, such as Hymenaea courbarial and H. stigonocarpa that were evaluated using the same methodology described here and showed average diversity over populations of 0.301 and 0.321 (Hpop Shannon’s index), respectively (Brandão, 2002). AMOVA values of within-population diversity should be used for comparison only under special care, as the estimations depend on the number of evaluated markers. It was noticed that as the number of evaluated markers increased values of variance observed were also higher (personal observation). Despite that most of genetic variation in M. fistulifera was located inside populations, a significant variation could be verified among the
populations (✂st= 0.09). According to Wright (1951), values Fst between 0.05 and 0.15 indicated
a moderate genetic variation between populations. In comparison to values reported in a review from RAPD data made by Nybom and Bartish (2000), population genetic divergence in M. fistulifera was lower than it would be expected, considering its regional geographic range (✂st= 0.43, n= 27), early successional status (✂st= 0.45, n= 20), perennial life form (✂st= 0.39, n= 32) and outcrossing breeding system (✂st= 0.28, n= 46). Probably, this could be explained by the geographic proximity of the studied populations (about 15 km) that would have allowed some gene flow among them, reducing its genetic divergence. Nybom and Bartish (2000) reported that in outcrossing species, genetic differentiation between populations (✂st) was positively correlated with geographic distance between them. Moreover, usually lower population differentiation was reported, whereas in their review differentiation was more expressed. This apparent contradiction should be consequence of sampling strategies: while they had widely spaced sites, most works, including this one, studied closer populations.
promote gene flow between them (Howe and Westley, 1997). In the present case, many other populations of M. fistulifera were found in disturbed borders of the Park, between the two studied sites, which could be used as stepping stones by pollinators searching for its flowers. Considering that large moths and bats are amongst the usual pollinators of this plant (Vieira and Carvalho-Okano, 1996), and that these are wide distance flyers, a reasonable gene flow could be expected between the studied populations.
Although there was not a great genetic divergence between the studied populations, there were evidences that they differed on individuals morphologic traits. In general, pioneer species architecture is known to be simple, with fast elongation of the trunk and not many ramifications (Hubbel and Foster, 1986). However, Fontes (1999) demonstrated that pioneer tree species could show variable architectural patterns; some invest in growth and height, others can invest in trunk diameter and crown volume. Moreover, some divergences can be found within the same species as phenotypic differences are expected in plant populations under different selective pressures (Wen and Hsiao, 1999). In M. fistulifera, the population morphologic patterns were in accordance with Hallé et al. (1978) who reported lower crown and more ramified branches in trees growing in open areas, and longer trunk in trees growing in shade areas. Such patterns could be due to phenotypic plasticity or genetic divergence. Mantel tests showed a correlation between genetic and morphologic distances, but data are circumstantial and not conclusive yet.
Wright (1946) proposed the model of isolation by distance, considering that populations geographically closer would have more genetic similarities than the ones more distant from each other. Nybom and Bartish (2000) confirmed this pattern reviewing studies that used RAPD markers. However, not many authors studied this fact from individuals perspective, evaluating genetically substructured populations. Franceschinelli and Kesseli (1999) evaluated a population of the pioneer shrub, Helicteres brevispira (Sterculiaceae) and, although they concluded that it was genetically substructured, data did not fit for isolation by distance model. However, for M. fistulifera the model seemed to fit, as Mantel test demonstrated that closer individuals were more similar genetically than
distant ones. In this case, substructure should be a consequence of low efficiency in seed dispersion. Morphological data reveled that individuals in “Porto Capim” were significantly larger than the ones from “Salão Dourado”. Considering the first population as persistent and the second as founder, this result was in accordance to Hartnett et al. (1987) and Bazzaz (1996). The fact that a genetic divergence could be detected among the analyzed populations, does not disagree with the hypothesis that founder and persistent populations differ in genetic composition (Gray, 1987), although this differentiation could be due to other factors besides successional stages. In the same way, it is also proposed that founder populations could show a greater diversity than persistent ones due to a possible increase in directional selective forces along succession (Gray, 1987). The studied populations showed similar genetic variation levels, suggesting that selective forces did not increase with succession or that the effect of directional selection could be neutralized by gene flow among populations of distinct successional stages. It could also be possible that genetic differences between M. fistulifera populations were not due to natural selection, since RAPD markers have been generally reported to be neutral (Brunell and Whitkus, 1997; Heaton et al., 1999), and in this case, differences among populations would be caused by genetic drift.
ACKNOWLEDGMENTS
RESUMO
Duas populações de Mabea fistulifera (Euphorbiaceae) localizadas no Parque Estadual do Rio Doce (Minas Gerais, Brasil), mas em locais caracterizados como em diferentes estágios sucessionais, foram investigadas quanto a parâmetros genéticos e ecológicos. Em cada população, 20 indivíduos escolhidos de forma aleatória, foram avaliados quanto à presença de 43 marcadores RAPD, cinco características morfológicas e quanto à distribuição espacial. O índice de Shannon e a AMOVA revelaram que a maior parte da variação genética está localizada entre indivíduos dentro das populações, com apenas cerca de 9% da variação entre populações. As populações diferem geneticamente, mas possuem valores similares de diversidade genética. Os dados morfológicos revelaram marcantes diferenças entre as populações. Foram obtidas correlações significativas entre matrizes de distâncias genéticas, geográficas e morfológicas, considerando-se ambas as populações. Os dados revelaram ainda que dentro de uma mesma população, indivíduos espacialmente mais próximos tendem a ser mais semelhantes geneticamente. Os resultados são discutidos a respeito da biologia da espécie e das características das populações.
REFERENCES
Bazzaz, F. A. (1996), Plants in Changing Environment:
linking physiological, population and community ecology. Cambridge : Cambrigde University Press. Brandão, R. L. (2002), Variabilidade e estrutura
genética de duas espécies vicariantes, Hymenaea courbaril (jatobá da mata) e H. stigonocarpa (jatobá
do cerrado). Master Dissertation, Universidade Federal de Minas Gerais, Belo Horizonte.
Brunell, M. S. and Whitkus, R. (1997), RAPD marker variation in Eriastrum densifolium (Polemoniaceae): implications for subspecific delimitation and conservation. Syst. Bot.,22, 543-553.
Costa, M. R. C.; Herrmann, G.; Martins, C. S.; Lins, L. V. and Lamas, I. R. (1998), Biodiversidade em Minas Gerais: um atlas para sua conservação. Belo Horizonte : Fundação Biodiversitas.
Doyle, J. J. and Doyle, J. L. (1987), Isolation of plant DNA from fresh tissue. Focus, 12, 13-15.
Excoffier, L.; Smouse, P. E. and Quattro, J. M. (1992) Analysis of molecular variance inferred from metric distances among DNA haplotypes: application to human mitochondrial DNA restriction data. Genetics,
131, 479-491.
Ferrari, S. F. and Strier, K. (1992), Explotation of
Mabea fistulifera nectar by marmosets (Callithrix
flaviceps) and muriquis (Brachyteles arachnoides) in south-east Brazil. J. Trop. Ecol., 8, 225-239.
Ferreira, M. E. and Grattaplaglia, D. (1996), Introdução ao uso de marcadores moleculares em análise genética. Brasília : EMBRAPA-CENARGEM. Fontes, M. A. L. (1999), Padrões alométricos em
espécies pioneiras tropicais. Sci. For., 55, 79-87. Franceschinelli, E. V. and Kesseli, R.(1999), Population
structure and gene flow of the Brazilian strub
Helicteres brevispira.Heredity, 82, 355-363.
Gray, A. J. (1987), Genetic changes during sucession in plats. In: Gray, A. J.; Crawley, M. J. and Edwards, P. J. (Eds.). Colonization, Sucession and Stability. Oxford : Symposium of the British Ecological Society. pp. 273-293.
Hallé, F.; Oldeman, R. A. A. and Tomlinson, P. B. (1978), Tropical trees architecturalanalysis. Berlin : Springer-Verlag.
Hamrik, J. L. and Godt, M. J. W. (1989), Allozyme diversity in plant species. In: Brow, H. D.; Clegg, M. T.; Kahler, A. L. and Weir, B. S. (Eds.). Plant Population Genetics, Breeding and Genetic
Resources. Massachusetts : Sinauer Associates Inc. Publishes Sunderland. pp. 43-36.
Hartnett, D. C.; Hartnett, B. B. and Bazzaz, F. A. (1987), Persisitence of Ambrosia trifida populations in old fields and responses to successional changes.
Am. J. Bot., 74, 1239-1248.
Heaton, H. J.; Whitkus, R. and Gómes-Pompa, A. (1999), Extreme ecological and phenotypic differences in the tropical tree chicozapole (Manilkara zapota (L.) R. Royen) are not matched by the genetic divergence: a random amplified polymorphic DNA (RAPD) analysis. Mol. Ecol.,
8, 627-632.
Howe, H. F. and Smallwood, J. (1982), Ecology of seed dispersal. Ann. Rev. Ecol. Syst., 13, 201-228.
Howe, H. F. and Westley, L. C. (2000), Ecology of pollination and seed dispersal. In: Crawley, M. J. (Ed.).
Plant Ecology. Oxford : Blakwell Science. pp. 262-282. Hubbel, S. P. and Foster, R. B. (1986), Canopy gaps and the dynamics of a neotropical forest. In:Crawley, M. J. (Ed.). Plant Ecology. Oxford : Blakwell Science. pp. 262-282.
Lacerda, D. R., Acedo, M. D. P., Lemos Filho, J. P. and Lovato, M. B. (2002), A técnica de RAPD: uma ferramenta molecular em estudos de conservação de plantas. Lundiana,3 : (2), 87-92.
Lorenzi, H. (1992), Árvores Brasileiras: manual de
identificação e cultivo de plantas arbóreas do Brasil. Instituto Plantarum de Estudos da Flora Ltda, Nova Odessa.
Martinez, G. M.; Jimenez, R. J. and Cruz, D. R. (2000), El genero Mabea (Euphorbiaceae) en Mexico. Anales
del Instituto de Biología - UNAM, serie botánica, 71 : (2), 87-95.
Newton, A. C.; Allnutt, T. R.; Gillies, A. C. M.; Lowe, A. J. and Ennos, R. A. (1999), Molecular phylogeography, intraespecific variation and the conservation of tree species. Trends Ecol. Evolut.,
14 : (4), 140-145.
Nybom, H. and Bartish, I. V. (2000), Effects of life history traits and sampling strategies on genetic diversity estimates obtained with RAPD markers in plants. Perspectives in Plant Ecology, Evolution and
Systematics, 3/2, 93-144.
Olmos, F. and Boulhosa, R. L. P. (2000), A meeting of opportunists: birds and other visitors to Mabea fistulifera (Euphorbiaceae) inflorescences. Ararajuba,
8 : (2), 93-98.
Palacios, C. and Gonzáles-Candelas, F. (1997), Analysis of population genetics structure and variability using RAPD markes in the endemic and endagered Limonium dufourii (Plumbaginaceae).
Mol. Ecol., 6, 1107-1121.
Regal, J. P. (1982), Pollination by wind and animals: ecology and geographic patterns. Ann. Rev. Ecol.
Syst., 13, 497-524.
Ribeiro, S. P. and Brown, V. K. (1999), Insect herbivory in tree crowns of Tabebuia aurea and T. ochracea (Bignoniaceae): contrasting the Brazilian cerrado with the wetland "Pantanal Matogrossense".
Selbyana, 20 : (1), 159-170.
Ribeiro, S. P., Borges, P. A. V. and Gaspar, C. S. (2003), Ecology and evolution of the arborescent Erica azorica Hochst (Ericaceae). Arquipélago – Agricultural and
Environmental Science, 1 : (1), 41-50.
Sokal, R. R. (1979), Testing statistical significance of geograpjhic variation patterns. Syst. Zool., 28, 227-232. Stallings, J. R.; Fonseca, G. A. B.; Pinto, L. P. S., Aguiar, L. M. S. and Sábato, E. L. (1991), Mamíferos do Parque Estadual do Rio Doce, Minas Gerais, Brasil. Rev. Bras. Zoo., 7 : (4), 663-677.
Torres de Assumpção, C. (1981), Cebus apella and
Brachyteles arachnoides (Cebidae) as potencial pollinators of Mabea fistulifera (Euphorbiaceae). J. Mammal., 62, 386-388.
Vieira, M. F. and Carvalho-Okano, R. M. (1996), Pollination biology of Mabea fistulifera (Euphorbiaceae) in southern Brazil. Biotropica,
28, 61-38.
Vieira, M. F.; Carvalho-Okano, R. M. and Sazima, M. (1991), The common opossum, Didelphis
marsupialis, as a pollinator of Mabea fistulifera. (Euphorbiaceae). Cien. Cult., 43, 390-393.
Wen, C. and Hsiao, J. (1999), Genetic differentiation of
Lilium longiflorum Thumb. Var. scabrum Masam. (Liliaceae) in Taiwan using random amplified polymorphic DNA and morphological chacaters. Bot.
Bull. Acad. Sin., 40, 65-71.
Wright, S. (1946), Isolation by distance under diverse systems of mating. Genetics, 31, 39-59.
Wright, S. (1951), The genetical structure of populations. Annals of Eugenics, 15, 323-354. Yeh, F. C.; Chong, D. K. X. and Yang, R. C. (1995),
RAPD variation witrhin and among natural populations of trembling aspen (Populus tremuloides
Michx.) from Alberta. J. Here.,86, 45460.