ISSN 1516-8913 Printed in Brazil
BRAZILIAN ARCHIVES OF
BIOLOGY AND TECHNOLOGY
A N I N T E R N A T I O N A L J O U R N A L
Random Amplified Polymorphisms Between Two South
American Subspecies of Rattlesnakes (
Crotalus durissus
collilineatus
and
Crotalus durissus terrificus
)
Sergio Echeverrigaray
1*; Gilberto Grazziotin; Felipe Grazziotin and Gustavo Agostini
Departamento de Ciências Biológicas, Universidade de Caxias do Sul, CP 3152, CEP 95001970, Caxias do Sul -RS, BrazilABSTRACT
The present work was made to determine the suitability of RAPD analysis for the identification of specimens of two subspecies of South American rattlesnakes (Crotalus durissus terrificus and Crotalus durissus collilineatus). The 11 arbitrary primer sequence tested amplified a total of 161 bands, of which 31% were polymorphics when compared with Crotalus specimens. The combining results from different primers allowed the identification of all the specimens under analysis. Several characteristic bands of each subspecies were identified. Dendrogram, based on RAPD markers, show three groups that corresponded to the subspecies of Crotalus, and to Bothrops jararaca specimen.
Key words: Rattlesnake, RAPD, genetic variability, molecular markers
*
Author for correspondence
INTRODUCTION
The snakes of the genus Crotalus originated in North America migrated to Central and South America. Central and South American rattlesnakes are classified as a single species, Crotalus durissus, which is separated by several authors into various subspecies (Campbell and Lamar, 1989). Based on the geographical distribution and several morphological traits such as the pattern of longitudinal bands on the neck, the presence of more or less contrasting rhomboid blotches, the shape and intensity of paravertebral nuchal stripes and the presence of loreal scales, Peter and Oreja-Miranda (1970) separated Crotalus durissus in the following subspecies: C.d. durissus, C.d. terrificus, C.d. unicolor, C.d. collilineatus, C.d. cascavela,
C.d. ruraima, C.d. dryinus, C.d. tzabcan, C.d. marajoensis and C.d. cumanensis.
The separation of Crotalus durissus into different subspecies raises a conceptual argument, since it is difficult to guarantee the existence of these subspecies based on a few morphological characters, most of which exhibit a large variation within each group (Santos and Laporta Ferreira, 1992). Nevertheless, the comparative analysis of venom composition has confirmed the existence of at least two subspecies, C.d. durissus and C.d. terrificus, and several groups within the last one (Barrio, 1960).
and C.d.terrificus, spread over the south of Brazil, Argentina and Uruguay (Hoge, 1965; Hoge and Romano-Hoge, 1979; Campbell and Lamar, 1989). The last two subspecies have a sympatric region distribution on southeast Brazil.
The molecular approaches utilizing genomic DNA have revolutionized the studies of ecology, evolution, population genetics and systematics. Identification of restriction fragment length polymorphisms (RFLP), DNA sequence disparities, DNA fingerprintings, and random amplified polymorphic DNA (RAPD) have been used to distinguish among individuals, populations, species and higher taxa, ant to evaluate phylogenetic relationships in plants, animals and microorganisms (Burke and Bruford, 1987, Parker and Whiteman, 1993, Master, 1995). In an attempt to better characterized two subspecies of Crotalus durissus:
C. d. terrificus and C. d. collilineatus, we investigated molecular differences between individuals of both subspecies, based on random amplified polymorphic DNA markers.
MATERIALS AND METHODS
Eight adult snakes were used in the present study. Three were representatives of C. d. collilineatus
from central Brazil (Goias and Mato Grosso states), four were representatives of C. d. terrificus
from south Brazil (Rio Grande do Sul state), and one representative of Bothrops jararaca, used as a pattern of intergeneric variation. All the animals were collected in different locations. All this individuals are part of the collection of the Museum of Natural Sciences of the University of Caxias do Sul.
Blood samples from each individual, collected by the cardiac puncture method described by Branch (1973), were stored at –20ºC prior to DNA purification. Total DNA was extracted according to procedures adapted from Hillel et al. (1989). A 0.1ml blood aliquot was mixed with 0.4ml of 1xSSC and homogenated with an equal volume of phenol:chloroform:isoamyl alcohol (50:48:2). The suspension was centrifuged at 13000xg for five minutes at 4ºC. The layer was transferred to a clean tube and subjected to a second extraction by the addition of an equal volume of
chloroform:isoamyl alcohol (24:1) followed by mixing and centrifugation as described above. The DNA present in the aqueous layer was precipitated by the addition of two volume of ethanol (-20ºC), followed by at least one hour incubation at –20ºC. The DNA was pelleted by centrifugation at 13000xg for five minutes at 4ºC, air dried at room temperature and dissolved in 400µl of TE (pH8.0). The DNA was precipitated again by the addition of 4µl of %M sodium acetate and 1ml of ethanol (-20ºC), pelleted by centrifugation at 13000xg for five minutes at 4ºC, air dried and dissolved in 50µl of TE. DNA concentration and purity was measured by spectrophotometry at A260 and A280. The extracted
DNAs were stored at –20ºC until used for DNA amplification.
DNA amplifications were carried out in an MJ Research, Inc. MiniCycler using the method described by Williams et al. (1993). The amount of template DNA was of 100ng per reaction. Taq DNA polymerase was obtained from Pharmacia Co. Primers were obtained from Operon Technologies, Inc. In the course of the study, 60 primers of the kits OPB, OPX and OPY were evaluated. Each RAPD amplification was prepared at least three times to determine reproducibility of the patterns. Amplification products were electrophoresed through 1.5% agarose gels in 1xTBE, stained with ethidium bromide and visualized under UV light.
Amplification products were listed as discrete character states per strain (present/absent). These data were analyzed using the NTSYS-pc (Numerical Taxonomy and Multivariate Analysis System) package, version 1.5 (Rohlf, 1989) to determine the similarities among the individuals. Similarities were computed using the Jaccard´s coefficient. The individuals were clustered by the unweighted pair-group method using arithmetic averages (UPGMA) in order to present the results in the form of a phenogram.
RESULTS AND DISCUSSION
fragment was judged to be scorable if it was intense enough and different enough in size from neighboring bands to be scored with confidence, as well as being reproducible from experiment to experiment. From these 18 primers, 11 generated reproducible markers with some degree of variability between the individuals. The other seven primers generated markers that were highly
conserved among the Crotalus specimens
examined.
The selected primers (Table 1) generated a total of 161 scorable amplification products that were analyzed and used as variables in our analysis. The variation between Crotalus and Bothrops was higher than the variation between the two subspecies of Crotalus durissus (Fig.1 and Fig.2). Of the selected bands, 83.9% were polymorphics
between Crotalus and Bothrops, what was
expected when comparing different genera.
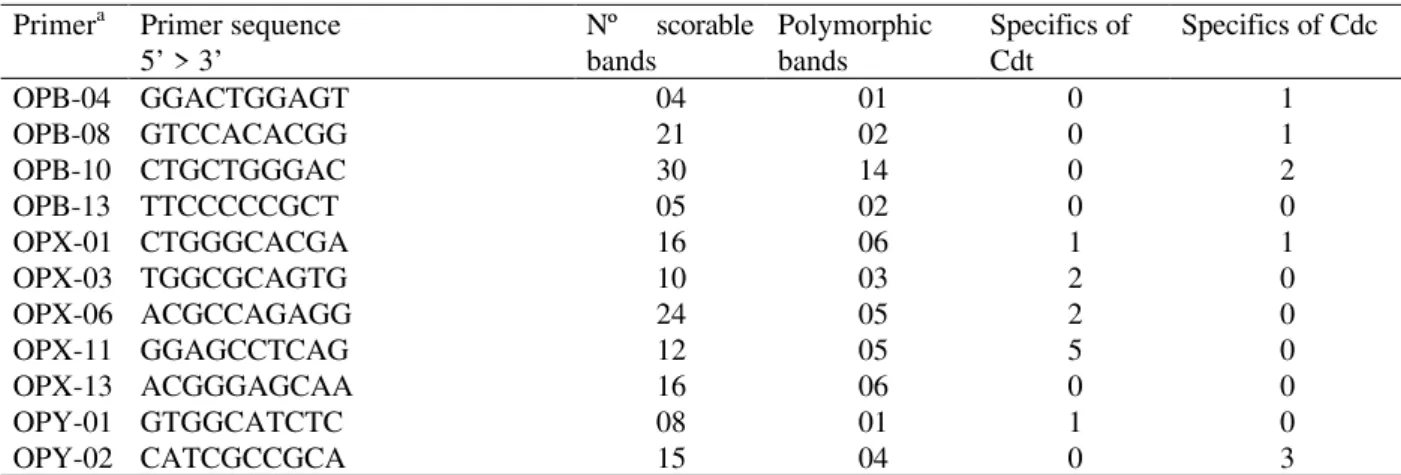
Table 1 - Primers identification and corresponding number of scorable, polymorphic and specific bands, amplified form rattlesnake DNA. (Cdt – C. d. terrificus, Cdc- C. d. collilineatus)
Primera Primer sequence 5’ > 3’
Nº scorable bands
Polymorphic bands
Specifics of Cdt
Specifics of Cdc
OPB-04 GGACTGGAGT 04 01 0 1
OPB-08 GTCCACACGG 21 02 0 1
OPB-10 CTGCTGGGAC 30 14 0 2
OPB-13 TTCCCCCGCT 05 02 0 0
OPX-01 CTGGGCACGA 16 06 1 1
OPX-03 TGGCGCAGTG 10 03 2 0
OPX-06 ACGCCAGAGG 24 05 2 0
OPX-11 GGAGCCTCAG 12 05 5 0
OPX-13 ACGGGAGCAA 16 06 0 0
OPY-01 GTGGCATCTC 08 01 1 0
OPY-02 CATCGCCGCA 15 04 0 3
a Primer designation refers to the kit (last letter) and the specific primer (number) purchase form Operon Techn.
Conversely, only 50 bands (31%) were polymorphics when comparing the seven specimens of Crotalus. From these, 31 bands showed a random polymorphism distribution among the individuals of both subspecies allowing for the identification of all the specimensThese band patterns could be useful in population studies, but were not able to discriminate between the subspecies. The remaining 19 bands (38%) of the polymorphic bands between Crotalus specimens were specifics of each subspecies. Eight bands were
present only in the four specimens of C. d. collilineatus, and 11 were specific of C.d. terrificus. One of these specific bands can be observed in Figure 1.
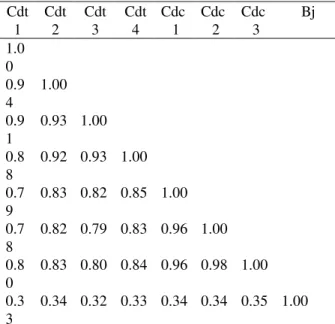
The 161 RAPD fragments were used to calculate similarity values and to estimate the relatedness among the specimens. As can be observed in Table 2, the similarity between individuals of the same subspecies ranged from 0.98 and 0.87. These values were very high when compared with the interespecific variation obtained in other organisms
(Ferreira and Grattapaglia, 1996). This results supported their separation in sub-species.
4-6, specimens of C.d. collilineatus, lane 7, a specimen of B. jararaca, and lane 8, DNA size standard (λ/EcoRI-HindIII fragments).
Table 2 - Distance matrix between each of eight specimens of snakes, based on their RAPD profiles. Cdt – C. d. terrificus, Cdc- C. d. collilineatus,
Bj-Bothrops jararaca.
Cdt 1
Cdt 2
Cdt 3
Cdt 4
Cdc 1
Cdc 2
Cdc 3
Bj
1.0 0 0.9 4
1.00
0.9 1
0.93 1.00
0.8 8
0.92 0.93 1.00
0.7 9
0.83 0.82 0.85 1.00
0.7 8
0.82 0.79 0.83 0.96 1.00
0.8 0
0.83 0.80 0.84 0.96 0.98 1.00
0.3 3
0.34 0.32 0.33 0.34 0.34 0.35 1.00
The similarity between individuals of C.d.
terrificus and C.d. collilineatus ranged from 0.78 and 0.85. These values were slightly lower than those obtained between individuals of the same subspecies, allowing separating them in two populations. The similarity values between
Crotalus and Bothrops were of the order of 0.33.
Figure 2- Similarity tree based on the shared bands in pairwise comparisons using UPGMA and Jaccard`s
distances. Cdt – C. d. terrificus, Cdc- C. d. collilineatus, Bj- Bothrops jararaca.
The similarity matrix was used to generate a phenogram (Figure 2). Expectedly, Crotalus and
Bothrops were clustered in different groups with low relation between them. The phylogenetic tree showed that the Crotalus specimens clearly form two separate groups that corresponded to the two subspecies studied in this work. The lowest similarity among individuals of each group was 92%, while the similarity between groups was 81%.
Considering that each specimen represented a different genetic pool and, as a whole, they gave a good estimative of the genetic variability of each
subspecies, the present data supported the
separation of C. durissus, into C.d. terrificus and
C.d. collilineatus. Moreover, this molecular markers would be useful to confirm the crosses between the two subspecies in the sympathric region (São Paulo state), reported by Hoge (1965) and Santos and Laporta Ferreira (1992), and to evaluate the gene flow between them.
ACKNOWLEDGEMENTS
We thanks the University of Caxias do Sul for the financial support of this work, and FAPERGS and CNPq for the scholarships of G. Agostini and F. Grazziotin, respectively
.
RESUMO
obtidos com as distintas sequências inicializadoras, permitiram a identificação de todos os indivíduos avaliados. Várias bandas características de cada sub-espécie foram identificadas. O dendrogama, baseado em marcaodres de RAPD, mostra tres grupos que correspondem às duas sub-espécies de
Crotalus e ao especimen de Bothrops jararaca.
REFERENCES
Barrio, A. (1960), Consideraciones en torno a Crotalus durissus terrificus crotaminicus Moura Gonçalves.
Physis (Buenos Aires) 22, 141-147
Branch, B. (1973), The collection of blood by cardiac puncture from surgically anesthetized snakes. J. Herp. Assoc. Africa. 11, 5-6
Burke, T. and M. W. Bruford (1987), DNA fingerpinting of birds. Nature. 327, 149-152
Campbell, J. A and W. W. Lamar (1989). The venomous reptiles of Latin America. Cornell Univ. Press, Ithaca, N.Y., 425
Duellmann, W. E. (1979), The South American herpetofauna: its origin, evolution and dispersal. W.E. Wuellmann, Ed., Monogr. Mus. Nat. Hist., Univ. Kansas, nº 7.
Ferreira, M. E., and D. Grattapaglia. (1996), Introdução ao uso de marcadores moleculares em análise genética. 2 ed. EMBRAPA-CENARGEM,
Hillel, J., T. Schaap, A Haberfield, A J Jeffrey, Y. Plotzky, A Cahaner and U. Lavi. (1989), DNA fingerprinting of poultry. Animal Genetics20, 25-35 Hoge, A. R. (1965), Preliminary account on
Neotropical Crotalinae (Serpentes, Viperidae). Mem. Inst. Butantan. 32, 109-184
Hoge, A. R. and S. A. R. W. D. L. Romano-Hoge (1979), Sinopse das serpentes peçonhentas do Brasil. Mem. Inst. Butantan. 42/43, 373-496
Master, B. S. (1995), The use of RAPD markers for species identification in demognathine salamanders. Herpetol. Ver. 26, 92-95
Peters, J. A and B. Oreja-Miranda (1970), Catalogue of the Neotropical Squamata: Part I. Snakes. Bull. U.S.
Natl. Mus. 297, 1-347
Rohlf, F. J. (1989), NTSYS-pc numerical taxonomy and multivariate analysis system, version 1.70. Exeter Software, Setauket, N.Y.
Santos, S. and I. L. Laporta Ferreira. (1992), Discriminação geográfica de Crotalus durissus terrificus and Crotalus durissus collilineatus no Estado de São Paulo. Res. Congr. Latino-Americano de Zoologia, Belém, PA, Brasil, 123.
Williams, J. G. K.; J. A. Rafalski and S. V. Tingey. 1993. Genetic analysis using RAPD markers. Methods Enzymol. 218, 704-740