Vol. 44, N. 2 : pp. 173 – 178, June, 2001
ISSN 1516-8913 Printed in Brazil BRAZILIAN ARCHIVES OF
BIOLOGY AND TECHNOLOGY
A N I N T E R N A T I O N A L J O U R N A L
Selection for Grain Yield and Quality in Segregating
Generations of Wheat
Alessandro Ramos de Andrade
1,
Carlos Roberto Riede
2*, Maria Brígida dos Santos
Scholz
2, Deonisio Destro
1and Ines Cristina de Batista Fonseca
11Departamento de Agronomia da Universidade Estadual de Londrina (UEL), C. P. 6.001, CEP 86051-990
Londrina-PR, Brazil; 2Áreas de Melhoramento e Genética Vegetal e Ecofisiologia do Instituto Agronômico do
Paraná (IAPAR), C. P. 481, CEP 86001-970 Londrina-PR, Brazil
ABSTRACT
The objective of the work was to combine simultaneous selection for grain yield and technological quality in elite segregating populations of wheat developed by the breeding program of IAPAR. Thirteen populations were chosen according to their potentiality of genetic variability in the F2 generation of the 1997 crop season. One hundred
heads were selected from each population and sown as F3 head-rows in the following season. Visual selection of
individual head-rows or lines was done for yield potential and maturity. Seeds of the selected lines were evaluated for Sedimentation Values as well as Protein Content. The populations were identified as C1 to C13, representing the different crosses. The number of F2:3 lines selected within populations varied from one to 12. The populations C6,
C7, C9, and C13 were classified as early maturity. Two populations (C6 and C9) presented higher potential for grain yield. The populations C12, C3, C8, and C1 were better for mean and variance of sedimentation values. The populations C2, C3 and C11 had a good performance for mean, maximum values and variance of protein content. The data indicates a good potential to obtain advanced lines with higher grain yield associated with a better technological quality.
Key words: Triticum aestivum, technological quality, grain yield, segregating generations
INTRODUCTION
The sectors involved in the production, trading and
industrializaton of wheat (Triticum aestivum L.)
are interested in several aspects of its quality. The need of quality wheat grain that fulfills the requirements of the industry, and the fact of Brazil not being self sufficient in production, increases the demands of breeding programs which can obtain improved cultivars with better grain quality associated with higher grain yield.
The purchase of wheat by the milling industry considers aspects of technological quality such as general gluten strength, which can be measured by
different methodologies, allied to the fact of the grain not being affected by pre-harvest sprouting caused by excessive precipitation after grain maturation. The rain during the harvest operation
stimulates the activity of the enzyme α-amilase,
which initiates the starch degradation, reducing the possibility of baking bread and other products (Guarienti, 1996).
performed by Peña et al (1990), to find associations of quality characteristics and the presence of 1B/1R translocation wheats, indicating the exchange of chromosome segments between wheat and rye which normally reduces the overall wheat technological quality.
Many quality traits although affected by environmental factors, are under genetic control, which allows manipulation and selection by the breeders (Lukow & McVetty, 1991). The technological quality of wheat grain presents a strong relation with the total protein content, which by its turn is responsible for other physical parameters of the industrial processing of wheat
(Preston et al, 1995). The selection for the
improvement of several simultaneous traits in autogamous plants is a difficult task, considering the complexity of the genetic basis involved, the need of large size populations for selection, the need of several recombination cycles and the difficulty of environmental control that can interfere with the phenotypic expression of the traits. Considering all the above, the genetic progress obtained with the selection of a unique individual with all the desired traits becomes a very hard task for the plant breeders. It becomes important to develop systems to conduct segregating populations, which increases the efficiency of better genotypes identification (Jensen, 1988).
According to Allard (1960), the selection systems, which have shown efficiency in self-polinated crops can be grouped in pure-line and mass selection. These systems are usually used combined with different breeding methods namely: pedigree method in which individual selections are made until the fixation of characters and bulk method based on natural selection. Variations of these methods like backcrosses, single-seed descent and recurrent selection are used less extensively (Fehr, 1987; Destro & Montalván, 1999).
Considering the increasing interest of industrials, farmers and breeders in evaluating the quality of wheat for several uses, the objective of the present study was to obtain advanced lines with higher
grain yield associated with a better technological quality of the grain.
MATERIALS AND METHODS
The F3 populations were planted in the 1998 crop
season at the Experimental Station of
IAPAR in Londrina-PR, using seeds originated from parents with a large variability for grain yield, environmental adaptation and technological quality (Table 1). One hundred individual heads (spikes) of each of the thirteen F2 populations were
harvested in the previous year. Each harvested head in the F2 generation gave origin to a 1 m long
F3 line. In this regard, each F3 population consisted
of a 100 head-rows. One check cultivar was placed every 20 head-rows. The checks were ´IAPAR 29-Cacatu´, ´OCEPAR 16´, ´Trigo BR 18-Terena´ and ´Trigo BR 23´.
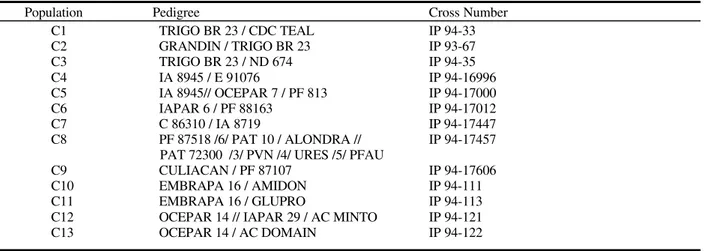
The germplasm used in the crosses which were considered source of genetic variability for quality were: CDC TEAL, GRANDIN, ND 674, IAPAR 6, CULIACAN, AMIDON, GLUPRO, AC MINTO, and AC DOMAIN, which were introduced mainly from the United States, Canada and Mexico. The other genetic materials used in the crosses are adapted to the Brazilian environmental conditions.
The observations of agronomic and quality
characteristics were done as follows: a) Heading
date: observation in days from the seedling
emergency to the plant heading at the moment in
which 50% of the plants reach heading. b) Grain
Yield: weight of grains of the total plot, done only
in the selected lines. The technological quality analysis performed on the selected lines were: a)
SDS-Sedimentation, using the Sodium Dodecyl
Sulfate (MS-SDS) method (Peña et al, 1990). b)
Protein content, the total protein percent was
evaluated by the Kjeldahl method.
Table 1 - Population identification by pedigree and cross number, developed to be selected for yield and quality at IAPAR-Londrina, in 1997.
Population Pedigree Cross Number
C1 TRIGO BR 23 / CDC TEAL IP 94-33
C2 GRANDIN / TRIGO BR 23 IP 93-67
C3 TRIGO BR 23 / ND 674 IP 94-35
C4 IA 8945 / E 91076 IP 94-16996 C5 IA 8945// OCEPAR 7 / PF 813 IP 94-17000 C6 IAPAR 6 / PF 88163 IP 94-17012
C7 C 86310 / IA 8719 IP 94-17447
C8 PF 87518 /6/ PAT 10 / ALONDRA // IP 94-17457 PAT 72300 /3/ PVN /4/ URES /5/ PFAU
C9 CULIACAN / PF 87107 IP 94-17606
C10 EMBRAPA 16 / AMIDON IP 94-111
C11 EMBRAPA 16 / GLUPRO IP 94-113
C12 OCEPAR 14 // IAPAR 29 / AC MINTO IP 94-121 C13 OCEPAR 14 / AC DOMAIN IP 94-122
RESULTS AND DISCUSSION
The statistical analysis performed on the C1 to C13 populations comprised by different numbers of selected F3 lines, aimed in the identification of
the higher potential ones for simultaneous selection for grain yield and technological quality. The heading date values indicated that the lines C6, C7, C9 and C13
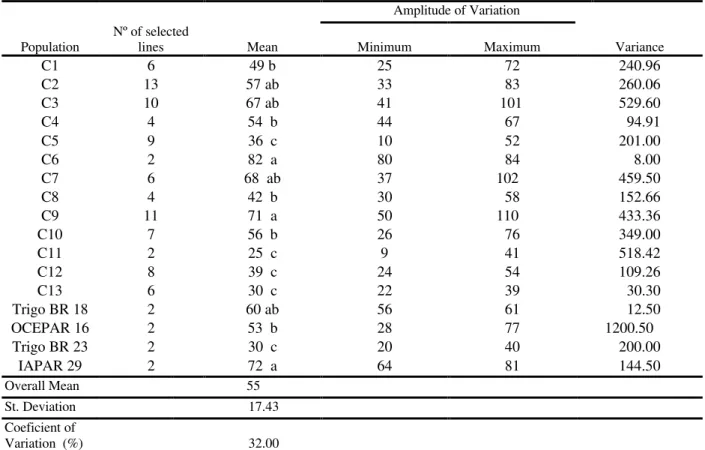
could be classified as having early maturity cycle. The late cycle of populations C2, C3, and C11 is probably due to the fact that at least one parent of these populations is late maturity (Table 2). The grain yield analysis can be seen in Table 3. The populations C6 and C9 had a better performance for mean and maximum grain yield attained. The variance between and within populations indicates good potential for genetic variability for the trait.
Table 2 - Number of days for heading of the populations (F3 lines) and checks selected at IAPAR-Londrina in 1998.
Amplitude of Variation
Population Nº of selected lines Mean Minimum Maximum Variance
C1 6 74 b 72 79 13.06
C2 13 78 a 72 82 13.80
C3 10 78 a 72 84 17.06
C4 4 76 ab 68 74 6.00
C5 9 70 bc 64 74 10.36
C6 2 64 c 64 64 0
C7 6 69 c 64 74 20.17
C8 4 70 bc 68 71 2.25
C9 11 67 c 57 74 33.30
C10 7 72 b 68 76 7.14
C11 2 82 a 74 89 112.50
C12 8 72 b 71 74 1.92
C13 6 69 c 64 74 16.67
Trigo BR 18 2 63 c 63 63 0
OCEPAR 16 2 65 c 65 65 0
Trigo BR 23 2 72 b 72 72 0
IAPAR 29 2 63 c 63 63 0
Overall Mean 70
St. Deviation 5.62
Table 3 - Grain yield in grams per plot, of the F3 lines visualy selected in the field compared wheat cultivars as checks at IAPAR-Londrina, in 1998.
Amplitude of Variation
Population
Nº of selected
lines Mean Minimum Maximum Variance
C1 6 49 b 25 72 240.96
C2 13 57 ab 33 83 260.06
C3 10 67 ab 41 101 529.60
C4 4 54 b 44 67 94.91
C5 9 36 c 10 52 201.00
C6 2 82 a 80 84 8.00
C7 6 68 ab 37 102 459.50
C8 4 42 b 30 58 152.66
C9 11 71 a 50 110 433.36
C10 7 56 b 26 76 349.00
C11 2 25 c 9 41 518.42
C12 8 39 c 24 54 109.26
C13 6 30 c 22 39 30.30
Trigo BR 18 2 60 ab 56 61 12.50
OCEPAR 16 2 53 b 28 77 1200.50
Trigo BR 23 2 30 c 20 40 200.00
IAPAR 29 2 72 a 64 81 144.50
Overall Mean 55
St. Deviation 17.43
Coeficient of
Variation (%) 32.00
Means followed by different letters are different between themselves at the 5% level of probability by the Tukey Test.
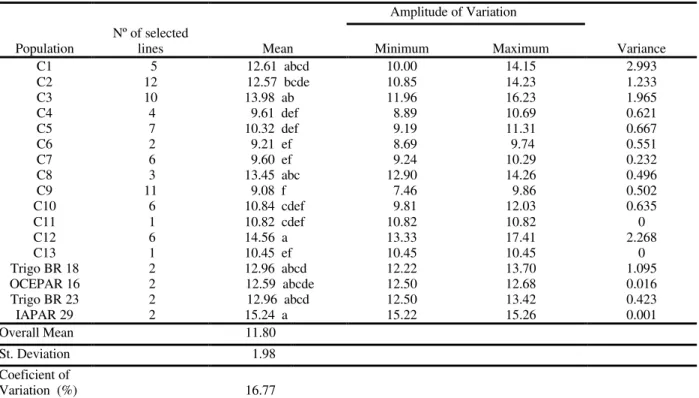
C12, C3, C8 and C1 had better performance among the populations regarding the sedimentation values (Table 4). Good heritability values for SDS sedimentation volume in wheat crosses were found by Matuz (1988). This indicated the possibility of obtention of significant genetic gains.
The populations identified as C2, C3, and C11 showed better performance in terms of protein content (Table 5). This indicated strong relation with technological quality, according to the work
done by Wall, (1979) and Preston et al, (1995).
Although several populations had shown a good performance considering the technological quality parameters, it should be pointed out that the
environmental conditions of cultivation, and grain
handling could alter the values which express the quality of the lines.
CONCLUSIONS
Table 4 - Values of sedimentation obtained by the SDS test of the populations (F3 lines) and checks selected at IAPAR-Londrina, in 1998.
Amplitude of Variation
Population
Nº of selected
lines Mean Minimum Maximum Variance
C1 5 12.61 abcd 10.00 14.15 2.993
C2 12 12.57 bcde 10.85 14.23 1.233
C3 10 13.98 ab 11.96 16.23 1.965
C4 4 9.61 def 8.89 10.69 0.621
C5 7 10.32 def 9.19 11.31 0.667
C6 2 9.21 ef 8.69 9.74 0.551
C7 6 9.60 ef 9.24 10.29 0.232
C8 3 13.45 abc 12.90 14.26 0.496
C9 11 9.08 f 7.46 9.86 0.502
C10 6 10.84 cdef 9.81 12.03 0.635
C11 1 10.82 cdef 10.82 10.82 0
C12 6 14.56 a 13.33 17.41 2.268
C13 1 10.45 ef 10.45 10.45 0
Trigo BR 18 2 12.96 abcd 12.22 13.70 1.095
OCEPAR 16 2 12.59 abcde 12.50 12.68 0.016
Trigo BR 23 2 12.96 abcd 12.50 13.42 0.423
IAPAR 29 2 15.24 a 15.22 15.26 0.001
Overall Mean 11.80
St. Deviation 1.98
Coeficient of
Variation (%) 16.77
Means followed by different letters are different between themselves at the 5% level of probability by the Tukey Test.
Table 5 - Protein percent evaluation of the populations (F3 lines) and checks selected at IAPAR-Londrina, in 1998. Amplitude of Variation
Population
Nº of selected
lines Mean Minimum Maximum Variance
C1 5 14.82 ab 14.51 15.47 0.140
C2 12 15.57 a 14.46 16.58 0.575
C3 10 15.65 a 14.89 16.53 0.172
C4 4 14.09 b 13.88 14.29 0.028
C5 7 14.76 ab 12.56 16.31 1.878
C6 2 12.87 b 12.28 13.47 0.708
C7 6 14.08 b 12.79 16.21 2.175
C8 3 14.80 ab 14.31 15.34 0.266
C9 11 13.52 b 12.48 15.53 0.622
C10 6 14.78 ab 14.25 15.75 0.274
C11 1 15.05 a 15.01 15.01 0
C12 6 14.81 ab 13.84 16.17 0.671
C13 1 13.34 b 13.34 13.34 0
Trigo BR 18 1 14.69 ab 14.69 14.69 0
OCEPAR 16 1 13.84 b 13.84 13.84 0
Trigo BR 23 1 16.08 a 16.08 16.08 0
IAPAR 29 1 14.39 ab 14.39 14.39 0
Overall Mean 14.56
St. Deviation 0.83
Coeficient of
Variation (%) 5.70
ACKNOWLEDGEMENTS
We are grateful to Conselho Nacional de Desenvolvimento Científico e Tecnológico (CNPq) for financial support. The authors are also thankful to the technical support work provided by Valter Geraldo Moretto (AMG) and Maria Isabel Florentino Ferreira (AEF) of IAPAR.
RESUMO
O objetivo do trabalho foi combinar seleção simultânea para produtividade e qualidade tecnológica em populações segregantes elite de trigo, desenvolvidas pelo programa de melhoramento genético do IAPAR. Treze populações foram escolhidas, de acordo com a potencialidade de variabilidade genética na
geração F2. Procedeu-se a seleção de espigas
individuais as quais foram semeadas no sistema de
espigas por fileira. Na geração F3 realizou-se a
seleção individual de linhas, para potencial produtivo. Características como número de dias para o espigamento e peso de parcela foram determinadas. Sementes das linhas selecionadas, foram avaliadas para qualidade tecnológica por meio da análise de Sedimentação e teor de
Proteína. As populações foram denominadas de C1
a C13, representando os diferentes cruzamentos. O
número de linhagens selecionadas dentro de cada população variou de um a doze. As populações C6, C7, C9 e C13 foram classificadas como de maturação precoce. Duas populações (C6 e C9) apresentaram maior potencial de produtividade de grãos. Quatro populações C12, C3, C8 e C1 destacaram-se para a média e variância de sedimentação. As populações C2, C3 e C11 destacaram-se para teores médio, máximo e também variância de proteína. Os resultados obtidos indicam condições favoráveis de obter-se linhagens com elevado rendimento de grãos associados com melhor qualidade tecnológica.
REFERENCES
Allard, R. W. (1960), Principles of plant breeding. New York, J. Wiley, 458p
Dick, J. W. and Quick, J. S. (1983), A modified screening test for rapid estimation of gluten strength in early-generation durum wheat breeding lines. Cereal Chem., 60, 315-318
Destro, D. and Montalván, R. (1999), Melhoramento genético de plantas. Lonrina, PR. Editora UEL, 818p. Fehr, W. R. (1987), Principles of cultivar development.
McGraw-Hill, Inc. 536p
Guarienti, E. M. (1996), Qualidade industrial de Trigo. 2 ed. Passo Fundo. EMBRAPACNPT, 36 p
Jensen, N. F. (1988), Plant breeding methodology. John Wiley & Sons, Inc. 676p
Lukow, O. M. and McVetty, P. E. B. (1991), Effect of cultivar and environment on quality characteristics of spring wheat. Cereal Chemistry, 68, 597-601
Matuz, J. (1998), Inheritance of SDS sedimentation volume of four in crosses of winter wheat (Triticum aestivum L.). Cereal Research Communications, 26, 203-210
Mischan, M. M. and Pinho, S. Z. (1996), Comparações entre efeitos de tratamentos. In: Experimentação Agronômica: Dados não balanceados. Botucatu: Fundibio, cap. 3, 47-79
Peña, R. J.; Amaya, A.; Rajaram, S., and Mujeeb-Kazi, A. (1990), Variation in quality characteristics associated with some spring 1B/1R translocation wheats. Journal of Cereal Science,12, 105-112 Preston, K. R..; Morgan, B. C. and Dexter, J. E. (1995),
Influence of protein segregation on the quality characteristics of Biggar and Genesis Canadá Prairie Spring Wheat. Plant Science,75, 599-604
Wall, J. S. (1979), The role of wheat proteins in determining baking quality. In: Recent Advances in the biochemistry of cereals, ed. D. L. Laidman & R. G. W. Jones. Academic Press, 275-311
Zeleny, L. (1947), A simple sedimentation test for estimating the bread-baking and gluten qualities of wheat flour. Cereal Chem.,24, 465-475