1
Ana Sanchis Huertas
ii
PROVIDING ENERGY EFFICIENCY
LOCATION-BASED STRATEGIES FOR
BUILDINGS USING LINKED OPEN DATA
Dissertation supervised by:
Professor Miguel Neto, Ph.D.
ISEGI
–
Universidade Nova de Lisboa
Professor Rafael Berlanga, Ph.D.
INIT
–
Universitat Jaume I de Castellón
Professor Albert Remke, Ph.D.
IFGI
–
Universität Münster
iii
ACKNOWLEDGMENTS
To my family, my most important support in all the challenges in my life.
To my supervisors, for their valuable comments and guide.
To my professors, opening my eyes to new things.
To my friends, being there.
iv
PROVIDING ENERGY EFFICIENCY
LOCATION-BASED STRATEGIES FOR
BUILDINGS USING LINKED OPEN DATA
ABSTRACT
Climate change is a main concern for humanity from the ending of 20th century.
To improve and take care of our environment, a set of measures has been
developed to monitor, manage, reduce consumption and raise efficiency of
buildings, including the integration of renewable energies and the implementation
of passive measures like the improvement of the building envelope.
Complex methodologies are used in order to achieve these objectives. Using
different tools and data translating is needed, and the loss of accuracy from the
detailed input information is most of the times unavoidable. Moreover, including
these measures in the development of a project have become a try and error
process involving building characteristics, location data and energy efficiency
measures.
v
KEYWORDS
Building Systems
Climate Change
Data
Energy Efficiency
Energy Performance
Environmental Constraints
Decision Support Systems
Geospatial Technologies
Geographical Information Systems
Location
vi
ACRONYMS
AEMET
: Spanish Agency for Meteorological Data
B.C
.: Before Christ
BIM
: Building Information Management
CTE-DB-HE
: Technical Building Code
–
Basic Document
–
Energy Saving
FIDE
: Building Data Interchanging Format
GIS
: Geospatial Information System (Science)
HVAC
: Heating, Ventilation and Air Conditioning
HTTP
: Hypertext Transfer Protocol
IFC
: Industry Foundation Classes
IPCC
: International Panel on Climate Change
LOD
: Linked Open Data
OGC
: Open Geospatial Consortium
PV
: Photovoltaic
RDF
: Resource Description Framework
RES
: Renewable Energy Source
SDI
: Spatial Data Infrastructures
SPARQL
: SPARQL Protocol and RDF Query Language
URI
: Uniform Resource Identifier
vii
TABLE OF CONTENTS
Page
ACKNOWLEDGMENTS ... iii
ABSTRACT ... iv
KEYWORDS ... v
ACRONYMS ... vi
TABLE OF CONTENTS ... vii
INDEX OF TABLES ... x
INDEX OF FIGURES ... xi
1.
INTRODUCTION ... 1
1.1.
Motivation ... 1
1.2.
Problem ... 2
1.3.
Context ... 3
1.4.
Contribution ... 3
1.5.
Structure ... 4
2.
STATE OF THE ART ... 5
2.1.
Energy efficiency strategies ... 5
2.1.1.
Initiatives, directives and laws ... 5
2.1.2.
Passive and active technologies ... 6
2.1.3.
Energy software and tools ... 8
2.2.
The location factor ... 10
2.2.1.
Physical and political factors ... 10
viii
2.3.
Linked Open Data ... 13
2.3.1.
From ontologies to the Web of Things ... 13
2.3.2.
Modelling buildings and environment ... 16
2.3.3.
Tools ... 19
3.
MODELLING ... 23
3.1.
Semantic model ... 23
3.1.1.
Linked Open Data vocabularies ... 23
3.1.2.
LODBLESS vocabulary ... 27
3.2.
Conceptual model ... 30
3.2.1.
Location data ... 30
3.2.2.
Building data ... 32
3.2.3.
Energy efficiency strategies data ... 34
3.3.
Computational model ... 35
3.3.1.
Processes ... 36
3.3.2.
Implementation technology ... 39
3.3.3.
User interface ... 41
4.
USE CASE ... 43
4.1.
Data ... 43
4.1.1.
Building ... 43
4.1.2.
Location... 46
4.1.3.
Systems ... 48
4.2.
Processes ... 51
4.2.1.
Application ... 51
4.2.2.
Assessment ... 55
5.
CONCLUSIONS ... 57
5.1.
Achievements ... 57
5.2.
Lessons learned ... 58
ix
BIBLIOGRAPHIC REFERENCES ... 61
ANNEX A. RDF LODBLESS INSTANCE ... 73
ANNEX B. SPARQL QUERIES ... 77
x
INDEX OF TABLES
Table 1.- Summary of re-used terms ... 26
Table 2.- Summary of new terms ... 27
Table 3.- Excerpt from Gandia74 data ... 46
Table 4.- Excerpt from Gandia74_loc data ... 47
Table 5.- Excerpt from Fide_solConst_2027 data ... 49
Table 6.- Excerpt from PV_101 data ... 50
Table 7.- Based near process inputs and outputs ... 52
Table 8.- Climatic Zones process inputs and outputs ... 53
Table 9.- Parameters process inputs and outputs ... 54
Table 10.- Systems process inputs and outputs ... 54
Table 11.- Energy Class process inputs and outputs ... 54
Table B 1.- Query results from weather station within bounding box ... 77
xi
INDEX OF FIGURES
Figure 1.- Climate data ... 31
Figure 2.- Building data ... 32
Figure 3.- Energy data ... 33
Figure 4.- Systems data ... 34
Figure 5.- Application schema ... 36
Figure 6.- Process for envelope systems ... 37
Figure 7.- Process for renewable energy sources ... 39
Figure 8.- Possible application mockup using GoogleMaps ... 42
Figure 9.- Use case RDF graph ... 44
Figure 10.- Comparison between constructive systems ... 55
1
“In the winter, that seat is close enough to the radiator to remain warm, and yet not so close as to cause
perspiration. In the summer, it's directly in the path of a cross-breeze created by opening windows there and there. It faces the television at an angle that is neither direct, thus discouraging conversation, nor so far wide as to create a parallax distortion. I could go on, but I think I've made my point.”
Dr. Sheldon Lee Cooper - The Big Bang Theory Pilot
1.
INTRODUCTION
1.1.
Motivation
Climate change is a main concern for humanity from the ending of 20th century. Human
activities affect environment and consume resources with limited lifetime. One of these activities is the process of construction and use of buildings. In 1990, the residential, commercial and institutional buildings sector was responsible for one-third of global energy use and associated carbon emissions (Watson et al., 1996).
In this context, most efforts are done in the scope of the building contribution to pollution, paying attention to the whole building life cycle, from the site election and the natural resources involved, the materials, construction processes and tools, the appliances installed and the energy sources, to the use performed by people during its life (Kim et al., 2010). Initiatives are carried on in international meetings like the Intergovernmental Panel on Climate Change (IPCC) where governments and institutions develop rules from global to local concerns, defining variables and objectives to achieve (UNGA, 1998).
These objectives are intended to be achieved by countries and supranational institutions defining framework legislations and measures to be implemented during the building lifetime. In this sense, the ―Directive 2002/91/EC of the European Parliament and of the Council of 16 December 2002 on the energy performance of buildings‖ defines a set of variables to take into account to monitor, manage, and finally reduce consumption and raise energy efficiency of buildings (COM 2002/91/EC).
2
1.2.
Problem
In order to calculate and define how to implement measures and achieve energy related objectives, different tools and complex methodologies have been developed on top of the regular projecting process, where not all of them provide same functionalities, provoking several problems (Crawley et al. 2008). Since there is no tool performing all necessities mentioned by legislation, the use of different tools is needed to cover the complete range of measures recommended. Moreover, since these tools are not an integrated part of the projecting process but a supplement, the energy performance calculation need always more than one tool. The independency and heterogeneity of these tools provokes the need of data translation, for the sake of interoperability, resulting on a consequent loss of accuracy and a long, complex transformation process, increasing error rate. possibility of error appearance.
A classic architectural project follows Vitruvius‘s axiom ―Utilitas, Firmitas, Venustas‖.
A global conception from first century B.C. validated through time until the present days.
But there is no ―Sostenibilitas‖ in this axiom, making energy performance calculation a
try and error process involving building characteristics, location data and energy efficiency measures, where first the building is defined and, afterwards, its energy performance is checked. If the building fails its desired classification, a failure notification is sent, but in many cases, not a reason or alternative solution is provided, so going back is needed, then changing some parameters based usually on intuitions, and starting again, becomes the regular process.
3
Some tools integrate data from very different sources and provide a wide range of calculations and alternative solutions, but they are often proprietary tools, where high fees are demanded and almost none of them act as a pre-feasibility tool to avoid the uncertainty of verifying the defined project performance. Furthermore, these tools are prepared to deal with their own data encodings, facing some interoperability issues when trying to access and exploit a set of heterogeneous data. Finally, they work with non semantic data, so you are not allowed to discovery related data or even interpret the similarities or differences within available data.
1.3.
Context
The raising of new technologies capable of dealing with location- based data, like climate or soil data, both interesting and needed in this work, is an important achievement for data providing and processing. Many efforts are being done in the standardization of this type of data, like the Open Geospatial Consortium standards and specifications (Schell et al. 2000), and its availability, like with the deployment of Spatial Data Infrastructures, information systems based on standardized web services to manage and share geospatial data and tools.
In the building context, the development of the Building Information Modelling (BIM) facilitates the comprehension of buildings composition, relations and functionality. The materials catalogue defined as XML standards like FIDE (AIDICO, 2011) or the cities models and buildings defined with CityGML (Gröger et al. 2008) are some examples.
Also introducing and improving semantic content within data, to relate and structure information in a machine readable way will help users to find, share, and combine information more easily. In this context, he World Wide Web Consortium (w3) or Linked Data initiative define standards and methodologies which will help our goal of linking data from very different sources to get more useful results (Heath et al. 2009). Efforts are done in the field of climate data, like Aemet data, provided as LOD (http://aemet.linkeddata.es/index.html), or, in the field of housing definition, the DogOnt ontology for domotic systems (Bonino and Corno, 2008).
1.4.
Contribution
4
objectives from its very conception. Early design decisions may not require a detailed simulation program or a suite of tools which would support a range of simulation needs (Crawley et al. 2008) but one simple tool covering all simulations in a general way.
The idea is to model available data in a way that, from very simple data like location, use, orientation or area, non expert users will be able to get a set of energy efficiency strategies like building envelope materials and constructive systems or potential power available from renewable energies systems.
The objective is to find out which data are necessary and sufficient to get a result; which ones must be provided by users, and which ones are available by other means an where. Then, find out how these data can be connected to perform together. And finally, what are the operations that these data have to complete to get a useful result.
For doing so, the energy demand limitation verification process and the energy performance classification process will be studied and a simplified step by step process will be proposed. Then all data needed as inputs and outputs in each step will be set, and its origin will be studied. The relations needed between data to perform together will be modeled and a vocabulary for missing terms will be built and exposed as LOD.
The expected result may serve to allow the development of an application on top of this model that should act as a pre-feasibility on-line open tool to provide information in an accessible, open, understandable and easy way.
The intended simplicity of data needed, makes this model useful for general public wanting to know about their energy savings possibilities before starting a new project or refurbishment, as well as to professionals willing to have a starting point for their project, avoiding part of the uncertainty of the energy performance checking process.
1.5.
Structure
5
2.
STATE OF THE ART
In this section we expose a collection of references and sorted literature related to our topic, split in three categories. The ones related to energy efficiency strategies and management, the ones related to location based factors and technologies, and finally the ones related to the way of structuring these data semantically, focused on Linked Open Data initiatives.
2.1.
Energy efficiency strategies
This category of commented literature focuses on different initiatives and strategies for actually reduce consumption and environmental pollution due to the activities performed in buildings. We will see active and passive measures contributing to this task and existing software and tools managing and checking them.
2.1.1.
Initiatives, directives and laws
The Intergovernmental Panel on Climate Change (IPCC) is the leading international body for the assessment of climate change. It was established by the United Nations Environment Programme (UNEP) and the World Meteorological Organization (WMO) to provide the world with a clear scientific view on the current state of knowledge in climate change and its potential environmental and socio-economic impacts (Watson et al., 1996).
Focused on building contribution to climate change, European Union has developed and approved several guidelines and Directives, such as Directive 2002/91/EC of the European Parliament and of the Council of 16 December 2002, aiming to reduce consumption in this context, by introducing the concept of energy performance of the building, that should be calculated on the basis of a methodology, which may be differentiated at regional level, and includes, in addition to thermal insulation, other factors that play an increasingly important role such as heating and air-conditioning installations, application of renewable energy sources and design of the building (COM 2002/91/EC).
6
measures (CTE-DB-HE). The conjunction of these concepts leads to an energy classification scale (IDAE, 2009-1), from A to G, depending on the best to worst building global performance, which is based on some performance indicators related to energy consumption and location-based factors.
In order to support energy performance calculation and improvement, catalogues and manuals are published by both public and private sectors, like the Catalogue of Building systems (http://www.elementosconstructivos.codigotecnico.org/Pages/BusquedaSC. aspx), which contains a wide range of materials, products and building components for roofs, walls, openings and interior partitions with their hygrothermal and acoustic characteristics related to the requirements listed above, and published under the supervision of the Housing Ministry of the Spanish Government.
We can also find a guide like (ITC, 2009), aiming to collect energy measures that can be taken to reduce energy consumption, use it in a more efficient way and promote the use of renewable energies with subsequent reduced environmental impact. Also the specific quality profile of energy savings and sustainability guide (IVE, 2009) develops requirements related to the habits of "Energy Saver", distinguishing quality beyond the minimum requirements established by the Technical Building Code (CTE) and the "Sustainable use of natural resources", whose main objective is to reduce environmental pressures of each stage of the life cycle of resources, including extraction, use and final disposal. Both are developed by Valencia Regional Government initiatives.
Based on CTE-DB-HE4, is mandatory in Spain the use of solar energy for thermal uses, as hot water supply. Private initiatives working on this field are providing technical guides to better take into account location factors like average annual solar radiation, and building characteristics like number of bedrooms, to help accurate calculation of these installations, like Gas Natural has done in (Gas Natural, 2007).
2.1.2.
Passive and active technologies
7
of resources and renewable energy sources usage are listed inside the documents mentioned above. All of them deal with data.
The designer has to make assumptions for a wide range of input data if information is not yet available on clime, soil and building characteristics, including building geometry, and configuration of spaces, orientation, thermal properties of all construction elements (walls, floors, roofs/ceilings, windows, doors, and shading devices), usage and functional use, internal loads and schedules for lighting, occupants and equipment; heating, ventilating, and air conditioning (HVAC) system type and operating characteristics, weather data, and so on. Moreover, designer has to deal with interoperability problems. That is why some initiatives like BuildingSMART alliance (bSa) and the Open Geospatial Consortium, Inc. (OGC) are developing a test bed for integrating all building data in order to assist decision making along the building lifetime and build a real Building Information Modelling (BIM) system (OGC 10-003r1).
The complexity of these systems and the data needed requires us to take into account only a set of measures dealing with more simple data, balanced with the utility of the results that they can provide.
As described in (Singh et al. 2009), vernacular architecture based on bioclimatic concepts has been developed and used through the centuries by many civilizations across the world. Their own architectural styles based on the local conditions, including different solar passive features related to temperature control and natural ventilation and the use of locally available materials represent a sustainable way of building design.
Reuse of domestic greywater and rainwater has an important role to play in water savings inside buildings. Building occupancy, roof area, appliances type and storage volume affect water saving efficiency. For example, with less than 50 liters of rainwater storage, water reuse can save up to 80% WC flush (Dixon et al. 1999).
8
irradiation on a horizontal, vertical or inclined plane of the PV module. On average, covering 0.6% of the EU25+5 territories by PV modules would theoretically satisfy its electricity consumption (Suri et al. 2007).
For the estimation of solar potential for water heating, a model for evaluation procedure consisting of three steps is described in (Voivontas et al. 1998). Among the data needed, there is the solar radiation and the energy demand for water heating, which depends on the number of persons using the building.
The two main barriers to large-scale implementation of wind power are the perceived intermittency of winds, and the difficulty in identifying good wind locations, especially in developing countries (Archer and Jacobson, ), but when calculating its potential, wind power reveals as an important source of energy for building whenever they are sited, and tools like (http://www.sustainableenergyworld.eu/calculate-windturbine-annual-energy) provide us an approximate result based on data such as wind speed at 50 meters of height,
environment (city centre, village, forest, rough terrain…), diameter of rotor and hub height.
The geothermal resources of most European countries have been estimated and compiled in the Atlas of Geothermal Resources in Europe (Hurtera and Schellschmidt, 2003). In order to quantify these resources, they have defined the amount of heat available in the rock (geothermal reservoir) and the characteristics of the reservoir with respect to the extraction of this heat. Geothermal energy can be exploited with various technologies and it feeds a great diversity of applications, alone or in combination with other sources of energy. Although these Atlas exist, we are not taking into account the geothermal resources due to the big differences existing within different technologies and the complexity of data needed, not easily available locally.
2.1.3.
Energy software and tools
Once we have deal with strategies and data needed to foresee their results, we need tools to operate these data and calculate results.
9
performance respectively, and need a huge amount of input data not available in the early steps of the design.
Other tools are available in a more or less open and free way. One of the most popular is DOE-2 and its evolution eQUEST. DOE-2 is a widely used and accepted freeware building energy analysis program that can predict the energy use and cost for all types of buildings. DOE-2 uses a description of the building and systems provided by the user, along with weather data, to perform an hourly simulation of the building and to estimate utility bills (http://doe2.com/). eQUEST (http://doe2.com/download/equest/eQUESTv3-Overview.pdf) is designed to be run by non expert users by combining schematic and design development building creation wizards, an energy efficiency measure wizards and a graphical results display module with a complete up-to-date DOE-2 building energy use simulation program. Still they need a huge amount of input data not available in the early steps of the design.
Green Building Studio (Autodesk, ) is an innovative building energy and carbon analysis web-based service, where data is collect from three sources: a Revit software model (http://usa.autodesk.com/revit-architecture/), the responses to a few basic questions provided by the user, such as building type, location or nearest weather station, and regionalized databases with information about local weather conditions or construction materials. This is a complete tool not suitable for an early stage of design decision making, since a Revit model is a quite complex building information model format with a huge amount of data not available in the early steps of the design. Moreover, both GreenBuildind Studio and Revit are not freeware tools.
10
In the context of RES, a popular tool is found in the RETScreen initiative (RETScreen, 2005).The RETScreen International Clean Energy Project Analysis Software is the leading tool specifically aimed at facilitating pre-feasibility and feasibility analysis of clean energy technologies. The core of the tool consists of standardized and integrated project analysis software which can be used worldwide to evaluate the energy production, life-cycle costs and greenhouse gas emission reductions for various types of proposed energy efficient and renewable energy technologies. Covering a huge amount of RES technologies, each of them is run in a different Excel sheet, where you need to specify the parameters describing the location of the energy project, the type of system used in the base case, the technology for the proposed case, the loads (where applicable), and the renewable energy resource in detail.
PVGIS is an online tool to calculate potential photovoltaic power supply by location, area available and technology to use (Suri et al. 2007), very useful for its purpose, but not for any other performance interest, like the wind power calculator from (http://www.sustainableenergyworld.eu/calculate-windturbine-annual-energy).
In this context, based on the energy demand limitation, energy performance and renewable energy sources constraints, we have seen a wide range of software and methodologies developed, but, as exposed on the introduction section, not all of them serve to same purposes or cover all process, needing complex and different input data in content and format.
2.2.
The location factor
Energy efficiency technologies, as we have seen in the previous section, are related to different parameters. Among them, we always find a reference to the place where they are being implemented. This reference may be a mean temperature on the air, under the ground, or even a conventional parameter fixed by a regional law. This section briefly reviews some of these factors depending on the place where we are working in each situation, and being the core of the model to design in next sections.
2.2.1.
Physical and political factors
11
according to their neighbors, too. In the scope of energy efficiency, we find a pyramidal agreement for setting constrains fitting all regions in the world, since we are treating a worldwide issue.
From international meetings as United Nations Framework Convention on Climate Change, in Kyoto, 1992, or the setting of the IPCC (Watson et al., 1996), definitions have been developed and specified in each different region. Europe has promote its European directive on energy performance (COM 2002/91/EC) and Spain has develop it with its RD 47/2007, whose spirit fits with the international ideas, but its concretizations is based on regional particularities.
This way, we find location-based parameters to accomplish, not because of the nature of our location, but because of the laws that rule our location. This is the case of solar energy for thermal use, which, in Spain, must cover at least a 30% (and up to 70%) of
total hot water use of the building, or the photovoltaic installation of at least 6‘25kWp,
which is mandatory for non residential buildings over a certain area (CTE-DB-HE).
In most cases, including previous ones, natural conditions of location rule the efficiency of the measures to implement. Both technologies and laws ruling its installation take into account the natural environment of the place where they are being installed.
We can find in (IDAE, 2009-2) many of these location-based parameters taken into account for the calculation of the energy demand limitation: latitude, altitude, hours of sun or mean temperatures are involved in the determination of the twelve climatic zones that fix the limit values for thermal transmittance.
Topography and physical environment is very important for shadow calculating in order to determine the efficiency of solar energy, and humidity values are taken into account for condensation limits (CTE-DB-HE).
12
2.2.2.
GIS and SDI
As seen, many environmental data are used to determine energy consumption, performance and efficiency. Users of energy simulation programs often have a wide variety of data from which to choose—from locally recorded, measured data or typical data sets.
Related to weather data, the National Weather Service (NWS) collects weather information from 4.000 stations around the world. The National Renewable Energy Laboratory (NREL) collects, parses, and stores this weather data in a local database to give researchers easy access to the data. The data are available to anyone via Internet and e-mail (Long, 2004).
In general, having data with very different ways to get and work on, we could ask: does it really matter which weather data you use (Crawley and Huang, 1997)? Using a prototype building, the influence of locally measured weather data and typical weather datasets on annual energy consumption, demand, and costs were compared and seen that the range of energy consumption due to actual weather variation can be significant—as much as +7.0%/-11.0% from long-term average weather patterns.
In this context, Geospatial Information Systems (GIS) have started to succeed as a capital technology to store and exploit energy related data, since most of the processes related to the energy performance of buildings involve location-based information.
PVGIS considers and stores in a GIS database (Suri and Hofierka, 2004) monthly averages and yearly average of climatic parameters such as daily global irradiation, ratio of diffuse to global irradiation and clear-sky index (characterizes cloudiness of the sky). It also incorporates DEM data, for the detailed structure of the terrain features (elevation and shadowing) to be represented and properly calculate solar electricity potential (Suri et al. 2007).
Solar radiation and sunshine duration are taken into account in (Voivontas et al. 1998) for determining the solar potential for water heating, being such important location-based parameters to be stored as a GIS database to explore and exploit.
13
transmittance limits, solar water heating or photovoltaic power, leads to the idea of having a real Spatial Data Infrastructures (SDIs) incorporating this kind of environmental data to support research in energy efficiency field, avoiding wasteful duplication of effort and promoting effective and economical management of resources (Clinton, 1994).
In this context we find in Spanish area the IDEE (Spatial Data Infrastructure of Spain), (http://www.idee.es/clientesIGN/wmsGenericClient/index.html?lang=ES) or in the Valencia Region (http://terrasit.gva.es/es/ver) a web service based data provider with cadastral information, land use, biodiversity, statistics, and so on.
Other non official data providers use geospatial information tools like Esri Geoportal Server, a free, open source product that enables discovery and use of geospatial resources including datasets, rasters, and Web services (http://www.esri.com/software/ arcgis/geoportal/index.html); GoogleMaps API Web Services, a collection of HTTP interfaces to Google services providing geographic data for your maps applications (http://code.google.com/intl/en/apis/maps/documentation/webservices/index.html); or OpenLayers, developed to further the use of geographic information of all kinds (http://www.openlayers.org/).
2.3.
Linked Open Data
The realization of this SDI of environmental data, and, in addition, other data related to energy analysis as building modelling data or energy efficiency data will be very interesting if done in a way that adds a semantic relation between concepts. Linked Open Data initiative matches this approach. In this section we see a background on the semantic relationships and LOD platforms.
2.3.1.
From ontologies to the Web of Things
14
semantic linkage of data to architectural and energy analysis domain on the literature mentioned below.
Design of architectural environments has to take into account various sources of heterogeneous information. Modularity allows a flexible integration of various sources while keeping their thematically different aspects apart. Modular ontologies can reflect and be applied for the domain of architectural design (Hois et al., 2009).
Context-aware computing is about gathering user information and their environment such as user location and preferences, service status, and nearby devices. Such context information is used to adjust environment settings to suit user needs and preferences. As environments can change rapidly, applications must be aware of it and adapt their behavior in real time. Contextual ontology is a key component to enable context sharing and representation (Machuca et al., 2005).
These two previous concepts are interesting for an integrated building design process, involving studies of the energy-related impacts and interactions of all building components, like building location, envelope (walls, windows, doors, and roof), heating, ventilation and air conditioning (HVAC) system, lighting, controls, and equipment, which shows why it is so difficult to find the correlation between different systems. Moreover, using data mining technology can help project teams discover important patterns to improve the building design and is useful to extract interrelationships and patterns of interest from a large dataset (Kim et al., 2010).
An approach to ―smart building‖ services relying on the Web and on Semantic Web
formalisms and methods is shown in (Bry et al., 2005) where the modelling of knowledge is realized in different ontologies called ―Micro-Theories‖, written in OWL (the most recent development in standard ontology languages from the World Wide Web Consortium (W3C) (Horridge, 2011) and used to describe domain specific knowledge,
e.g., the furniture of a building. Such ontologies are integrated into one ―Upper
Ontology‖ specifying common sense knowledge such as the ways of using the furniture.
15
applications operating on top of an unbound, global data space. This enables them to deliver more complete answers as new data sources appear on the Web (Bizer et al., 2009).
Technically, Linked Data refers to data published on the Web in such a way that it is machine-readable, its meaning is explicitly defined, it is linked to other external data sets, and can in turn be linked to from external data sets. (http://www.w3.org/DesignIssues/) outlines a set of 'rules' for publishing data on the Web in a way that all published data becomes part of a single global data space: 1) Use URIs as names for things, 2) Use HTTP URIs so that people can look up those names, 3) When someone looks up a URI, provide useful information, using the standards (RDF, SPARQL), and 4) Include links to other URIs, so that they can discover more things (Bizer et al., 2009).
In this context, the Resource Description Framework (RDF) is a general-purpose language for representing information in the Web. We use its classes and properties to define our resources and relations between them (http://www.w3.org/TR/rdf-schema/).
The basic assumption behind Linked Data is that the value and usefulness of data increases as it is interlinked with other data. In summary, Linked Data is simply about using the Web to create typed links between data from different sources. The basic objectives of Linked Data are to use the RDF data model to publish structured data on the Web, and to use RDF links to interlink data from different data sources. The glue of the data web is RDF links. An RDF link simply states that one piece of data has some kind of relationship to another piece of data (Bizer et al., 2007).
(Bizer et al., 2007) provides practical advice on how to name resources with URI references; discusses terms from well-known vocabularies and data sources which should be reused to represent information; explains what information should be included into RDF descriptions that are published on the Web; gives practical advice on how to generate RDF links between data from different data sources and presents several complete recipes for publishing different types of information as Linked Data on the Web using existing Linked Data publishing tools.
16
in the Web by reusing and adapting technologies and patterns commonly used for traditional Web content. The services that smart things expose on the Web can be supplemented with semantic information, so that smart things can not only communicate on the Web, but also provide a user-friendly representation of themselves. This makes it possible to interact with them via web browsers and explore the world of smart things with its many relationships (Guinard et al. 2010).
2.3.2.
Modelling buildings and environment
Some efforts are done in the scope of energy efficiency and building modelling to structure data related, from simple structures to semantically improved datasets, ontologies and Linked Data initiatives.
In recent years, most virtual 3D city models have been defined as purely graphical or geometrical models, neglecting the semantic and topological aspects. CityGML is a common semantic information model for the representation of 3D urban objects that can be shared over different applications, defining classes and relations for the most relevant topographic objects in cities and regional models with respect to their geometrical, topological, semantic and appearance properties (SIG 3D, 2006).
Building Information Modelling (BIM) is the latest generation of Object Oriented Computer Aided Design systems in which all of the intelligent building objects that
combine to make up a building design can coexist in a single ‗project database‘ or ‗virtual building‘ that captures everything known about the building. But, among other problems,
it is found that managing ―what if‖ scenarios for engineering design using a single BIM model for building performance modelling (i.e. energy analysis, sun/shade studies, egress simulation, etc.) does not provide the flexibility needed (Howell and Batcheler, 2005).
Traditional approaches to share project information via file exchange using formats such as .dxf, .dwf, .dwg and .pdf do not transfer the appropriate levels of object intelligence from one model to another. New approaches addressing the need to exchange more intelligent project data include IFC-based model exchange, and the ubiquity of XML as a protocol for transferring sub-sets or ―packets‖ of relevant project information is a key
17
building and facility management industry sector. IFC is the international standard for openBIM and is registered with the International Standardization Organization ISO (http://www.buildingsmart-tech.org/ifc/IFC2x3/TC1/html/ifcproductextension/lexical/).
FIDE data model has established a common reference framework in the Spanish construction sector. It has been developed taking into account IFC standard, and for this reason, its scope is not only national but also international (Garrido and Martinez, 2006). The Spanish Catalogue of constructive systems is available in this format (http://www.elementosconstructivos.codigotecnico.org/Pages/BusquedaSC.aspx).
CityGML (representing a wide range of 3D urban objects) and IFC (representing a very detailed semantic model for buildings) are considered the most prominent semantic models in GIS and BIM, respectively. But both IFC and CityGML use different terminologies to describe the same domain and present a great heterogeneity in their semantics. A semantic model has been proposed by building an intermediate Unified Building Modeled (UBM) to allow bidirectional conversion between them and contribute towards a design of modelling that can support applications on both domains (El-Mekawy and Östman, 2010).
The BIM has been applied to control the space objects and manage the information resources. Ontologies can be the answer to identify the properties of objects and descript their logics (Lee at al., 2008). Given the diversity of home environment, appliances, and residents, the applications for smart homes must be configurable and adaptive. Instead of programming each household, an ontology-based framework will facilitate the automatic composition of appropriate applications (Xu et al., 2009).
DogOnt (Bonino and Corno, 2008) is a house modelling ontology designed to fit real world domotic system capabilities and to support interoperation between currently available and future solutions. DogOnt is composed of two elements: the DogOnt ontology, expressed in OWL, which formalize all the aspects of the domotics and the building, and the DogOnt rules, which ease the modelling process by automatically generating proper states and functionalities for domotic devices, and by automatically associating them to the corresponding device instances through semantic relationships.
18
the potential of ontologies to describe the domain, in order to provide an effective base for the development, the configuration and the execution of software applications (Lafti et al., 2007).
We find also an OWL encoded context ontology (CONON) for modelling context in pervasive computing environments, and for supporting logic based context reasoning. CONON provides an upper context ontology that captures general concepts about basic context, and also provides extensibility for adding domain-specific ontology in a hierarchical manner (Wang et al., 2004).
In the scope of environmental data, we find also some ontology-based initiatives to manage information.
The aim of the AEMET ontology network is to represent knowledge related to measurements made by the network of meteorological stations of the Spanish Meteorological Agency. Each of these measurements represents the state of the atmosphere (humidity, pressure, temperature, wind, etc.) in a particular place and time. AEMET ontology network follows a modular structure consisting of a central ontology that links together a set of ontologies that describe different sub domains involved in the modelling of the meteorological measurements. These sub domains are: Measurements (weather), Sensors, Time and Location (http://aemet.linkeddata.es/index.html).
GeoLinked Data is an open application that makes use of several heterogeneous Spanish public datasets that are related to administrative, hydrographic, and statistical domains. This application aims at analyzing existing relations between the Spanish coastal area and different statistical variables such as unemployment, population, dwelling, industry, and building trade, dealing with the geometrical information of features (de Leon et al., 2010).
In a less concrete domain, we find general, big, helpful ontologies for modelling context and environment, like the OWL Web Ontologoy Language, a language for defining and instantiating Web ontologies. An OWL ontology may include descriptions of classes, properties and their instances (http://www.w3.org/ TR/2004/REC-owl-guide-20040210/).
19
(http://www.w3.org/2003/01/geo/wgs84_pos#), OWL-Time ontology provides a vocabulary for expressing facts about topological relations among instants and intervals, together with information about durations, and about datetime information (http://www.w3.org/TR/owl-time/) and TISC, the Open Time and Space Core Vocabulary, is a lightweight spatiotemporal vocabulary aiming to provide spatial and temporal terms to enable practitioners to relate their data to time and space (http://observedchange.com/tisc/ns/).
Dublin Core Metadata Initiative (http://dublincore.org/documents/dcmi-terms/) maintains some metadata terms related to the author, classification and structure of all kinds of information and FOAF is a project devoted to linking people and information using the Web, regardless of where information is. FOAF integrates three kinds of network: social networks of human collaboration; representational networks, and information networks that use Web-based linking to share independently published descriptions of this inter-connected world (http://xmlns.com/foaf/spec/).
DBpedia is a community effort to extract structured information from Wikipedia and to make this information available on the Web. The DBpedia knowledge base is served as Linked Data on the Web, being one of the central interlinking-hubs of the emerging Web of Data (http://wiki.dbpedia.org/About).
2.3.3.
Tools
Protégé is a widely used open-source ontology and knowledge base editor. While ontologies are becoming so large in their coverage that no single person or a small group of people can develop them effectively and ontology development becomes a community-based enterprise, the Web becomes the natural platform of choice for developing ontologies collaboratively. Web-Protégé is a web-based lightweight ontology editor, open source, providing an augment ontology-editing environment with facilities for discussions and annotations (Tudorache et al., 2009).
20
are appearing and showing the visual power of the Data Web (http://www. visualdataweb.org/tools.php).
A web of linked RDF data may be enabled by standards specifying how links should be made in RDF and under what conditions they should be followed as well as powerful generic RDF browsers that can traverse an open web of RDF resources. Tabulator project is an attempt to demonstrate and utilize the power of linked RDF data with a user-friendly Semantic Web browser that is able to recognize and follow RDF links to other RDF
resources based on the user‘s exploration and analysis (Berners-Lee et al., 2006).
Since RDF is a directed, labeled graph data format for representing information in the Web it can be queried. SPARQL (http://www.w3.org/TR/rdf-sparql-query/) can be used to express these queries and contains capabilities for querying required and optional graph patterns along with their conjunctions and disjunctions. Its results can be results sets or RDF graphs.
RelFinder is an approach for the interactive discovery of relationships between selected elements via the Semantic Web (Heim et al., 2010). It emphasizes the human aspect of relationship discovery by offering sophisticated interaction support. It extracts and visualizes relationships between given objects in RDF data and makes these relationships interactively explorable. The interactive visualization of the graph supports a systematic analysis of the found relationships by providing highlighting, previewing, and filtering features (Heim et al., 2009). The application potentials include assisting business analyst in decision-making.
RDF GRAph VIsualization Tool (RDF Gravity) is a tool for visualizing directed graphs built in RDF and OWL. The tool provides a simple yet powerful visualization of RDF graph structures and the ability to filter out and visualize specific parts or fragments of RDF Graphs (Goyal and Westenthaler, ).
21
Map4rdf is a mapping and faceted browsing tool for exploring and visualizing RDF datasets enhanced with geometrical Information. Map4rdf is an open source software in which one just need to configure it to use your SPARQL endpoint and provides you with a map-based visualization of your data (http://oegdev.dia.fi.upm.es/projects/map4rdf/).
D2R Server is a tool for publishing non-RDF relational databases as Linked Data on the Web. Using a declarative mapping language, the data publisher defines a mapping between the relational schema of the database and the target RDF vocabulary. Based on the mapping, D2R server publishes a Linked Data view over the database and allows clients to query the database via the SPARQL protocol (Bizer et al., 2009) (Bizer and Cyganiak, 2006).
Virtuoso is a multi-model data server for data management, access, and integration. The hybrid server architecture of Virtuoso enables it to offer traditionally distinct server functionality within a single product that covers the areas of Relational Data Management, RDF Data Management, XML Data Management, Free Text Content Management and Full Text Indexing, Document Web Server, Linked Data Server, Web Application Server and Web Services Deployment (SOAP or REST) (http://virtuoso.openlinksw.com/). Aemet and GeoLinkedData initiatives have used this server.
The Pubby server can be used as an extension to any RDF store that supports SPARQL. Pubby rewrites URI requests into SPARQL queries against the underlying RDF store. Besides RDF, Pubby also provides a simple HTML view over the data store and takes care of handling 303 redirects and content negotiation between the two representations (Bizer et al., 2009) (http://www4.wiwiss.fu-berlin.de/pubby/).
22
R is a language and environment for statistical computing and graphics. R provides a wide variety of statistical (linear and nonlinear modelling, classical statistical tests, time-series analysis, classification, clustering ...) and graphical techniques, and is highly extensible. R is available as Free Software (http://www.r-project.org/about.html). Rrdf is an R package that provides methods to read and write RDF, and query RDF using SPARQL; add properties, triples or prefixes for namespaces; combine and query
models… This makes it the optimum tool to implement all operations and formulae
23
3.
MODELLING
Since we are addressing to non professional users and early stages of the professional design process, we are not aiming to get a result as accurate as the ones got using previously described tools, covering the whole process and details of the energy performance analysis (IDAE, 2009-2) (IDAE, 2009-3) (http://doe2.com/) (http://doe2.com/download/equest/eQUESTv3-Overview.pdf) (Autodesk) (RETScreen, 2005).
Our goal is to provide an easy to understand energy efficiency strategy (related to constructive system or renewable energy source system) based on some required data: the location and characteristics of the building, for supporting decision making in the very beginning of a project.
Involving non expert users, we assume previous data cannot be complex or inaccessible or difficult to understand, and thus the other goal is to reduce to the maximum this collection of data, necessary and sufficient to get an applicable result.
The design principles considered try to keep simplicity in both data and processes models, reusing existing available data when possible. For doing so, we choose Linked Open Data for several reasons, among them, the fact that LOD is a semantic based open source model, which will facilitate the addition of meaning and structure to the data linkage and its reusability (Bizer et al., 2009).
3.1.
Semantic model
All these data extracted, stored and transformed are exposed as LOD where other users could reuse it for this or other purposes. We choose LOD for several reasons, among them, the fact that LOD is a semantic based open source model. This section describes the terms used to model our model as Linked Open Data and the technologies to implement functionality, but it does not implement it.
3.1.1.
Linked Open Data vocabularies
24
descriptive context and in a more focused topics related to this work. Thus there are chances to reuse information and data already available.
Being one of the objectives of this work to be accessible for non-expert users, the idea is to re-use the more quantity of data and structures available to reduce to the maximum the data that users have to provide. We develop a model based on available, accessible data, and benefit from the structure and semantics published by other initiatives.
All things described by RDF (http://www.w3.org/TR/rdf-schema/) are called resources, and are instances of the class rdfs:Resource, who in turn is an instance of rdfs:Class. All other classes are subclasses of this rdf:Class. The class rdfs:Literal is the class of literal values such as strings and integers. rdfs:Literal is also an instance of rdfs:Class and a subclass of rdfs:Resource. rdf:Property is the class of RDF properties and is also an instance of rdfs:Class. Instances of rdf:Property used in our model are:
rdfs:range: the values of a property are instances of some class.
rdfs:domain: any resource that has a given property is an instance of some class.
rdf:type: a resource is an instance of a class.
rdfs:subClassOf: all the instances of one class are instances of another.
rdfs:subPropertyOf: all resources related by one property are also related by another.
rdfs:label: to provide a human-readable version of a resource's name.
rdfs:comment: to provide a human-readable description of a resource.
Every individual in the OWL world (http://www.w3.org/ TR/2004/REC-owl-guide-20040210/) is a member of the class owl:Thing. Thus each user-defined class is implicitly a subclass of owl:Thing. An object property is defined as an instance of the built-in OWL class owl:ObjectProperty. But maybe the most important term from this vocabulary is the property owl:sameAs, which enables connections between different ontologies.
From (http://www.w3.org/2003/01/geo/wgs84_pos#) basic Geo vocabulary, we use:
geo:lat: The WGS84 latitude of a SpatialThing (decimal degrees).
geo:long: The WGS84 longitude of a SpatialThing (decimal degrees).
geo:alt: The WGS84 altitude of a SpatialThing (decimal meters).
25
We have re-use OWL-Time ontology (http://www.w3.org/TR/owl-time/) for describe intervals like months or years and re-use some properties and classes from FOAF vocabulary (http://xmlns.com/foaf/spec/):
foaf:depiction: relationship between a thing and an Image that depicts it.
foaf:based_near: relates two "spatial things".
foaf:Image is a sub-class of foaf:Document corresponding to those documents which are images (such as JPEG, PNG, GIF bitmaps, SVG diagrams etc.)
The Dublin Core vocabulary (http://dublincore.org/documents/dcmi-terms/) term isPartOf: a related resource in which the described resource is physically or logically included. But the most important terms from Dublin Core vocabulary are those related to author and publication data, which despite its importance, are not exploited in this work, since we are focusing on the functionality.
TISC vocabulary (http://observedchange.com/tisc/ns/) is useful for describing a building:
tisc:northOf: an abstract property to express that an object is North of another (same for the rest of cardinalities).
tisc:nextTo: an abstract property to express that an object is next to another.
tisc:locatedAt: an abstract property to express that an object is located at somewhere.
tisc:areasize: an abstract property to express the size of the area of an object.
tisc:hasWidth: an abstract property to express that an object has certain width.
tisc:happensAt: a predicate to state when something happens
We have used some of DBpedia concepts and properties (http://wiki.dbpedia.org/About):
dbpp:buildingType: an rdf property defining the building type.
dbpprop:use: an rdf property defining the use of something.
dbpprop:orientation: an rdf property defining the orientation of something.
26
AemetLinked Data (.es) is an open initiative publishing diverse information sources belonging to the Spanish Meteorological Agency (http://aemet.linkeddata.es/ index_en.html). We re-use this effort to describe weather data for the needs of our model:
aemetonto:observedInInterval:
ssn:observedProperty:
aemetonto:valueOfObservedData:
aemetonto:stationName:
aemetonto:WeatherStation:
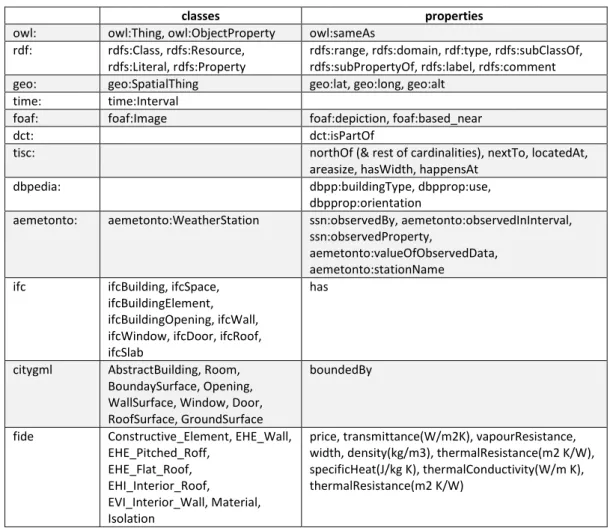
classes properties
owl: owl:Thing, owl:ObjectProperty owl:sameAs rdf: rdfs:Class, rdfs:Resource,
rdfs:Literal, rdfs:Property
rdfs:range, rdfs:domain, rdf:type, rdfs:subClassOf, rdfs:subPropertyOf, rdfs:label, rdfs:comment geo: geo:SpatialThing geo:lat, geo:long, geo:alt
time: time:Interval
foaf: foaf:Image foaf:depiction, foaf:based_near
dct: dct:isPartOf
tisc: northOf (& rest of cardinalities), nextTo, locatedAt, areasize, hasWidth, happensAt
dbpedia: dbpp:buildingType, dbpprop:use, dbpprop:orientation
aemetonto: aemetonto:WeatherStation ssn:observedBy, aemetonto:observedInInterval, ssn:observedProperty,
aemetonto:valueOfObservedData, aemetonto:stationName
ifc ifcBuilding, ifcSpace, ifcBuildingElement, ifcBuildingOpening, ifcWall, ifcWindow, ifcDoor, ifcRoof, ifcSlab
has
citygml AbstractBuilding, Room, BoundaySurface, Opening, WallSurface, Window, Door, RoofSurface, GroundSurface
boundedBy
fide Constructive_Element, EHE_Wall, EHE_Pitched_Roff,
EHE_Flat_Roof, EHI_Interior_Roof,
EVI_Interior_Wall, Material, Isolation
price, transmittance(W/m2K), vapourResistance, width, density(kg/m3), thermalResistance(m2 K/W), specificHeat(J/kg K), thermalConductivity(W/m K), thermalResistance(m2 K/W)
Table 1.- Summary of re-used terms
27
(http://www.buildingsmart-tech.org/ifc/IFC2x3/TC1/html/ifcproductextension/lexical/). We have used these definitions to characterize the elements described in our model as building elements and their relations in order to provide a building description which can be extended later for other purposes in a standard way. Based on IFC model, FIDE is a national initiative modelling buildings. The national catalogue of constructive systems uses it, so we have adopted its terms to define constructive systems.
In the other hand, CityGML is a common information model, developed by OGC, for the representation of 3D urban objects. It defines the classes and relations for the most relevant topographic objects in cities and regional models with respect to their properties (http://www.citygml.org/index.php?id=1538). We define our building model re-using this vocabulary also, for the same reasons as the IFC model.
In Table 1 we summarize the classes and properties re-used that allow an interlinking between existing resources and new descriptions. This avoids duplicity of terms.
3.1.2.
LODBLESS vocabulary
Other classes, resources and properties are specific of this work and have to be defined by ourselves. We rely on previous vocabularies to define new ones.
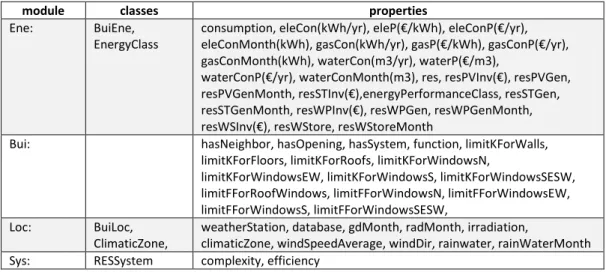
module classes properties
Ene: BuiEne, EnergyClass
consumption, eleCon(kWh/yr), eleP(€/kWh), eleConP(€/yr), eleConMonth(kWh), gasCon(kWh/yr), gasP(€/kWh), gasConP(€/yr), gasConMonth(kWh), waterCon(m3/yr), waterP(€/m3),
waterConP(€/yr), waterConMonth(m3), res, resPVInv(€), resPVGen, resPVGenMonth, resSTInv(€),energyPerformanceClass, resSTGen,
resSTGenMonth, resWPInv(€), resWPGen, resWPGenMonth,
resWSInv(€), resWStore, resWStoreMonth
Bui: hasNeighbor, hasOpening, hasSystem, function, limitKForWalls, limitKForFloors, limitKForRoofs, limitKForWindowsN,
limitKForWindowsEW, limitKForWindowsS, limitKForWindowsSESW, limitFForRoofWindows, limitFForWindowsN, limitFForWindowsEW, limitFForWindowsS, limitFForWindowsSESW,
Loc: BuiLoc, ClimaticZone,
weatherStation, database, gdMonth, radMonth, irradiation,
climaticZone, windSpeedAverage, windDir, rainwater, rainWaterMonth Sys: RESSystem complexity, efficiency
Table 2.- Summary of new terms
28
existing in previous vocabularies, and their properties. In Table 2 we see the new classes and properties that are linked between themselves and re-used resources and descriptions.
The energy module takes into account all concepts related to the energy consumption, classification and generation of a building, not existing in others vocabularies. It is composed of two classes and 31 properties defined with the terms described in the previous section (http://www.anasanhue.hostzi.com/joomla/index.php/en/projects/ information-technologies/92-lodblessene).
ene:BuiEne: an ObjectProperty class collecting all energy data from a building.
ene:EnergyClass: an ObjectProperty class for the energy performance of a building.
ene:consumption: a building property attaching it to a BuiEne.
ene:eleCon: a BuiEne property defining the electricity consumption in kWh/yr as a Literal (also for gas and water – in m3/yr).
ene:eleP: a BuiEne property defining the electricity price in €/kWh as a Literal (also
for gas and water –€/m3).
ene:eleConP: a BuiEne property defining the electricity consumption in €/yr as a
Literal (also for gas and water).
ene:eleConMonth: a BuiEne property defining the electricity consumption in a month interval in kWh as a Literal (also for gas and water – in m3).
ene:res: a BuiEne property stating the use of a RES by a building.
ene:resPVSystem: a BuiEne property stating the RESsystem for PV installation used (also for solar thermal, wind power and water storage installations).
ene:resPVInv: a BuiEne property defining the investment price of a PV installation in
€ as a Literal (also for solar thermal, wind power and water storage installations). ene:resPVGen: a BuiEne property defining the electricity generated by a PV
installation in kWh/yr as a Literal (also for solar thermal, wind power and water storage installations).
ene:resPVGenMonth: a BuiEne property defining the electricity generated by a PV installation in a month interval in kW as a Literal (also for solar thermal, wind power and water storage installations).
29
The building module includes all concepts related to the building organization and composition, not existing in others vocabularies. It is composed of 16 properties defined with the terms described in the previous section.
bui:hasNeighbor: a ifcSpace or Room property stating its ifcSpace or Room neighbor.
bui:hasOpening: a ifcBuildingElement or BuondarySurface property stating its ifcBuildingOpening or Opening.
bui:hasSystem: a ifcSpace or Room, ifcBuildingElement or BuondarySurface, or ifcBuildingOpening or Opening property stating its Constructive_Element.
bui:limitKForWalls: a ifcWall or WallSurface property defining its limit transmittance value as a Literal (also for the rest of functions).
bui:function: a ifcBuildingElement or BuondarySurface, or ifcBuildingOpening or Opening property stating if they are ifcWall, ifcRoof, ifcSlab, ifcWindow or ifcDoor or WallSurface, RoofSurface, GroundSurface, Window or Door.
bui:limitFForWindowsSESW: a ifcWindow or Window with SE or SW orientation property defining its limit solar factor value as a Literal (also for Doors and other orientations).
The location module takes into account all concepts related to the location characteristics and parameters present around the building, mostly weather and climate observations, not existing in others vocabularies. It is composed of two classes and 10 properties defined with the terms described in the previous section.
loc:BuiLoc: an ObjectProperty class collecting all location data from a building.
loc:ClimaticZone: an ObjectProperty class defining the climatic zone of a building.
loc:weatherStation: a BuiLoc property defining its related WeatherStation.
loc:database: a BuiLoc property defining its related Database.
loc:gdMonth: a BuiLoc property defining its grades-day in base 20 for a month interval in grades as a Literal.
loc:radMonth: a BuiLoc property defining its received radiation for a month interval in kWh/m2 as a Literal.
loc:irradiation: a BuiLoc property for received radiation in kWh/m2yr as a Literal.
loc:climaticZone: a BuiLoc property stating its ClimaticZone.
30
loc:windDir: a BuiLoc property defining its dominant wind direction as a Literal.
loc:rainwater: a BuiLoc property defining received rain in m3/m2yr as a Literal.
loc:rainWaterMonth: a BuiLoc property defining its received rain water in a month interval in m3/m2 as a Literal.
The systems module comprises all concepts related to the systems composition and functionality, affecting their efficiency and performance, not existing in others vocabularies. It is composed of one class and two properties defined with the terms described in the previous section.
sys:RESSystem: a class describing a renewable energy resource system asigned to a ifcSpace or Room by the hasSystem Property.
sys:complexity: a RESSystem or Constructive_System property defining its mounting complexity (it may be differently defined for each system type) as a Literal.
sys:efficiency: a RESSystem property defining its performance efficiency.
3.2.
Conceptual model
For running this model, first step is discovering and/or accessing data. We need, as seen in previous section, several location-based kinds of data, and, since we can imagine other data useful for other applications, we will try to structure data in a way that our data can be reused for other implementations, just by accessing it and maybe adding some new data into our model.
3.2.1.
Location data
The most important data from each location for our project are those related to the terrain on which we are building our building, and the climatic characteristics of its environment.
Soil data, with its types and internal temperatures could be very useful for geothermal installations providing energy to buildings. Nevertheless, in this work, we are not exploiting this field, but those related to energy efficiency strategies related to climatic conditions.
31
parcel ID, which also has some coordinates, in this case forming a polygon; or as a simple place name, much more uncertain location, but related to a position too.
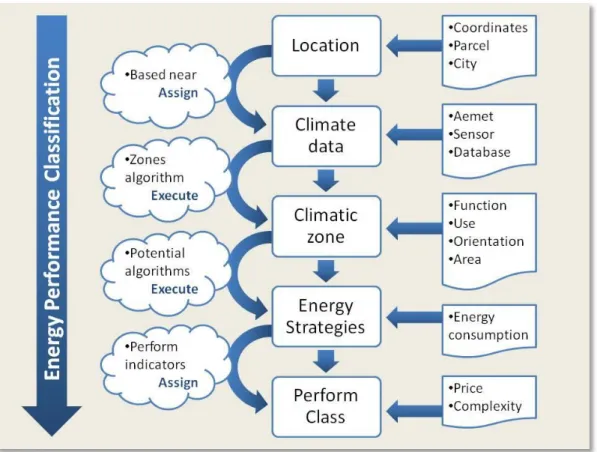
Figure 1.- Climate data
Attached to this location, a sensor (or a set of them) will provide weather data. LocSensor in this model can be one of those installed and defined by Aemet or any other sensor measuring climatic data. Finally, when no sensor is available relatively close to a location, we can use historic data stored in a database.
Sensors will provide data about certain climatic properties. LocProp can be all those defined by Aemet, and also other ones interesting for our research field, that will lead us to classify our location in one of the theoretical zones (LocClimaticZone) that rule some energy efficiency strategies parameters (LocParameters) although other ones are directly got from LocProps. These parameters are then related to the building location.