SCALES FOR MEASURING PERCEIVED RISK IN
E-COMMERCE - TESTING INFLUENCES ON
RELIABILITY
PhD Student Patricea Elena BERTEA University “A. I. Cuza” Iasi
Abstract:
The present study analyzes the importance of research design in measuring perceived risk in e-commerce by revealing the influences that certain variables might have on the reliability of scales. Perceived risk is known as a major behavioral determinant, moreover it has been found to be a barrier against e-commerce adoption. This is why it is important for marketing researchers to have reliable measurement instruments. By performing a meta-analysis on 19 papers that developed scales for perceived risk in e-commerce, we aimed to identify what research design characteristics can determine the increase or decrease of alpha Cronbach estimates. Results were mixed, as only one of four hypotheses was supported. However, important issues for further research have been discovered here, being of great relevance for academics as well as for practitioners.
Keywords: perceived risk, scale measurement, reliability coefficient, e-commerce
Introduction
The first step for the development of a perceived risk theory in Marketing was taken by Bauer (1960) who proposed that we should analyze consumer behavior as risk handling activity. Ever since, a lot of literature emerged examining perceived risk in the offline environment as well as in the online. How perceived risk affects shopping behavior has been a research question that has motivated many researchers in their activity. Cox and Rich (1964) argued that perceived risk is a major behavioral determinant and further studies have proved it. A really important issue for marketing academics as wells as practitioners has been the measurement of the concept, since it is a latent variable that cannot be observed.
Over the years different methodologies have been employed. Cunnigham (1967) measured perceived risk by dividing it into a probability of loss component and an importance loss
component that were multiplied to obtain the overall risk. Jacoby and Kaplan (1972) brought strong arguments for perceived risk to be divided into five dimensions: social, psychological, physical, performance and financial risk. They used one question for each dimension measured on a Likert scale and afterwards they used a linear multiple regression model to predict overall risk. Peter and Tarpey (1975) mixed the previous methodologies and measured perceived risk on six dimensions – they added to the five types of risks another one: time risk (Roselius, 1971) – each dimension being assessed on the two component system: probability of loss (PL) and importance of loss (IL):
∑
=
=
ni
ij ij
IL
PL
f
OPR
1
*
(1)where OPR – overall risk, n – facets of perceived risk
However, Mitchell (1999), after analyzing the most important models dealing with perceived risk, proposes that the concept could be better measured by multiple-item scales. The proposal was well received because the consumer behavior has changed over the years and got more complex and as a consequence perceived risk developed new dimensions. A very good example is offered by the emergence of e-commerce which has brought three more dimensions of perceived risk: privacy risk, security risk and source risk, also known as e-retailer’s risk. So, if in traditional shopping the consumer had to deal with six types of risk, in Internet shopping the number of dimensions increased and consumer behavior has become more difficult to study.
The importance of having reliable measures for perceived risk in e-commerce cannot be questioned, seen that this segment of the retail industry has developed a lot in the last decade. Most of the researchers studying perceived risk in e-commerce have employed the methodology advised by Mitchell (1999), yet few have been strict about scale reliability and validity. Moreover, it seems that there is a trend among them to develop new scales for perceived risk in e-commerce and not to use already built scales, validated by other studies. This can be explained, on one hand, by the fact that they analyze different buying situations and they need a more specific measure for perceived risk or, on the other hand, by the fact that they might not be content with the accuracy of others works. Since there are doubts about how other researchers measured perceived risk in e-commerce, the present study aims to clarify aspects concerning scales reliability.
The main objective of this study is to analyze the reliability of different scales developed to measure perceived risk in e-commerce by testing for influences that come from the research
methodology used when assessing perceived risk. By doing a meta-analysis on 19 papers that used multiple-item scales to measure perceived risk, we want to identify the influence that sample type, sample size, number of item scales and number of measurement point have on the reliability coefficients reported by the authors. This methodology is consistent with other studies (Churchill and Peter, 1984; Peterson, 1994), yet it has never been used to analyze reliability of e-commerce perceived risk scales. The next chapters of the paper will make a description of the most relevant scales that were created to measure perceived risk in e-commerce, scales that resulted from accurate methodologies and that could be useful for other researchers; a separate chapter will be dedicated to perform the meta-analysis and a last chapter for conclusions.
Scales for measuring perceived risk in e-commerce
one can test the reliability and validity of the construct, thus having a more accurate profile of the consumer. This way it is easier to distinguish which dimensions of risk is more prominent in the consumer’s behavior, if he is more influenced by social risk or by financial risk.
Most of the research work dealing with perceived risk in e-commerce has
an approach similar to the one suggested by Mitchell (1999). Tan (1999) was among the ones that adopted a new methodology in measuring perceived product risk with statements reflecting the consumer’s behavior (see table 1). Using a 6 point Likert scale anchored “very unlikely – very likely”, Tan (1999) reported a 0.6194 alpha Cronbach coefficient.
Table 1 Scale for measuring perceived risk
Product risk statements The product would fail to perform to my satisfaction.
I would incur low maintenance costs.
My friends and relatives would think more highly of me if I buy this product.
I would pay a competitive price for this product.
The product fits well my image.
Using the product will not cause danger to my health or safety.
Source: Tan, S. J. (1999), Strategies for reducing consumers’ risk aversion in Internet shopping, Journal of Consumer Marketing 16(2)
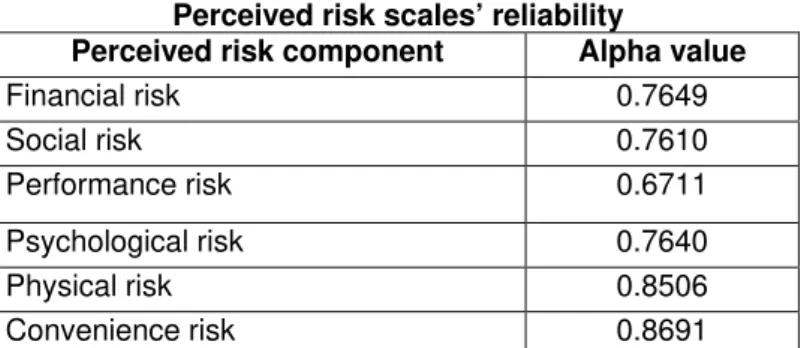
A more developed study belongs to Pires et al.(2004) who applied the same dual component methodology – probability and importance of loss, but with multi-items assessment of the six traditional dimensions of perceived risk. There were a total of 24 statements that illustrated specific situations in relation
with Internet purchasing. A five point Likert scale was used to measure both components. Pires et al. (2004) reported reliability coefficients for the scales developed which ranged from 0.6711 for performance risk to 0.8691 for convenience risk (table 2).
Table 2
Perceived risk scales’ reliability
Perceived risk component Alpha value
Financial risk 0.7649
Social risk 0.7610
Performance risk 0.6711
Psychological risk 0.7640
Physical risk 0.8506
Convenience risk 0.8691
Source: Pires, G.; Stanton, J. & Eckford, A. (2004), 'Influences on the Perceived Risk of Purchasing Online', Journal of Consumer Behaviour, 4
As perceived risk is influenced by product type, Featherman and Pavlou (2003) responded to the need of developing a specific scale for
perceived risk and the overall risk. The reliability coefficients are presented in table 3. The authors also performed a
SEM analysis and obtained convergent and discriminant validity of the scale.
Table 3 Cronbach alpha coefficients for perceived risk facets scales
Perceived risk component Alpha value
Time risk 0.796
Psychological risk 0.891
Privacy risk 0.857
Financial risk 0.857
Performance risk 0.797
Social risk 0.814
Overall risk 0.850
Source: Featherman, M. S. & Pavlou, P. A. (2003), Predicting e-services adoption: a perceived risk facets perspective, International Journal of Human-Computer Studies 59(4)
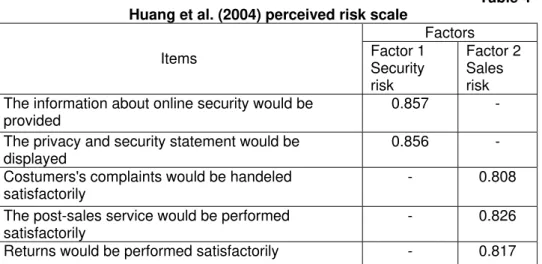
Another study that aimed to measure perceived risk through multiple statements obtained by qualitative research belongs to Huang et al. (2004). The 14 items rated on a 7-point Likert scale were pretested. By
performing a reliability analysis and afterwards a factorial one, the scale was reduced to five items, three composing the perceived risk sales risk and two the security risk (table 4).
Table 4 Huang et al. (2004) perceived risk scale
Factors
Items Factor 1
Security risk
Factor 2 Sales risk The information about online security would be
provided
0.857 -
The privacy and security statement would be displayed
0.856 -
Costumers's complaints would be handeled satisfactorily
- 0.808
The post-sales service would be performed satisfactorily
- 0.826
Returns would be performed satisfactorily - 0.817
Source: Huang, W.-Y.; Schrank, H. & Dubinsky, A. J. (2004), 'Effect Of Brand Name On Consumers' Risk Perceptions Of Online Shopping', Journal of Consumer Behaviour 4(1)
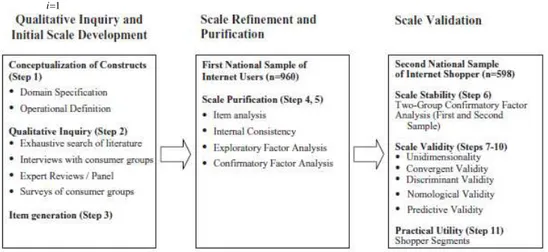
A significant contribution to the literature studying measurement of perceived risk was brought by Forsythe et al. (2006) who had as a research objective the development of a scale to measure perceived risks and perceived benefits of online shopping. For both
validity. The operational definition of perceived risk construct was as follows:
OPR =
∑
, where OPR – overall perceived risks, PL – perception of loss (2) =n
i i
PL
1
Figure 1. Scale development and validation process
Source: Forsythe et al. (2006), Development of a Scale to Measure the Perceived Benefits and Risks of Online Shopping, Journal of Interactive Marketing, 20(2), p.58
The qualitative stage revealed potential dimensions for perceived risk in online shopping such as product quality, security, privacy, technology difficulty, time delay, lack of human contact, extra costs, and reliability of information, bad experience and lack of confidence. From a number of 33 items the scale was reduced to 23 items after operating the reliability analysis. The new construct was submitted to an
exploratory factor analysis that reduced the number of statements to 16 grouped into three factors (table 5). Convergent validity was supported by the confirmatory factor loadings that ranged from 0.56 to 0.88, being higher than 0.50. Discriminant validity was assessed based on low factors loadings with unintended constructs (lower than 0.4) and the low correlation between constructs (ranged from 0.49 to 0.65).
Table 5 Scale items with factors loadings and reliability
Perceived Risks of Shopping Online Factor Loading APLHA Financial Risks
Can't trust the online company May not get the product
May purchase something by accident My personal information may not be kept I may not get what I want
My credit card number may not be secure Might be overcharged
0.879 0.872 0.770 0.732 0.697 0.681 0.677
0.892
Product Risk
Can't examine the actual product Size may be a problem with clothes Try on clothing online
Inability to touch and feel the item Must pay for shipping and handling Must wait for merchandise to be delivered
0.857 0.847 0.776 0.700 0.676 0.644
Time/Convenience Risk
Too complicated to place order Difficult to find appropriate websites Pictures take too long to come up
0.838 0.773 0.557
0.738
Source: Forsythe et al. (2006), Development of A Scale to Measure The Perceived Benefits And Risks Of Online Shopping, Journal of Interactive Marketing, 20(2)
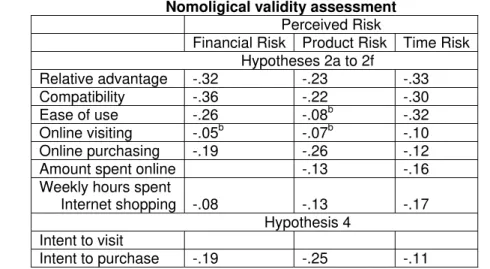
An important accomplishment of Forsythe et al. (2006) was the assessment of nomological validity (table 6). The authors tested the relationships between perceived risk
and variables such as: perception of Internet as a shopping environment, frequency of purchase, amount spent, frequency of online visiting and time spent for online shopping.
Table 6 Nomoligical validity assessment
Perceived Risk
Financial Risk Product Risk Time Risk Hypotheses 2a to 2f
Relative advantage -.32 -.23 -.33
Compatibility -.36 -.22 -.30
Ease of use -.26 -.08b -.32
Online visiting -.05b -.07b -.10
Online purchasing -.19 -.26 -.12
Amount spent online -.13 -.16
Weekly hours spent
Internet shopping -.08 -.13 -.17
Hypothesis 4
Intent to visit
Intent to purchase -.19 -.25 -.11
Source: Forsythe et al. (2006), Development of a Scale to Measure the Perceived Benefits and Risks of Online Shopping, Journal of Interactive Marketing, 20(2), p.69
As one could easily see from the descriptions provided above, the scales for measuring perceived risk in e-commerce were developed for specific situations. For instance, Featherman and Pavlou (2003) created one for e-services, while Forsythe et al. (2006) created it for products purchased online. So, we can conclude that researchers could use these already developed scales as long as they are appropriate for their research situation; if not, they should develop new measures and take as a benchmark the methodology used by Forsythe et al. (2006).
Research methodology
The present study analyzed a number of 19 papers that developed
scales for measuring perceived risk in e-commerce. All papers date from 1999 to 2009 and had as main research objectives either to specifically develop a scale for e-commerce perceived risk or to investigate the relationship between perceived risk in e-commerce and other variables.
Hypotheses
The research hypotheses are based on the previous work of Churchill and Peter (1984), who examined psychometric properties of different scales from marketing research, such as personality scales, purchase influence, satisfaction, self-concept, role perceptions. As their study is considered a reference point for the study of influences of research design characteristics on the magnitude of the reliability coefficient, there is need to detail their work. So, Churchill and Peter (1984) investigated three categories of design variables: sampling variables, measure variables and measurement development process variables. In the first category they included number of samples, sample size, response rate, nature of sample, type of subjects, data collection method and type of research; the second category was formed by number of items in final scale, number of dimensions, difficulty of items and reverse scoring; the last category had three investigated variables: procedures used to generate items, a priori specification of dimensions, empirically investigated dimensionality and agreement between initial and final dimensions.
Since the papers that we reviewed did not contain very specific details about scale development methodology, it was not possible to run the analysis on all the variables that Churchill and Peter (1984) previously studied. As a consequence, we looked for congruence in reported research design variables when we selected the papers – 5 studies were dropped out, remaining with the 19 already mentioned papers.
These papers allowed us to do the analysis on a number of four research design variables: number of scale items, number of measurement points, sample size and subject-type.
Our research hypothesis are consistent with the work of Churchill and Peter (1984), however they are applied
on a specific type of scale: multiple-item scale for measuring perceived risk in e-commerce.
The first hypothesis to be tested concerns the influence that the number of scale items has on the reliability coefficient. Peter and Churchill (1984) found that there is a significant positive relationship between number of scale items and alpha Cronbach coefficient.
H1: The number of scale items and level of internal consistency have a significant positive correlation.
The second hypothesis concerns the relationship between measurement scale points and the reliability coefficient, which was previously found to be significant and positive. All the scales employed in the analysis used Likert type scales varying from 5 to 9 points.
H2: The number of measurement points and level of internal consistency are positively correlated.
Even though Churchill and Peter (1984) found that the relationship between sample size and reliability estimates was not very strong, we are going to test this hypothesis as well.
H3: Sample size and internal consistency are negatively correlated.
The last hypothesis deals with the effect that subject type has on alpha Cronbach measures. This hypothesis was rejected by Churchill and Peter (1984), still we believe that it is important to test for the case of perceived risk scales in e-commerce.
H4: There is difference in reliability coefficients across sample types. Student samples should evince higher scale reliabilities than should non-college student samples.
Data analysis
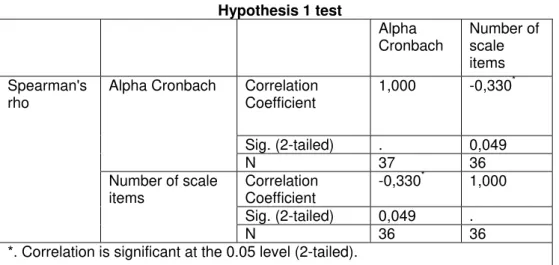
Table 7 Hypothesis 1 test
Alpha
Cronbach
Number of scale items Correlation
Coefficient
1,000 -0,330*
Sig. (2-tailed) . 0,049 Alpha Cronbach
N 37 36
Correlation Coefficient
-0,330* 1,000
Sig. (2-tailed) 0,049 . Spearman's
rho
Number of scale items
N 36 36
*. Correlation is significant at the 0.05 level (2-tailed).
The first hypothesis was not supported (table 7). We did find a correlation between the number of items and the alpha Cronbach coefficient; however, it was in the wrong direction. As described in table no. 7, the relationship between the two variables is significant, but negative. This suggests that the less number of items we have, the larger the reliability estimates would be. The explanation of
this result could be that more than almost 40% of the scales analyzed are formed by 3 or 2 items (fig. no. 2), so the results could be biased. Another problem could be the sample dimension. Peter and Churchill (1984) as well as Peterson (1993) used samples larger than 100 studies and had variation for the measured characteristics.
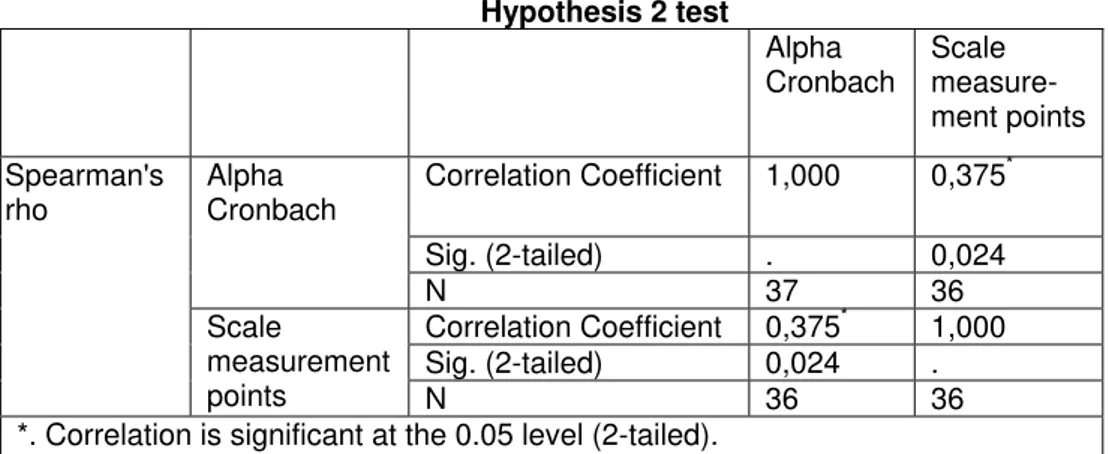
The second hypothesis was supported by the results. As seen in table no. 8, there is a positive correlation between reliability estimates and number of measurement points. The relation is significant, sig= 0,024 being lower that the threshold of 0,05.
This means that the more variation we allow in the scale the higher the reliability estimates. For instance, for the 5-point Likert scale the mean alpha Cronbach was 0,758, while for the 7-point Likert scale the mean estimate was 0.841.
Table 8 Hypothesis 2 test
Alpha
Cronbach
Scale measure-ment points
Correlation Coefficient 1,000 0,375*
Sig. (2-tailed) . 0,024
Alpha Cronbach
N 37 36
Correlation Coefficient 0,375* 1,000 Sig. (2-tailed) 0,024 . Spearman's
rho
Scale
measurement
points N 36 36
*. Correlation is significant at the 0.05 level (2-tailed).
As far as the third hypothesis is concerned, it was not supported (table 9). Sample size does not influence
reliability of the scales - sig=0,058 registered a higher value than the established level of significance 0,05.
Table 9 Hypothesis 3 test
Alpha
Cronbach
Sample size Correlation coefficient 1,000 0,315
Sig. (2-tailed) . 0,058
Alpha Cronbach
N 37 37
Correlation coefficient 0,315 1,000
Sig. (2-tailed) 0,058 .
Spearman's rho
Sample size
N 37 37
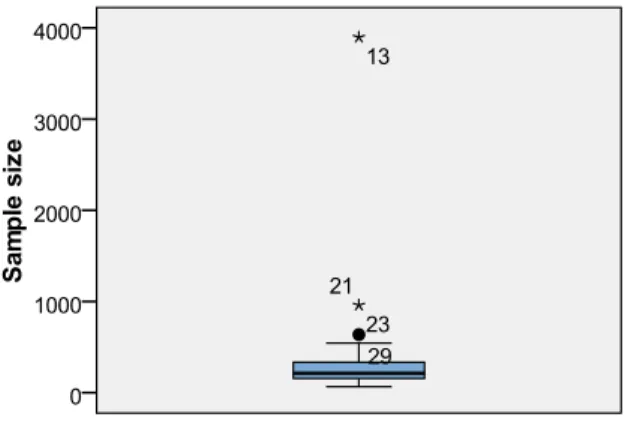
This result can be explained by the fact that there were many outliers (figure 3) introduced in the analysis. Although Howitt and Cramer (2008)
Figure 3. Box-plot sample size variable So, we eliminated from the
analysis observation number 13, which had the highest value for the sample size – 3897 subjects and we performed the analysis once more. In this case, we
found the correlation to be significant at the level of 0.05 (table 10), however it was a positive relationship, not negative. In conclusion, the hypothesis was not supported.
Table10 Correlation analysis without outlier no. 13
Alpha
Cronbach
Sample size Correlation
Coefficient
1,000 0,337*
Sig. (2-tailed) . 0,044
Alpha Cronbach
N 36 36
Correlation Coefficient
0,337* 1,000
Sig. (2-tailed) 0,044 .
Spearman's rho
Sample size
N 36 36
*. Correlation is significant at the 0.05 level (2-tailed).
For testing the last hypothesis we used the non-parametric test Mann-Whitney (table 11), since the research
design did not fulfill the restrictions for a t-test analysis.
Table 11 Test Statisticsb
Alpha Cronbach
Mann-Whitney U 80,500
Wilcoxon W 356,500
Z -2,522
Asymp. Sig. (2-tailed) 0,012
Exact Sig. [2*(1-tailed Sig.)] 0,010a a. Not corrected for ties.
b. Grouping Variable: Sample type
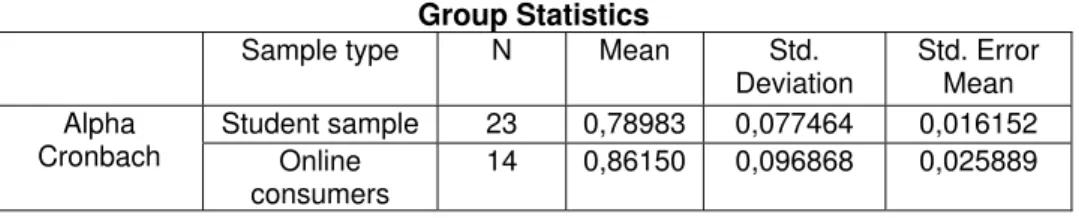
The hypothesis was partially supported in the sense that the test showed there are differences in reliability estimates across sample
our hypothesis that must be rejected. Student samples do not provide higher
reliability when measuring perceived risk in e-commerce.
Table 12 Group Statistics
Sample type N Mean Std.
Deviation
Std. Error Mean
Student sample 23 0,78983 0,077464 0,016152
Alpha
Cronbach Online
consumers
14 0,86150 0,096868 0,025889
Moreover, as one can see in table 13 the lower and upper bounds of Alpha Cronbach coefficients are higher in the
case of online consumers’ samples than they are in the case of students’ samples.
Table 13 Descriptive Statistics
Online consumers
N Minimum Maximum Mean Std. Deviation
Alpha Cronbach 14 0,630 ,969 0,86150 0,096868
Students N Minimum Maximum Mean Std. Deviation
Alpha Cronbach 23 0,600 0,891 0,78983 0,077464
Conclusions
From the four hypotheses tested only one was supported by the data. The main problem was due to the small number of observations. Further research could apply the same methodology for perceived risk scales no matter the domain in order to have a larger sample. The fact that we limited the area only to e-commerce perceived risk scales affected our results. Nevertheless, we found important aspects that could help researchers who want to develop scales for measuring perceived risk in online
shopping. First of all, higher reliability scores can be obtained by allowing more variation of the measurement scale. Second, the use of online consumers’ samples is more appropriate than students’ samples. As sample size effect was not clear, it could be interesting to see if the reliability increases when a researcher develops a scale on a small sample and afterwards validates it on a larger sample. This calls for further research as well as the issue of number of items per scale.
REFERENCES
Bauer, R. A. (1960), Consumer Behavior As Risk Taking, In D. Cox (ed.), Risk Taking and Information Handling in Consumer Behavior, Harvard University Press, pp. 23-34.
Churchill, G. A. & Peter, J. P. (1984), 'Research Design Effects on the Reliability of Rating Scales: A Meta-Analysis', Journal of Marketing Research 21(4), 360-375.
Cocosila, M.; Archer, N. & Yuan, Y. (2009), Early Investigation of New Information Technology Acceptance: A Perceived Risk - Motivation Model, in 'Communications of the Association for Information Systems'.
The Case of Telephone Shopping', Journal of Marketing Research 1(4), 32--39.
Cunningham, S. M. (1967), The Major Dimensions Of Perceived Risk, In D. Cox (ed.), Risk Taking and Information Handling in Consumer Behavior, Harvard University Press, pp. 82-109.
Eggert, A. (2006), 'Intangibility and Perceived Risk in Online Environments', Journal of Marketing Management 22(5/6), 553 - 572.
Featherman, M. S. & Pavlou, P. A. (2003), 'Predicting e-services adoption: a perceived risk facets perspective', International Journal of Human-Computer Studies 59(4), 451 - 474.
Featherman, M. S. & Wells, J. D. (2004), The Intangibility of E-Services: Effects on Artificiality, Perceived Risk, and Adoption, in 'Proceedings of the 37th Hawaii International Conference on System Sciences'.
Forsythe, S.; Liu, C.; Shannon, D. & Gardner, L. C. (2006), 'Development Of A Scale To Measure The Perceived Benefits And Risks Of Online Shopping', Journal Of Interactive Marketing 20(2).
Huang, W.-Y.; Schrank, H. & Dubinsky, A. J. (2004), 'Effect Of Brand Name On Consumers' Risk Perceptions Of Online Shopping', Journal of Consumer Behaviour 4(1), 40 - 50.
Im, I.; Kim, Y. & Han, H.-J. (2008), 'The Effects Of Perceived Risk And Technology Type On Users’ Acceptance Of Technologies', Information & Management 45, 1-9.
Jacoby, J. & Kaplan, L. B. (1972), The Components Of Perceived Risk, in 'Proceedings of the Third Annual Conference of the Association for Consumer Research'.
Jarvenpaa, S. L.; Tractinsky, N. & Vitale, M. (2000), 'Consumer trust in an Internet store', Information Technology and Management 1, 45-71.
Li, Y.-H. & Huang, J.-W. (2009), 'Applying Theory of Perceived Risk and Technology Acceptance Model in the Online Shopping Channel', World Academy of Science, Engineering and Technology.
Mitchell, V.-W. (1999), 'Consumer Perceived Risk: Conceptualisations And Models', European Journal of Marketing 33, 163-195(33).
Pavlou, P. A. (2003), 'Consumer Acceptance Of Electronic Commerce: Integrating Trust And Risk With The Technology Acceptance Model', International Journal of Electronic Commerce 7, 69–103.
Peter, J. P. & Tarpey, S. L. X. (1975), 'Behavioral Decision Making: A Comparison of Three Models', Advances in Consumer Research 2(1), 119 -132.
Peterson, R. A. (1994), 'A Meta-Analysis of Cronbach's Coefficient Alpha', The Journal of Consumer Research 21(2), 381-391.
Pires, G.; Stanton, J. & Eckford, A. (2004), 'Influences on the Perceived Risk of Purchasing Online', Journal of Consumer Behaviour 4, 118-131.
Salam, A. F.; Rao, H. R. & Pegels, C. C. (2003), 'Consumer-Perceived Risk in E-Commerce Transactions.', Communications of the ACM 46(12), 325 - 331. Tan, S. J. (1999), 'Strategies for reducing consumers’ risk aversion in Internet
shopping', Journal of Consumer Marketing 16(2), 163-180.