ACPD
13, 6035–6066, 2013ABL and its influence on regional
air quality
M. Wu et al.
Title Page
Abstract Introduction
Conclusions References
Tables Figures
◭ ◮
◭ ◮
Back Close
Full Screen / Esc
Printer-friendly Version Interactive Discussion
Discussion
P
a
per
|
Dis
cussion
P
a
per
|
Discussion
P
a
per
|
Discussio
n
P
a
per
Atmos. Chem. Phys. Discuss., 13, 6035–6066, 2013 www.atmos-chem-phys-discuss.net/13/6035/2013/ doi:10.5194/acpd-13-6035-2013
© Author(s) 2013. CC Attribution 3.0 License.
Atmospheric Chemistry and Physics
Open Access
Discussions
Geoscientiic Geoscientiic
Geoscientiic Geoscientiic
This discussion paper is/has been under review for the journal Atmospheric Chemistry and Physics (ACP). Please refer to the corresponding final paper in ACP if available.
Study on the atmospheric boundary layer
and its influence on regional air quality
over the Pearl River delta
M. Wu1, D. Wu1,2, Q. Fan1, B. M. Wang1, H. W. Li1, and S. J. Fan1
1
School of Environmental Science and Engineering, Sun Yat-sen University, Guangzhou, 510275, China
2
Institute of Tropical and Marine Meteorology, China Meteorological Administration, Guangzhou, 510080, China
Received: 4 February 2013 – Accepted: 14 February 2013 – Published: 7 March 2013
Correspondence to: S. J. Fan ([email protected])
ACPD
13, 6035–6066, 2013ABL and its influence on regional
air quality
M. Wu et al.
Title Page
Abstract Introduction
Conclusions References
Tables Figures
◭ ◮
◭ ◮
Back Close
Full Screen / Esc
Printer-friendly Version Interactive Discussion
Discussion
P
a
per
|
Dis
cussion
P
a
per
|
Discussion
P
a
per
|
Discussio
n
P
a
per
|
Abstract
To study the structure of atmospheric boundary layer (ABL) and its influence on re-gional air quality over the Pearl River delta (PRD), two ABL intensive observations were conducted at Panyu (urban station) and Xinken (non-urban station, near estu-ary) of PRD during October 2004 and July 2006, respectively. Based on the ABL
in-5
tensive observation data analysis, the typical weather condition type associated with poor air quality over PRD could be summarized into two kinds: the warmed period before cold front (WPBCF) and the subsidence period controlled by tropical cyclone (SPCTC). Two typical polluted cases (affected by WPBCF and SPCTC, respectively) and one clean (not-polluted) case were chosen for detail analysis. It was found that
10
the continuously low or calm ground wind would lead to pollutant accumulation. The local circulation, such as sea–land breezes and heat–island circulation, played an im-portant role in these polluted cases. The recirculation was significant in polluted cases; steady transport occurred in the clean case. Ventilation index (VI) was quite different between polluted cases and the clean case: in WPBCF cases, the peak VI was from
15
184 to 3555 m2s−1; on SPCTC days, the peak VI was from 1066 to 4363 m2s−1; on the
clean day, the peak VI was 10 885 m2s−1and much larger than all polluted cases. The
24-h average VI on polluted days was from 169 to 2858 m2s−1and also much smaller
than that of the clean day. VI is a good reference index for pollution judgment. The peak mixing heights were smaller than 700 m in WPBCF cases, and were smaller than
20
800 m in SPCTC cases. During WPBCF polluted case, only surface inversion layer ap-peared. In the period of land breeze, surface inversion layer height was about 50 m, but in the period of sea breeze, surface inversion layer height would increase, and reach the maximum height, which was about 600 m. During SPCTC polluted case, there were several inversion layers that appeared at different heights. The lowest was about 50 m,
25
ACPD
13, 6035–6066, 2013ABL and its influence on regional
air quality
M. Wu et al.
Title Page
Abstract Introduction
Conclusions References
Tables Figures
◭ ◮
◭ ◮
Back Close
Full Screen / Esc
Printer-friendly Version Interactive Discussion
Discussion
P
a
per
|
Dis
cussion
P
a
per
|
Discussion
P
a
per
|
Discussio
n
P
a
per
1 Introduction
As an important impact factor of air quality, many studies have paid attention to the atmospheric boundary layer (ABL) and its influence on air quality. Air quality also was largely controlled by meteorological processes, which control the time and spa-tial scales of their dispersion (Carreras and Pignata, 2001; Cogliani, 2001; Khedairia
5
and Khadir, 2012; Tan et al., 2009; Menut et al., 2005; Grinn-Gofron et al., 2011). In these studies, wind speed and boundary layer height were key variables of boundary layer analysis (Krautstrunk et al., 2000; Davies et al., 2007); the influence on air quality by transport from the surrounding regions to big cities had been estimated (Lin et al., 2011; Wang et al., 2010), and regional emission control become more important than
10
local emission control in some cities (Gao et al., 2011; Schleicher et al., 2012; Zhang et al., 2012).
The detections of boundary layer structures were carried by sodar, RASS (radar acoustic sounding system), and so on, and tethered balloon observations also were carried in some places (Neffet al., 2008; Hanna et al., 2006; Emeis et al., 2004;
Alap-15
pattu and Kunhikrishnan, 2010). Through these observations, it was found that light wind and lower inversion at nighttime in urban areas were very important (Kolev et al., 2000; Sang et al., 2000); the turbulence in nocturnal boundary layer was shown to be weak and intermittent (Pournazeri et al., 2012). The temporary turbulent coupling of the residual layer to the surface layer facilitated the transport of pollutants stored aloft
20
to the surface (Salmond and McKendry, 2002).
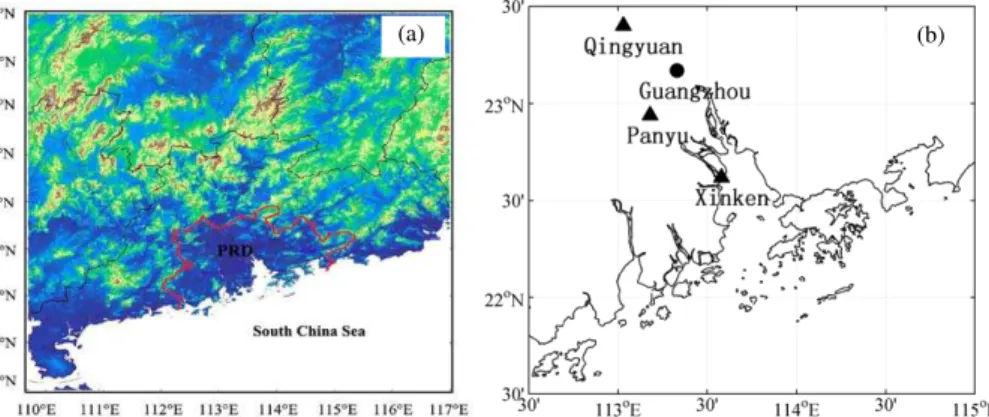
Air pollution in urban areas has become a major issue in the Pearl River delta (PRD), as the pioneer of the reform and opening-up and an important economic hub of China (Chan et al., 2006; Wu et al., 2007). Facing the South China Sea in south, and sur-rounded by mountains from north, east and west (Fig. 1a), the air pollution
meteoro-25
ACPD
13, 6035–6066, 2013ABL and its influence on regional
air quality
M. Wu et al.
Title Page
Abstract Introduction
Conclusions References
Tables Figures
◭ ◮
◭ ◮
Back Close
Full Screen / Esc
Printer-friendly Version Interactive Discussion
Discussion
P
a
per
|
Dis
cussion
P
a
per
|
Discussion
P
a
per
|
Discussio
n
P
a
per
|
tropical cyclone is a very important weather system that influences PRD. The subsi-dence will reduce the ABL height and produce stagnation of surface flow limiting the advection or diffusion of local emitted pollutants (Feng et al., 2007; Wu et al., 2005). The long-range transport from regional pollution source also had an important effect on air pollution in PRD (Ding et al., 2009; Xiao et al., 2006). The synoptic situations
5
and ABL structure over PRD in summer and autumn have been discussed, respec-tively (Fan et al., 2008, 2011). An atmospheric boundary layer concept model of PRD has been built; this concept model shows the relationship between regional air quality and boundary layer meteorological conditions (Fan et al., 2007). Tropical cyclone and continental cold high were typical types of weather conditions responsible for poor air
10
quality of PRD (Chen et al., 2008).
Based on two ABL intensive observations from the Program of Regional Integrated Experiments on Air Quality over Pearl River Delta of China (PRIDE-PRD), this paper studies the structure of ABL and its influence on regional air quality over PRD. First, we analyse these intensive observation data and summarize the weather conditions
15
associated with poor air quality over PRD grouping them into different kinds; second, we chose typical polluted cases and the clean case for a comparative study, focusing on the differences of these typical cases in ground wind, recirculation factor (RF), ven-tilation index (VI), mixing height and the vertical profile. At the end, according to the vertical profile investigation of ABL and local circulation studied, an improved typical
20
model about the structure of ABL associated with poor air quality over PRD was built.
2 Experimental setup and methods
2.1 Experimental setup
The aims of the Program of Regional Integrated Experiments on Air Quality over Pearl River Delta of China (PRIDE-PRD) were to characterize in depth the pollution,
25
ACPD
13, 6035–6066, 2013ABL and its influence on regional
air quality
M. Wu et al.
Title Page
Abstract Introduction
Conclusions References
Tables Figures
◭ ◮
◭ ◮
Back Close
Full Screen / Esc
Printer-friendly Version Interactive Discussion
Discussion
P
a
per
|
Dis
cussion
P
a
per
|
Discussion
P
a
per
|
Discussio
n
P
a
per
atmosphere of PRD in south-eastern China (Zhang et al., 2008). The intensive obser-vations were promoted in October 2004 PRD2004) and July 2006 (PRIDE-PRD2006), respectively. These two months were selected, because October is in the middle of autumn (September–November) and July in the middle of summer (June– August). It was found that some serious pollution episodes often occurred over PRD
5
during these seasons (Wu et al., 2007; Zhang et al., 2008).
During the two intensive observations, the ABL observation used double-theodolite anemometry and radio soundings, and three observational sites were selected: Qingyuan, Panyu and Xinken (Fig. 1b). Panyu is located at about 20 km south of cen-tral Guangzhou, while Qingyuan and Xinken are in a low urbanized environment. In
10
addition to this campaign setup, the surface measurements of nine automatic weather stations were collected, including wind speed, wind direction, temperature and relative humidity.
Qingyuan observation station is located at Qingyuan Meteorological Bureau. Verti-cal measurements were made with meteorologiVerti-cal radar. Mean wind speed and
direc-15
tion, temperature and relative humidity were automatically derived from radio sounding. These parameters were given at 800, 1400 and 2000 BJT between 0 and 2000 m with a vertical resolution of 100 m.
Panyu observation station is located at Panyu Meteorological Bureau. The radio soundings were performed to obtain mean velocity, wind direction and temperature.
20
The position finding system of two optical theodolites was adopted. Radiosondes were launched seven times (06:00, 08:00, 10:00, 14:00, 18:00, 20:00, 23:00 LST) or eleven times (intensive observation,02:00, 06:00, 07:00, 08:00, 10:00, 14:00,17:00, 18:00,
19:00, 20:00, 23:00 LST) per day. Mean wind speed and direction were given between 0 and 2000 m with a vertical resolution of 100 m, while mean temperature with a
verti-25
ACPD
13, 6035–6066, 2013ABL and its influence on regional
air quality
M. Wu et al.
Title Page
Abstract Introduction
Conclusions References
Tables Figures
◭ ◮
◭ ◮
Back Close
Full Screen / Esc
Printer-friendly Version Interactive Discussion
Discussion
P
a
per
|
Dis
cussion
P
a
per
|
Discussion
P
a
per
|
Discussio
n
P
a
per
|
2.2 Methods
In order to describe the feature of ventilation and recirculation in PRD, we adopted two useful methods: ventilation index (VI) and recirculation factor (RF). A brief description of these methods has been given in the following:
Ventilation index (VI), the product of wind speed and ABL height, is a useful tool for
5
air pollution management (Pasch et al., 2011), as shown in Eq. (1).
VI= i=MH
X
i=10
(hi−hi
−1)·vi, (1)
wherei=level at which winds were available,hi=the height of the level (i), andvi=the wind speed of the level (i).
In this paper, VI was computed for each case by using wind data at multiple levels
10
within the mixing layer, along with the ABL height in every observing time. The height of ABL was estimated by temperature profile obtained from Xinken radio sounding mea-surements, the convective ABL height taken as the bottom of the potential temperature increase, and the stable ABL height as the height of the first important variation in the vertical gradient of potential temperature (Dupont et al., 1999).
15
Recirculation factor (RF), the ratio of resultant transport distance to scalar transport distance (wind run), which can be used to infer air parcel movement and the disper-sive characteristics of a given air flow, such as the ventilation, stagnation, or potential recirculation of air (Allwine and Whiteman, 1994). When RF is equal to 1, a straight line, steady transport occurred; when RF is equal to zero, no net transport occurred,
20
ACPD
13, 6035–6066, 2013ABL and its influence on regional
air quality
M. Wu et al.
Title Page
Abstract Introduction
Conclusions References
Tables Figures
◭ ◮
◭ ◮
Back Close
Full Screen / Esc
Printer-friendly Version Interactive Discussion
Discussion
P
a
per
|
Dis
cussion
P
a
per
|
Discussion
P
a
per
|
Discussio
n
P
a
per
RF=
v u u t ∆T
ie
P
is ui
!2
+ ∆T ie
P
is vi
!2
∆T ie
P
is
q u2i +vi2
, (2)
wherei=the time of each data point,is=the time of start data point, ie=the time of
end data point,∆T=the averaging time interval of the data,ui=X-velocity component
by defining the positive x-axis to be north, andvi=Y-velocity component by defining the positive y-axis to be east.
5
Recirculation is an event in which polluted air is initially carried away from the source region but later returns to produce a high pollution episode. In this paper, RF was also calculated for each case by using the vertical observation data of Xinken station. Before obtaining RF, the vertical wind data of different observing times had been interpolated into different hours.
10
3 Weather conditions
To help interpret the influence of weather conditions on regional air quality over PRD, we used surface meteorological data on precipitation, temperature, and wind speed and direction obtained from the Central Meteorological Station of Guangdong province. The air quality conditions during the time of campaigns were evaluated by obtaining
15
daily air pollution index (API) values from the official website of China’s Ministry of Environmental Protection. In China, API is the official index to describe city air quality conditions – the larger the API is, the worse the air quality.
Figure 2a, c, and e give the time series of temperature, wind vectors, precipitation and API at Guangzhou station during October 2004 campaign. During this campaign,
20
ACPD
13, 6035–6066, 2013ABL and its influence on regional
air quality
M. Wu et al.
Title Page
Abstract Introduction
Conclusions References
Tables Figures
◭ ◮
◭ ◮
Back Close
Full Screen / Esc
Printer-friendly Version Interactive Discussion
Discussion
P
a
per
|
Dis
cussion
P
a
per
|
Discussion
P
a
per
|
Discussio
n
P
a
per
|
change in wind and the decrease of temperature successively (Fig. 2a, c). And it is also found that there were two periods with high API (API>100) from 10–17 October and 29–31 October (Fig. 2a). During these high API periods, the wind speed was lower than 1.5 m s−1, and the wind direction reversed frequently, with no prevailing wind direction.
During the other low API days, the wind speed was higher than 3 m s−1 most of the
5
time, and the prevailing wind direction was quite clear. Moreover, there was only one precipitation day at Guangzhou station during the whole of October (Fig. 2e).
Figure 2b, d, and f give the time series of temperature, wind vectors, precipitation and API at Guangzhou station during the July 2006 campaign. During this campaign, there were two tropical cyclones that affected PRD (tropical cyclone Bilis landed in Fujian
10
province on 14 July; tropical cyclone Kaemi landed in Fujian province on 25 July). With the subsidence influence of these tropical cyclones, API and temperature increased dramatically (Fig. 2b, d). It is found that there were two peak API areas in 11–15 July and 21–27 July (Fig. 2b). Similar to the October 2004 campaign, during the high API days, the wind speed decreased and was lower than 1.5 m s−1
most of the time, and
15
no prevailing wind direction existed in July 2006 campaign. During the other days, with the influence after tropical cyclone landed, wind speed increased rapidly, the rain was heavy, API decreased dramatically and air quality got better.
In sum, during the campaign 2004 and campaign 2006, four pollution episodes had been observed as shown in Table 1. Two episodes in autumn corresponded to a cold
20
front, and two episodes in summer corresponded to a tropical cyclone.
According to the weather analysis of four pollution episodes, the main weather type associated with poor air quality over PRD could be summarized into two types: the warmed period before cold front (WPBCF) and the subsidence period controlled by tropical cyclone (SPCTC). In the first type, when PRD was in the warmed period
be-25
ACPD
13, 6035–6066, 2013ABL and its influence on regional
air quality
M. Wu et al.
Title Page
Abstract Introduction
Conclusions References
Tables Figures
◭ ◮
◭ ◮
Back Close
Full Screen / Esc
Printer-friendly Version Interactive Discussion
Discussion
P
a
per
|
Dis
cussion
P
a
per
|
Discussion
P
a
per
|
Discussio
n
P
a
per
accumulate constantly (Feng et al., 2007; Wu et al., 2005). As shown in Table 1, pol-luted days in WPBCF appeared frequently in autumn, and polpol-luted days in SPCTC appeared frequently in summer.
Based on the API and meteorological element characteristic data during the two campaigns, two polluted cases and one clean case were chosen for a detail analysis:
5
16 October 2004 was the typical polluted case associated with WPBCF; 23 July 2006 was the typical polluted case associated with SPCTC; and 26 October 2004 was the clean case for contrast. In the next section, the feature of ABL in these three cases will analysed in detail by observing data obtained from the intensive campaigns.
4 Results and discussion
10
4.1 Wind fields in lower layers of the troposphere
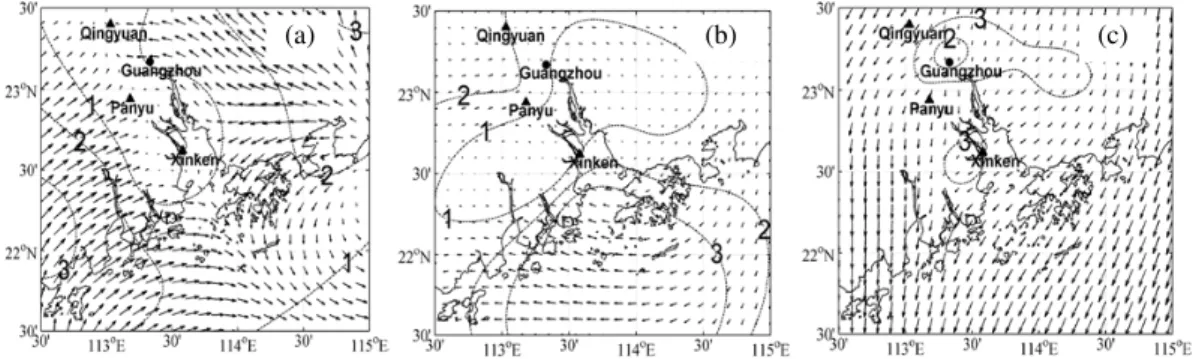
Figure 3 gives the surface wind fields from the main meteorological stations to provide overviews about the features of air flowing conditions in these three cases.
During the WPBCF case (16 October 2004) (Fig. 3a), it is clear the eastern part of PRD was controlled by northeast wind and the west part of PRD was controlled
15
by southwest wind. The predominant wind direction of east PRD was opposite to west PRD. Confrontation of these two air streams gave rise to the calm wind which controlled middle PRD.
During the SPCTC case (23 July 2006) (Fig. 3b), it is clear that north PRD was dom-inated by west wind, and south PRD was domdom-inated by east wind, respectively, which
20
caused the calm wind region to emerge in middle PRD with poor diffusion conditions. During the clean case (26 October 2004) (Fig. 3c), it is clear that almost the whole PRD was controlled by northeast wind, and the wind speed was very strong.
In conclusion, during these two polluted cases, the calm wind region that occurred in middle PRD had an important effect on pollutant accumulation and poor air quality;
ACPD
13, 6035–6066, 2013ABL and its influence on regional
air quality
M. Wu et al.
Title Page
Abstract Introduction
Conclusions References
Tables Figures
◭ ◮
◭ ◮
Back Close
Full Screen / Esc
Printer-friendly Version Interactive Discussion
Discussion
P
a
per
|
Dis
cussion
P
a
per
|
Discussion
P
a
per
|
Discussio
n
P
a
per
|
but during the clean case, the strong wind could transmit and eliminate air pollutants effectively. Therefore, the air quality became better.
4.2 Vertical wind profile and balloon trajectory distribution features
Figure 4 gives the vertical wind profile and balloon trajectory on 16 October 2004 while PRD was affected by WPBCF. It is found that there were two wind shears that appeared
5
on the height 500 m and 1000 m at Xinken station and Panyu station, respectively, that divided the vertical wind profiles into three different levels: 0–500 m, 500–1000 m and above 1000 m (Fig. 4a, b). At each level, the vertical wind profile had remarkable discrepancy between daytime and nighttime.
At Xinken station, the sea–land breezes were significant (Fig. 4a). At low level
10
(0–500 m), land breeze emerged at 06:00 LST, and the wind direction was northerly. The wind speed was low for the land breeze opposite to the system wind, and land breeze was maintained at about 9 h. At 17:00 LST, sea breeze emerged gradually, while the wind speed increased and the wind direction veered to southeast. Due to the sea breeze front, a vertical wind shear appeared and reached up to 500 m height
15
at 23:00 LST. At middle level (500–1000 m) (Fig. 4a), the diurnal variation of wind profile was quite opposite to low level. From 06:00 LST to 14:00 LST, the wind speed increased at this level, which corresponded to the sea breeze circumfluence, and the dominant wind direction was northeast. After 17:00 LST, influenced by the land breeze circum-fluence, the wind speed decreased and the wind direction veered to the northwest. At
20
high level (above 1000 m) (Fig. 4a), wind was very strong at all the observation times, and the wind direction was northeast most of the time, sometimes veered to north.
At Panyu station (Fig. 4b), the influence of heat–island circulation was relatively sig-nificant, while the sea–land breezes also cannot be ignored. At low level, the wind direction was northeast at 07:00 LST, while the wind speed was lower than 3 m s−1
,
25
ACPD
13, 6035–6066, 2013ABL and its influence on regional
air quality
M. Wu et al.
Title Page
Abstract Introduction
Conclusions References
Tables Figures
◭ ◮
◭ ◮
Back Close
Full Screen / Esc
Printer-friendly Version Interactive Discussion
Discussion
P
a
per
|
Dis
cussion
P
a
per
|
Discussion
P
a
per
|
Discussio
n
P
a
per
before 14:00 LST, and it reached maximum value at the height of about 600 m. This may be due to the fact that the direction of country breeze was offset to system wind at low level, but, veered to the same direction at middle level, the wind direction was northeast till 14:00 LST. After 17:00 LST, the wind speed was low at both middle and high level, while wind direction turned to the northwest.
5
At Xinken station (Fig. 4c), the balloon trajectories showed remarkable bent-back at 17:00, 18:00, 19:00 and 20:00 LST, which means the existence of sea–land breezes. Furthermore, at Panyu station (Fig. 4d), the balloon trajectories curved at 17:00 and 18:00 LST with the impact of sea–land breezes.
Figure 5 gives the vertical wind profile and balloon trajectory on 23 July 2006 while
10
PRD was affected by SPCTC. It is clear that the vertical wind profile also could be distinguished by three levels.
At Xinken station (Fig. 5a), with the strong impact of tropical cyclone subsidence flow, the wind speed was lower than 3 m s−1 at low level from 06:00 LST to 14:00 LST, and
the wind direction changed frequently with no prevailing wind direction. After 17:00 LST,
15
the wind speed increased observably and wind direction veered to the west with the influence of sea breeze. At the middle level (Fig. 5a), the wind speed increased along with the height before 08:00 LST, and the wind direction turned from south to south-east simultaneously. After 17:00 LST, the wind speed increased, and the wind direction turned to northeast. At high level (Fig. 5a), the wind speed was high at all
observa-20
tion times. The prevailing wind direction was southeast before 10:00 LST, while after 14:00 LST the prevailing wind direction turned to the northeast.
At Panyu station (Fig. 5b), the system wind was very weak at low level before 10:00 LST, and the wind speed was lower than 3 m s−1. A wind shear appeared at
the height of 200 m at 06:00 LST, which may be caused by heat–island circulation, and
25
ACPD
13, 6035–6066, 2013ABL and its influence on regional
air quality
M. Wu et al.
Title Page
Abstract Introduction
Conclusions References
Tables Figures
◭ ◮
◭ ◮
Back Close
Full Screen / Esc
Printer-friendly Version Interactive Discussion
Discussion
P
a
per
|
Dis
cussion
P
a
per
|
Discussion
P
a
per
|
Discussio
n
P
a
per
|
wind speed reached maximum since the influence of sea breeze was most remark-able. At middle level, the wind direction was easterly from 06:00 LST to 08:00 LST. Af-ter 10:00 LST, the wind speed increased and the wind direction veered to west. At high level, the wind speed was higher than 5 m s−1 at most observation times, but the wind
direction was southeast before 10:00 LST, while veered to northeast after 10:00 LST.
5
At Xinken station (Fig. 5c), it clearly reveals that the balloon trajectories were quite straight at 06:00, 07:00 and 08:00 LST on 23 July 2006, but at 17:00, 18:00, 19:00 and 20:00 LST the balloon trajectories bent-back along with the change of wind direc-tion respectively. At Panyu stadirec-tion (Fig. 5d), the balloon trajectories were westward at daytime, while eastward at nighttime.
10
Figure 6 shows the vertical wind profile and balloon trajectories on 26 October 2004 which had good air quality. It is obvious that the wind profiles were exactly similar most of the times, and the three-level structure of wind profile was not in existence any more (Fig. 6a, b). The wind speed was far higher than 5 m s−1 at both two stations,
while the wind direction was very stable, and the dominate wind direction northeast.
15
Furthermore, there was no local circulation that could be distinguished.
During the clean case (Fig. 6c, d), the balloon trajectories were very straight and moved southwestward, which was consistent with the vertical wind condition. The fea-ture of balloon trajectories in the clean case (shown in Fig. 6) is completely different to the polluted cases (shown in Figs. 4 and 5).
20
Table 2 shows the features of sea–land breezes at Xinken station that were sum-marized from all the sea–land breeze days during the campaigns. It is clear that the sea breeze started at 17:00 until 18:00 LST while the wind direction was southeast. The peak influence height was 600 m to 800 m, which emerged at about 23:00 LST. And the land breeze started at 06:00 until 07:00 LST while the wind direction was northwest.
25
The peak influence height was 500 m to 600 m, which emerged at about 10:00 LST. Comparing with the vertical wind characteristics of the three typical cases, it is found that, during the polluted cases, the wind speed in ABL was lower than 3 m s−1most of
ACPD
13, 6035–6066, 2013ABL and its influence on regional
air quality
M. Wu et al.
Title Page
Abstract Introduction
Conclusions References
Tables Figures
◭ ◮
◭ ◮
Back Close
Full Screen / Esc
Printer-friendly Version Interactive Discussion
Discussion
P
a
per
|
Dis
cussion
P
a
per
|
Discussion
P
a
per
|
Discussio
n
P
a
per
of heat–island circulation, updraft could make the pollutants accumulate over the city, and country breeze could carry the pollutants back to urban areas from the suburbs. At Xinken station, with the influence of sea–land breezes, the pollutants would be trans-ported back to inland from coastal areas. In addition, during the polluted days that PRD was affected by SPCTC, the subsidence flow of a tropical cyclone played an important
5
role in the pollutant accumulation. It is also found that when the wind speed was high and the wind direction was stable in ABL, the pollutants could be transmitted and dif-fused effectively.
4.3 Recirculation factor and ventilation index
Figure 7 gives the vertical RF of these three typical cases. It is found that all the polluted
10
cases had a minimum value in RF profiles. During 16 October 2004, the minimum RF was just 0.15, and occurred at about 400 m. During 23 July 2006, the minimum RF was also just 0.15, and occurred at about 700 m. Moreover, the RFs during the clean case (26 October 2004) were larger than 0.95 at each height, which means that the wind direction had little change throughout the case. The difference of RF in different
15
cases indicates that recirculation was significant in polluted cases. The pollutants were initially carried away from Xinken but later returns, and the steady transport occurred in the clean case.
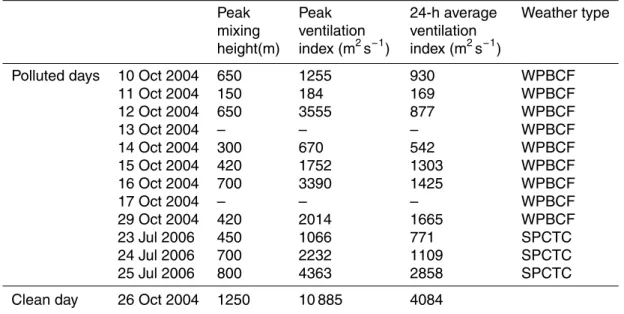
Table 3 shows the peak mixing height, peak VI and 24-h average VI of polluted days and the clean day. Peak mixing height and VI were key ABL parameters associated
20
with the dispersion of air pollutants.
First, the peak mixing heights were smaller than 700 m in WPBCF cases, and in SPCTC cases they were smaller than 800 m. The peak mixing heights of polluted days were much lower than that of clean day, with lower mixing heights resulting in higher pollutant concentration. Second, during WPBCF cases, the peak VI was from 184 to
25
3555 m2s−1; during SPCTC days, the peak VI was from 1066 to 4363 m2s−1; during
ACPD
13, 6035–6066, 2013ABL and its influence on regional
air quality
M. Wu et al.
Title Page
Abstract Introduction
Conclusions References
Tables Figures
◭ ◮
◭ ◮
Back Close
Full Screen / Esc
Printer-friendly Version Interactive Discussion
Discussion
P
a
per
|
Dis
cussion
P
a
per
|
Discussion
P
a
per
|
Discussio
n
P
a
per
|
Third, the 24-h average VI on polluted days was from 169 to 2858 m2s−1, and was also
much smaller than that of the clean day.
Low VI of polluted days always associated with light winds, low mixing height and weak transport. The poor diffusion condition which it implied was beneficial to the ac-cumulation of pollutants, and caused the deterioration of air quality in PRD.
5
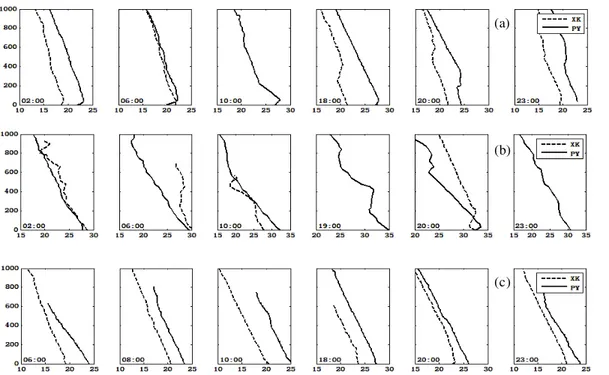
4.4 Vertical temperature profile
Figure 8 clearly reveals the variations of vertical temperature profile in these different typical cases. Figure 8a gives the vertical temperature profiles on 16 October 2004, which was a polluted case affected by WPBCF. At 02:00 LST, it is found that the tem-perature of Xinken station was 3◦ lower than that of Panyu station at most heights,
10
and there was an inversion layer at about 50 m at both two stations. At 06:00 LST, the surface inversion layer was only in existence at Panyu station. With the influence of land breeze, the Xinken station temperature increased and the temperature difference between two stations also decreased. After 18:00 LST, the inversion layer at Panyu station was still near surface, but at Xinken station, under the influence of sea breeze,
15
the inversion layer upraised to the height of 400 m. At 20:00 LST, for the influence of the sea breeze reached inland, the inversion layer was up to 300 m at Panyu station, and at Xinken station it was up to 600 m. At 23:00 LST, at Panyu station, the height of inversion layer reached maximum, but the intensity of inversion layer weakened At Xinken station, a new surface inversion layer occurred again.
20
Figure 8b gives the vertical temperature profiles on 23 July 2006, which was a pol-luted case affected by SPCTC. At 02:00 LST, it is found that the characteristics of ver-tical temperature profile at Xinken station and Panyu station were very complex. There were three inversion layers that appeared at the height of about 500 m, 700 m and 900 m at Xinken station, respectively. A surface inversion layer appeared at 50 m at
25
ACPD
13, 6035–6066, 2013ABL and its influence on regional
air quality
M. Wu et al.
Title Page
Abstract Introduction
Conclusions References
Tables Figures
◭ ◮
◭ ◮
Back Close
Full Screen / Esc
Printer-friendly Version Interactive Discussion
Discussion
P
a
per
|
Dis
cussion
P
a
per
|
Discussion
P
a
per
|
Discussio
n
P
a
per
At 10:00 LST, a super adiabatic phenomenon was remarkable at Panyu station, and inversion layer was remarkable at Xinken station at about 500 m. After 19:00 LST, the vertical temperature profile shows two inversion layers at 400 m and 800 m. Af-ter 20:00 LST, several inversion layers emerged at Panyu station, and Xinken station also had an inversion layer at 200 m.
5
Figure 8c gives the vertical temperature profiles on 26 October 2004, which was a clean day. It is clear that the temperature of Xinken station was always lower than at Panyu station. The temperature profiles were quite smooth, and no inversion layer existed. In addition, the super adiabatic phenomenon was significant sometimes.
According to above analysis, inversion layer was a very important influence factor on
10
high pollutant concentration. During the polluted case in which PRD was controlled by WPBCF, only one surface inversion layer appeared. When in the period of land breeze, its height was about 50 m at both Panyu station and Xinken station. When affected by sea breeze, the inversion layer height of Panyu station was up to 400 m, and that of Xinken station was up to 600 m. During the polluted case in which PRD was controlled
15
by SPCTC, there were several inversion layers that appeared. The maximum height of the inversion layers was about 800 m, and vertical temperature profile was quite complex with the influence of subsidence flow. Furthermore, during the clean case, PRD was controlled by strong wind, and the inversion layer was nonexistent. The super adiabatic phenomenon was significant most of the time at Panyu station and Xinken
20
station.
5 Summary and conclusions
According to the intensive observations, the typical weather conditions associated with poor air quality over PRD could be summarized into two types: the warmed period before cold front (WPBCF) and the subsidence period controlled by tropical cyclone
25
ACPD
13, 6035–6066, 2013ABL and its influence on regional
air quality
M. Wu et al.
Title Page
Abstract Introduction
Conclusions References
Tables Figures
◭ ◮
◭ ◮
Back Close
Full Screen / Esc
Printer-friendly Version Interactive Discussion
Discussion
P
a
per
|
Dis
cussion
P
a
per
|
Discussion
P
a
per
|
Discussio
n
P
a
per
|
During the polluted cases, a calm wind region appeared in PRD, while local circu-lations grew and held an important role for pollutant concentration. At an urban sta-tion (Panyu), heat–island circulasta-tion made the pollutants accumulate over the city, and country breeze carried pollutants back to urban areas from the suburbs. At a near-estuary station (Xinken), sea breeze transported the pollutants back inland.
5
Recirculation factor is a very good reference index for the judgment of wind trans-mission capacity. The recirculation was significant in polluted cases. Pollutants were initially carried away from Xinken, but later return, and steady transport occurred in the clean case.
The peak mixing heights were smaller than 700 m in WPBCF cases, and in SPCTC
10
cases they were smaller than 800 m. The peak VI was lower in polluted cases (WPBCF and SPCTC), while the peak VI on the clean day was much larger than all types of polluted cases.
Inversion layer was a very important influence factor on poor air quality. Only surface inversion layer appeared during WPBCF cases, but there were several inversion layers
15
that appeared during the SPCTC cases, and the vertical temperature profile was very complex with the influence of subsidence flow.
The regional air quality over PRD is strongly dependent on weather conditions. It is still necessary to undergo many more observation studies and numerical simulations.
Acknowledgements. This study was supported by funds from National Natural Science
20
Foundation of China 41275017 and National Basic Research and Development Programs 2002CB410801, 2011CB403403.
References
Alappattu, D. P. and Kunhikrishnan, P. K.: Observations of the thermodynamic structure of marine atmospheric boundary layer over Bay of Bengal, Northern Indian Ocean
25
ACPD
13, 6035–6066, 2013ABL and its influence on regional
air quality
M. Wu et al.
Title Page
Abstract Introduction
Conclusions References
Tables Figures
◭ ◮
◭ ◮
Back Close
Full Screen / Esc
Printer-friendly Version Interactive Discussion
Discussion
P
a
per
|
Dis
cussion
P
a
per
|
Discussion
P
a
per
|
Discussio
n
P
a
per
Allwine, K. J. and Whiteman, C. D.: Single-station integral measures of atmospheric stagnation, recirculation and ventilation, Atmos. Environ., 28, 713–721, 1994.
Carreras, H. A. and Pignata, M. L.: Comparison among air pollutants, meteorological conditions and some chemical parameters in the transplanted lichenUsnea amblyoclada, Environ. Pol-lut., 111, 45–52, 2001.
5
Chan, C., Tang, J., Li, Y., and Chan, L.: Mixing ratios and sources of halocarbons in urban, semi-urban and rural sites of the Pearl River Delta, South China, Atmos. Environ., 40, 7331–7345, doi:10.1016/j.atmosenv.2006.06.041, 2006.
Chen, X. L., Fan, S. J., Li, J. N., Liu, J., Wang, A. Y., and Fong, S. K.: Typical weather char-acteristics associated with air pollution in Hong Kong area, J. Trop. Meteorol., 14, 101–104,
10
2008.
Cogliani, E.: Air pollution forecast in cities by an air pollution index highly correlated with mete-orological variables, Atmos. Environ., 35, 2871–2877, 2001.
Davies, F., Middleton, D. R., and Bozier, K. E.: Urban air pollution modelling and measurements of boundary layer height, Atmos. Environ., 41, 4040–4049,
15
doi:10.1016/j.atmosenv.2007.01.015, 2007.
Day, B. M., Rappengl ¨uck, B., Clements, C. B., Tucker, S. C., and Alan Brewer, W.: Nocturnal boundary layer characteristics and land breeze development in Houston, Texas during Tex-AQS II, Atmos. Environ., 44, 4014–4023, doi:10.1016/j.atmosenv.2009.01.031, 2010. Ding, A. J., Wang, T., Zhao, M., Wang, T. J., and Li, Z. K.: Simulation of sea-land breezes
20
and a discussion of their implications on the transport of air pollution during a multi-day ozone episode in the Pearl River Delta of China, Atmos. Environ., 38, 6737–6750, doi:10.1016/j.atmosenv.2004.09.017, 2004.
Ding, A. J., Wang, T., Xue, L. K., Gao, J., Stohl, A., Lei, H., Jin, D., Ren, Y., Wang, X., Wei, X., Qi, Y., Liu, J., and Zhang, X.: Transport of north China air pollution by midlatitude cyclones:
25
case study of aircraft measurements in summer 2007, J. Geophys. Res., 114, D08304, doi:10.1029/2008jd011023, 2009.
Dupont, E., Menut, L., Carissimo, B., Pelon, J., and Flamant, P.: Comparison between the atmospheric boundary layer in Paris and its rural suburbs during the ECLAP experiment, Atmos. Environ., 33, 979–994, 1999.
30
ACPD
13, 6035–6066, 2013ABL and its influence on regional
air quality
M. Wu et al.
Title Page
Abstract Introduction
Conclusions References
Tables Figures
◭ ◮
◭ ◮
Back Close
Full Screen / Esc
Printer-friendly Version Interactive Discussion
Discussion
P
a
per
|
Dis
cussion
P
a
per
|
Discussion
P
a
per
|
Discussio
n
P
a
per
|
Fan, S. J., Dong, J., Guo, L. L., Wang, A. Y., Somg, L. L., Liu, A. J., and Xie, J. W.: Analysis of the impact of urban growth on the tempreture field in Guangzhou, J. Trop. Meteorol., 12, 24–28, 2006.
Fan, S. J., Wang, A. Y., Fan, Q., Liu, J., Wang, B. M., and Ta, N.: Atmosphere boundray layer concept model of the Pearl River Delta and its application, J. Trop. Meteorol., 13, 8–13, 2007.
5
Fan, S. J., Wang, B. M., Tesche, M., Engelmann, R., Althausen, A., Liu, J., Zhu, W., Fan, Q., Li, M. H., and Ta, N.: Meteorological conditions and structures of atmospheric bound-ary layer in October 2004 over Pearl River Delta area, Atmos. Environ., 42, 6174–6186, doi:10.1016/j.atmosenv.2008.01.067, 2008.
Fan, S. J., Fan, Q., Yu, W., Luo, X. Y., Wang, B. M., Song, L. L., and Leong, K. L.: Atmospheric
10
boundary layer characteristics over the Pearl River Delta, China, during the summer of 2006: measurement and model results, Atmos. Chem. Phys., 11, 6297–6310, doi:10.5194/acp-11-6297-2011, 2011.
Feng, Y., Wang, A., Wu, D., and Xu, X.: The influence of tropical cyclone Melor on PM10 concentrations during an aerosol episode over the Pearl River Delta region of
15
China: numerical modeling versus observational analysis, Atmos. Environ., 41, 4349–4365, doi:10.1016/j.atmosenv.2007.01.055, 2007.
Gao, Y., Liu, X., Zhao, C., and Zhang, M.: Emission controls versus meteorological conditions in determining aerosol concentrations in Beijing during the 2008 Olympic Games, Atmos. Chem. Phys., 11, 12437–12451, doi:10.5194/acp-11-12437-2011, 2011.
20
Grinn-Gofron, A., Strzelczak, A., and Wolski, T.: The relationships between air pollutants, me-teorological parameters and concentration of airborne fungal spores, Environ. Pollut., 159, 602–608, doi:10.1016/j.envpol.2010.10.002, 2011.
Hanna, S. R., MacDonald, C. P., Lilly, M., Knoderer, C., and Huang, C. H.: Analysis of three years of boundary layer observations over the Gulf of Mexico and its shores, Estuar. Coast.
25
Shelf. S., 70, 541–550, doi:10.1016/j.ecss.2006.06.005, 2006.
Khedairia, S. and Khadir, M. T.: Impact of clustered meteorological parameters on air pollutants concentrations in the region of Annaba, Algeria, Atmos. Res., 113, 89–101, doi:10.1016/j.atmosres.2012.05.002, 2012.
Kolev, I., Savov, P., Kaprielov, B., Parvanov, O., and Simeonov, V.: Lidar observation of the
30
ACPD
13, 6035–6066, 2013ABL and its influence on regional
air quality
M. Wu et al.
Title Page
Abstract Introduction
Conclusions References
Tables Figures
◭ ◮
◭ ◮
Back Close
Full Screen / Esc
Printer-friendly Version Interactive Discussion
Discussion
P
a
per
|
Dis
cussion
P
a
per
|
Discussion
P
a
per
|
Discussio
n
P
a
per
Krautstrunk, M., Neumann-Hauf, G., Schlager, H., Klemm, O., Beyrich, F., Corsmeier, U., Kaltho, N., and Kotzian, M.: An experimental study on the planetary boundary layer transport of air pollutants over East Germany, Atmos. Environ., 34, 1247–1266, 2000.
Lin, W., Xu, X., Ge, B., and Liu, X.: Gaseous pollutants in Beijing urban area during the heating period 2007–2008: variability, sources, meteorological, and chemical impacts, Atmos. Chem.
5
Phys., 11, 8157–8170, doi:10.5194/acp-11-8157-2011, 2011.
Menut, L., Coll, I., and Cautenet, S.: Impact of meteorological data resolution on the forecasted ozone concentrations during the ESCOMPTE IOP2a and IOP2b, Atmos. Res., 74, 139–159, doi:10.1016/j.atmosres.2004.04.008, 2005.
Neff, W., Helmig, D., Grachev, A., and Davis, D.: A study of boundary layer behavior associated
10
with high NO concentrations at the South Pole using a minisodar, tethered balloon, and sonic anemometer, Atmos. Environ., 42, 2762–2779, doi:10.1016/j.atmosenv.2007.01.033, 2008. Pasch, A. N., MacDonald, C. P., Gilliam, R. C., Knoderer, C. A., and Roberts, P. T.:
Me-teorological characteristics associated with PM2.5 air pollution in Cleveland, Ohio, during the 2009–2010 Cleveland Multiple Air Pollutants Study, Atmos. Environ., 45, 7026–7035,
15
doi:10.1016/j.atmosenv.2011.09.065, 2011.
Pournazeri, S., Venkatram, A., Princevac, M., Tan, S., and Schulte, N.: Estimating the height of the nocturnal urban boundary layer for dispersion applications, Atmos. Environ., 54, 611– 623, doi:10.1016/j.atmosenv.2012.02.024, 2012.
Sang, J. G., Liu, H. P., Liu, H. Z., and Zhang, Z. Z.: Observational and numerical studies of
20
wintertime urban boundary layer, J. Wind. Eng. Ind. Aerod., 87, 243–258, 2000.
Salmond, J. A. and McKendry, I. G.: Secondary ozone maxima in a very stable nocturnal bound-ary layer – observations from the Lower Fraser Valley, BC, Atmos. Environ., 36, 5771–5782, 2002.
Schleicher, N., Norra, S., Chen, Y., Chai, F., and Wang, S.: Efficiency of mitigation
mea-25
sures to reduce particulate air pollution – a case study during the Olympic Sum-mer Games 2008 in Beijing, China, China, Sci. Total. Environ., 427–428, 146–158, doi:10.1016/j.scitotenv.2012.04.004, 2012.
Tan, J. H., Duan, J. C., He, K. B., Ma, Y. L., Duan, F. K., Chen, Y., and Fu, J. M.: Chemical characteristics of PM2.5 during a typical haze episode in Guangzhou, J. Environ. Sci., 21,
30
774–781, doi:10.1016/s1001-0742(08)62340-2, 2009.
ACPD
13, 6035–6066, 2013ABL and its influence on regional
air quality
M. Wu et al.
Title Page
Abstract Introduction
Conclusions References
Tables Figures
◭ ◮
◭ ◮
Back Close
Full Screen / Esc
Printer-friendly Version Interactive Discussion
Discussion
P
a
per
|
Dis
cussion
P
a
per
|
Discussion
P
a
per
|
Discussio
n
P
a
per
|
during the 2008 Beijing Olympics: secondary pollutants and regional impact, Atmos. Chem. Phys., 10, 7603–7615, doi:10.5194/acp-10-7603-2010, 2010.
Wu, D., Tie, X. X., Li, C. C., Ying, Z. M., Kai-Hon Lau, A., Huang, J., Deng, X. J., and Bi, X. Y.: An extremely low visibility event over the Guangzhou region: a case study, Atmos. Environ., 39, 6568–6577, doi:10.1016/j.atmosenv.2005.07.061, 2005.
5
Wu, D., Bi, X. Y., Deng, X. J., Li, F., Tan, H. B., Liao, G. L., and Huang, J.: Effect of atmospheric haze on the deterioration of visibility over the Pearl River Delta, Acta Meteorol. Sin., 21, 215–223, 2007.
Xiao, F., Brajer, V., and Mead, R. W.: Blowing in the wind: the impact of China’s Pearl River Delta on Hong Kong’s air quality, Sci. Total. Environ., 367, 96–111,
10
doi:10.1016/j.scitotenv.2006.01.010, 2006.
Xu, W. Y., Zhao, C. S., Ran, L., Deng, Z. Z., Liu, P. F., Ma, N., Lin, W. L., Xu, X. B., Yan, P., He, X., Yu, J., Liang, W. D., and Chen, L. L.: Characteristics of pollutants and their correlation to meteorological conditions at a suburban site in the North China Plain, Atmos. Chem. Phys., 11, 4353–4369, doi:10.5194/acp-11-4353-2011, 2011.
15
Zhang, J. P., Zhu, T., Zhang, Q. H., Li, C. C., Shu, H. L., Ying, Y., Dai, Z. P., Wang, X., Liu, X. Y., Liang, A. M., Shen, H. X., and Yi, B. Q.: The impact of circulation patterns on regional trans-port pathways and air quality over Beijing and its surroundings, Atmos. Chem. Phys., 12, 5031–5053, doi:10.5194/acp-12-5031-2012, 2012.
Zhang, Y. H., Hu, M., Zhong, L. J., Wiedensohler, A., Liu, S. C., Andreae, M. O.,
20
ACPD
13, 6035–6066, 2013ABL and its influence on regional
air quality
M. Wu et al.
Title Page
Abstract Introduction
Conclusions References
Tables Figures
◭ ◮
◭ ◮
Back Close
Full Screen / Esc
Printer-friendly Version Interactive Discussion
Discussion
P
a
per
|
Dis
cussion
P
a
per
|
Discussion
P
a
per
|
Discussio
n
P
a
per
Table 1.Weather types of pollution episodes during the campaigns.
Episode data API feature Weather type
10 Oct 2004–17 Oct 2004 API>100 In the warmed period before cold front 29 Oct 2004–31 Oct 2004 API>100 In the warmed period before cold front
ACPD
13, 6035–6066, 2013ABL and its influence on regional
air quality
M. Wu et al.
Title Page
Abstract Introduction
Conclusions References
Tables Figures
◭ ◮
◭ ◮
Back Close
Full Screen / Esc
Printer-friendly Version Interactive Discussion
Discussion
P
a
per
|
Dis
cussion
P
a
per
|
Discussion
P
a
per
|
Discussio
n
P
a
per
|
Table 2.The features of sea–land breezes at Xinken station during the campaigns.
Start time (LST) Peak height (m) Time of peak height (LST)
Wind direction
Sea breeze 17:00–18:00 600–800 23:00 Southeast
ACPD
13, 6035–6066, 2013ABL and its influence on regional
air quality
M. Wu et al.
Title Page
Abstract Introduction
Conclusions References
Tables Figures
◭ ◮
◭ ◮
Back Close
Full Screen / Esc
Printer-friendly Version Interactive Discussion
Discussion
P
a
per
|
Dis
cussion
P
a
per
|
Discussion
P
a
per
|
Discussio
n
P
a
per
Table 3.Peak mixing height, peak ventilation index and 24-h average ventilation index values for polluted and non-polluted days during the campaigns.
Peak mixing height(m)
Peak ventilation index (m2s−1)
24-h average ventilation index (m2s−1)
Weather type
Polluted days 10 Oct 2004 650 1255 930 WPBCF
11 Oct 2004 150 184 169 WPBCF
12 Oct 2004 650 3555 877 WPBCF
13 Oct 2004 – – – WPBCF
14 Oct 2004 300 670 542 WPBCF
15 Oct 2004 420 1752 1303 WPBCF
16 Oct 2004 700 3390 1425 WPBCF
17 Oct 2004 – – – WPBCF
29 Oct 2004 420 2014 1665 WPBCF
23 Jul 2006 450 1066 771 SPCTC
24 Jul 2006 700 2232 1109 SPCTC
25 Jul 2006 800 4363 2858 SPCTC
Clean day 26 Oct 2004 1250 10 885 4084
ACPD
13, 6035–6066, 2013ABL and its influence on regional
air quality
M. Wu et al.
Title Page
Abstract Introduction
Conclusions References
Tables Figures
◭ ◮
◭ ◮
Back Close
Full Screen / Esc
Printer-friendly Version Interactive Discussion
Discussion
P
a
per
|
Dis
cussion
P
a
per
|
Discussion
P
a
per
|
Discussio
n
P
a
per
|
(b) (a)
Fig. 1.Map of the surface and altitude measurements performed during the PRD ABL
ACPD
13, 6035–6066, 2013ABL and its influence on regional
air quality
M. Wu et al.
Title Page Abstract Introduction Conclusions References Tables Figures ◭ ◮ ◭ ◮ Back Close
Full Screen / Esc
Printer-friendly Version Interactive Discussion Discussion P a per | Dis cussion P a per | Discussion P a per | Discussio n P a per 25 27 29 31 20 40 60 80 100 120
1 3 5 7 9 11 13 15 17 19 21 23 25 27 29 API T AP I T em p er at u re( ℃ ) October2004 23 24 25 26 27 28 0 20 40 60 80
1 3 5 7 9 11 13 15 17 19 21 23 25 27 29 31 API T AP I T em p er at u re( ℃ ) July2006 0 20 40 60 80 100
1 3 5 7 9 11 13 15 17 19 21 23 25 27 29 31
P reci p at at io n (m m ) October2004 0 20 40 60 80 100
1 3 5 7 9 11 13 15 17 19 21 23 25 27 29 31
P re cip at at io n (mm) July2006 (d) (c)
Fig. 2.Time series of(a)air pollution index during 1–31 October 2004 at Guangzhou station,
ACPD
13, 6035–6066, 2013ABL and its influence on regional
air quality
M. Wu et al.
Title Page
Abstract Introduction
Conclusions References
Tables Figures
◭ ◮
◭ ◮
Back Close
Full Screen / Esc
Printer-friendly Version Interactive Discussion
Discussion
P
a
per
|
Dis
cussion
P
a
per
|
Discussion
P
a
per
|
Discussio
n
P
a
per
|
(b) (c)
(a)
ACPD
13, 6035–6066, 2013ABL and its influence on regional
air quality
M. Wu et al.
Title Page
Abstract Introduction
Conclusions References
Tables Figures
◭ ◮
◭ ◮
Back Close
Full Screen / Esc
Printer-friendly Version Interactive Discussion
Discussion
P
a
per
|
Dis
cussion
P
a
per
|
Discussion
P
a
per
|
Discussio
n
P
a
per
(b) (a)
(d) (c)
Fig. 4. Vertical wind profile by radio soundings and balloon trajectory on 16 October 2004.
ACPD
13, 6035–6066, 2013ABL and its influence on regional
air quality
M. Wu et al.
Title Page
Abstract Introduction
Conclusions References
Tables Figures
◭ ◮
◭ ◮
Back Close
Full Screen / Esc
Printer-friendly Version Interactive Discussion
Discussion
P
a
per
|
Dis
cussion
P
a
per
|
Discussion
P
a
per
|
Discussio
n
P
a
per
|
(b) (a)
(d) (c)
ACPD
13, 6035–6066, 2013ABL and its influence on regional
air quality
M. Wu et al.
Title Page
Abstract Introduction
Conclusions References
Tables Figures
◭ ◮
◭ ◮
Back Close
Full Screen / Esc
Printer-friendly Version Interactive Discussion
Discussion
P
a
per
|
Dis
cussion
P
a
per
|
Discussion
P
a
per
|
Discussio
n
P
a
per
(b) (a)
(d) (c)
Fig. 6. Vertical wind profile by radio soundings and balloon trajectory on 26 October 2004.
ACPD
13, 6035–6066, 2013ABL and its influence on regional
air quality
M. Wu et al.
Title Page
Abstract Introduction
Conclusions References
Tables Figures
◭ ◮
◭ ◮
Back Close
Full Screen / Esc
Printer-friendly Version Interactive Discussion
Discussion
P
a
per
|
Dis
cussion
P
a
per
|
Discussion
P
a
per
|
Discussio
n
P
a
per
|
0 100 200 300 400 500 600 700 800 900 1000 1100 1200 1300 1400 1500 1600 1700 1800 1900 2000
0 0.1 0.2 0.3 0.4 0.5 0.6 0.7 0.8 0.9 1
H
e
ig
h
t(
m
/s
)
Recircula tion fa ctor
2004.10.16 2006.07.23 2004.10.26
ACPD
13, 6035–6066, 2013ABL and its influence on regional
air quality
M. Wu et al.
Title Page
Abstract Introduction
Conclusions References
Tables Figures
◭ ◮
◭ ◮
Back Close
Full Screen / Esc
Printer-friendly Version Interactive Discussion
Discussion
P
a
per
|
Dis
cussion
P
a
per
|
Discussion
P
a
per
|
Discussio
n
P
a
per
(a)
(b)
(c)
ACPD
13, 6035–6066, 2013ABL and its influence on regional
air quality
M. Wu et al.
Title Page
Abstract Introduction
Conclusions References
Tables Figures
◭ ◮
◭ ◮
Back Close
Full Screen / Esc
Printer-friendly Version Interactive Discussion
Discussion
P
a
per
|
Dis
cussion
P
a
per
|
Discussion
P
a
per
|
Discussio
n
P
a
per
|
(b) (a)