ELECTRICAL RESISTIVITY AND ACTIVATION ENERGY
OF COBALT ACETATE TETRAHYDRATE DOPED MULLITE
DEBASIS ROY, BISWAJOY BAGCHI, #SUKHEN DAS, PAPIYA NANDY
Physics Department, Jadavpur University Kolkata- 700 032. India
#E-mail: [email protected]
Submitted November 26, 2011; accepted September 3, 2012
Keywords: Nanocomposite, Sol-gel methods, Scanning electron microscopy (SEM), X-ray diffraction (XRD), Electrical resistivity
Mullite composites have been synthesized at 400°C, 800°C, 1000°C and 1300°C via the sol-gel technique in the presence of cobalt. The electrical resistivity and activation energy of the composites have been measured and their variation with concentration of the metal ion doping has been investigated. The resistivity of doped mullite decreases rapidly from 400°C-800°C more gently from 1000°C-1300°C. The lowering of resistivity is due to the 3d orbital electrons and the concentration of cobalt ions. X-ray analysis conirms the presence of Co2+ ions in mullite, which entered the octahedral site.
The Co2+ ion which substituted Al3+ ion in the octahedral site of mullite structure appeared to be eficient in reducing the
resistivity. This has been conirmed due to the results of activation energy of resistivity/band gap energy, the Eg which was
lowest for concentration 0.15 M. As the concentration increases, these ions lower the resistivity of mullite to a minimum.
INTRODUCTION
Mullite is a highly stable ceramic material with high mechanical strength, low dielectric constant, high creep resistance and low thermal expansion coeficient [1-8]. Typically, mullite formation starts from 1000°C and is completed at about 1600°C, due to solid-state reaction between Al2O3 and SiO2 particles [9-15]
Synthesis of mullite composites in the presence of various doping agents modifying the mechano-chemical properties has been reported by many authors however, literature concerning the activation energy of resistivity / band gap energy (Eg) of cobalt doped mullite composites
are relatively few [16-22] .
This paper deals with the synthesis of mullite composites doped with varying concentrations of cobalt ions and determines the effect of the same on resistivity/ activation energy of the composites at temperatures 400°C, 800°C, 1000°C and 1300°C.
The results indicate that the electrical resistivity of composite varies from order 1010 Ω.cm-1 at 400°C
to order 105 Ω.cm-1 at 1300°C. As the temperature is
increasing, the resistivity is decreasing [23, 24]. The lattice parameters (a, b, c) and unit cell volume change due to the incorporation of dopants. Synthesis of mullite composites in the presence of various doping agents has shown that these structural parameter changes do not depend on the nature of the dopents [25, 26].
The unit cell parameter according to Chaudhuri et al. [23], b axis and c axis increases steadily, but contrac-tion took place along the a axis. For undoped mullite (a = 7.544 Å, b = 7.687 Å and c = 2.881 Å and unit cell volume 167.07 Å3) and for doped mullite it has been
observed that the a-axis as well as the b-axis of mullite show elongation, but the c-axis almost remains constant for sintered gels at 1000°C and 1300°C [23,24].
EXPERIMENTAL
Mullite precursor gels are prepared from alumi-nium nitrate nonahydrate (Al(NO3)3·9H2O) extra pure
(Merck, India), aluminium isopropoxide (Al(–O–i–Pr)3)
puriss (Spectrochem Pvt. Ltd., India.), tetra ethyl ortho-silicate (Si(OC2H5)4), (Merck, Germany) and cobalt
acetate tetrahydrate (CH3COO)2 Co.4H2O) (Qualigens
Fine Chemicals, India) .
For the preparation of precursor gels for mullite synthesis, Al (–O–i–Pr)3 and Si(OC2H5)4 were added
simultaneously to 0.5 M solution of Al (NO3)3·9H2O
dissolved in 20 ml of distilled water. The molar ratio of Al (–O–i–Pr)3/Al (NO3)3·9H2O was 7 : 2 and mole ratio
of Al/Si was 3:1 [14].
salt in molarity. In the inal solution, M was varied as M = 0.002 (G1), 0.02 (G2), 0.10 (G3), 0.15 (G4) and
0.2 M (G5) [12, 13].
Gel formation was completed after stirring the so-lution for 3 hours and ageing the sol overnight at 60°C. The gel was then dried at 110°C and after grinding, it takes the form of freely lowing powder. The samples were then pelletized in disc form of 30 mm diameter and 3 mm thickness and sintered at 400°C, 800°C, 1000°C and 1300°C for 3 hr in a mufle furnace under air atmosphere at the heating rate of 10°C /minute [15-18].
The ired pellets were then coated by silver paste on both sides for electrical measurements.
The silver-coated discs were placed in a press-con-tact type telon holder to minimize leakage resistance from the holder. The chamber was made vacuum-tight and properly shielded [23].
Instrumentation
X-ray Powder Diffractometer of D8, Bruker AXS, Wisconsin, USA, using Cu Kα radiation (1.5418 Å) and operating at 40 kV with a scan speed of 1 s/step, analyzed phase identiication of the samples sintered at 400°C, 800°C, 1000°C and 1300°C.
The characteristic stretching and bending modes of vibration of chemical bonds of a sample can be
effec-tively evaluated by spectroscopic methods. 1 % of the sample was mixed with spectroscopy grade KBr, pelletized and analyzed by FTIR spectroscopy (FTIR-8400S, Shimadzu).
Electrical resistivity measurements of the sintered gels were carried out by electrometer. A constant DC voltage (V) of about 1.5 V was applied from a battery across the sample. The voltage (V) across the input resistance was measured by the electrometer.
Morphology of the sintered gels were observed by Field Emission Scanning Electron Microscope (FESEM, model JSM 6700F, JEOL Ltd. Tokyo, Japan).
RESULTS AND DISCUSSION
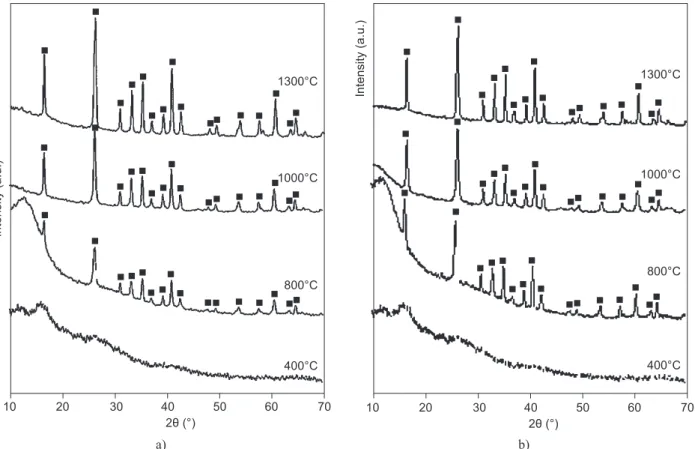
X-ray diffractograms of doped sintered gels shows considerable enhancement in mullite phase at 400°C, 800°C, 1000°C and 1300°C respectively. The metal ca-tion Co2+ had a positive effect on the growth of mullite
(JCPDS#15-776) [27]and increases with the increase of concentration of the metal ion at 400°C, 800°C, 1000°C and 1300°C (Figure 1). The ‘mineralizing’ effect of transition metals on phase transformation of mullite is well documented by other authors [16-18]. Interaction of the metal ion with the alumina and silica component of the gel is implicated in accelerated transformation to mullite phase [16, 21, 26].
2θ (°)
400°C 800°C 1000°C 1300°C
In
te
n
s
it
y
(
a
.u
.)
10 20 30 40 50 60 70
a)
Figure 1. X-ray diffraction pattern of mullite precursor gels sintered at 400°C, 800°C, 1000°C and 1300°C containing increasing concentration of cobalt (continue on next page).
2θ (°)
400°C 800°C 1000°C 1300°C
In
te
n
s
it
y
(
a
.u
.)
10 20 30 40 50 60 70
From the diffractograms, it was found that with the increase of metal concentration of doped metal, phase transformation in the composite increases. In the
diffractograms of G3, G4 and G5 samples, apart from
mullite, α-Al2O3 (JCPDS#46-1212) [28] relections were
observed and in G5CoAl2O4 (JCPDS# 44-0160) [29]
phases are observed (Figure 1e).
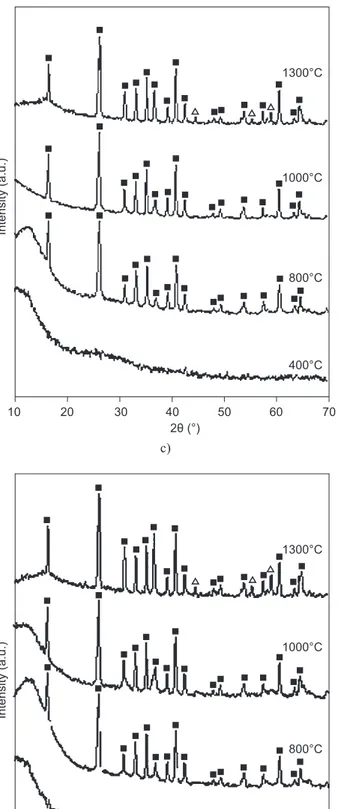
Characteristic bands at wave numbers are observed around 560, 730, 840, 1060 and 1130 cm-1, see Figure 2
[16]. All the characteristic bands of mullite - 561 (AlO6),
741 (AlO4), 837 (AlO4), 900 (AlO4 - stretching mode)
and 1130 cm-1 (Si–O stretching mode) appear in samples
G1, G2, G3, G4 and G5. Vibration modes corresponding
to doped cobalt oxide bonds were observed in the FTIR spectra.
According to, Ohm’s law the current (I) in the circuit is:
I = V/R (1) where V is voltage, I is current, and R is the resistance of the load, in this case the sample of cobalt doped mullite. Therefore, the resistance (R) of the sample was calculated as:
R = V/I (2) In the time of measurement of resistance of each sample, the voltage of the battery was checked. The ρ resistivity of a material can be calculated using the relationship: ρ = R (A/l) (3) where ρ is the material bulk resistivity, l is the sample length, and A is the sample’s cross-sectional area perpendicular to the current low.
2θ (°)
400°C 800°C 1000°C 1300°C
In
te
n
s
it
y
(
a
.u
.)
10 20 30 40 50 60 70
400°C 800°C 1000°C 1300°C
In
te
n
s
it
y
(
a
.u
.)
10 20 30 40 50 60 70
2θ (°)
Figure 1. X-ray diffraction pattern of mullite precursor gels sintered at 400°C, 800°C, 1000°C and 1300°C containing increasing concentration of cobalt.
c)
d)
2θ (°)
400°C 800°C 1000°C 1300°C
In
te
n
s
it
y
(
a
.u
.)
10 20 30 40 50 60 70
The electrical conductivity of the samples were described by the Arrhenius equation as follows:
σ = α eEg/kT (4)
where σ is the electrical conductivity given by σ = 1/ρ, α
is a pre-exponential factor, T is the absolute temperature,
k is the Boltzmann constant, and Egis the material’s
activation energy.
The electrical resistivity of the samples were de-scribed as ρ = 1/σ (5) where ρ is the material bulk resistivity and σ is the electrical conductivity [23-25].
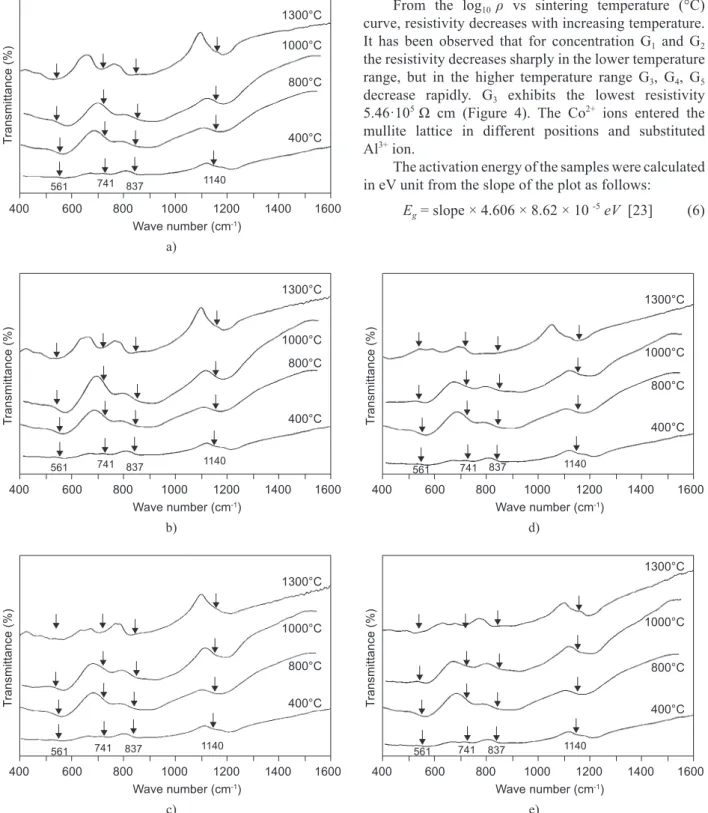
A plot of log10 ρ versus 1/T·104 was drawn for each
sample at temperatures 400°C, 800°C, 1000°C and 1300°C, see Figure 3. The plots show a linear increase with the reciprocal temperature.
From the log10 ρ vs sintering temperature (°C)
curve, resistivity decreases with increasing temperature. It has been observed that for concentration G1 and G2
the resistivity decreases sharply in the lower temperature range, but in the higher temperature range G3, G4, G5
decrease rapidly. G3 exhibits the lowest resistivity
5.46·105 Ω cm (Figure 4). The Co2+ ions entered the
mullite lattice in different positions and substituted Al3+ ion.
The activation energy of the samples were calculated in eV unit from the slope of the plot as follows:
Eg = slope × 4.606 × 8.62 × 10 -5eV [23] (6)
Wave number (cm-1)
400°C 800°C 1000°C 1300°C T ra n s m it ta n c e ( % )
400 600 1000 1400 1600
561 741 837 1140
800 1200
Wave number (cm-1)
400°C 800°C 1000°C 1300°C T ra n s m it ta n c e ( % )
400 600 1000 1400 1600
561 741 837 1140
800 1200
Wave number (cm-1)
400°C 800°C 1000°C 1300°C T ra n s m it ta n c e ( % )
400 600 1000 1400 1600
561 741 837 1140
800 1200
Wave number (cm-1)
400°C 800°C 1000°C 1300°C T ra n s m it ta n c e ( % )
400 600 1000 1400 1600
561 741 837 1140
800 1200
Wave number (cm-1)
400°C 800°C 1000°C 1300°C T ra n s m it ta n c e ( % )
400 600 1000 1400 1600
561 741 837 1140
800 1200
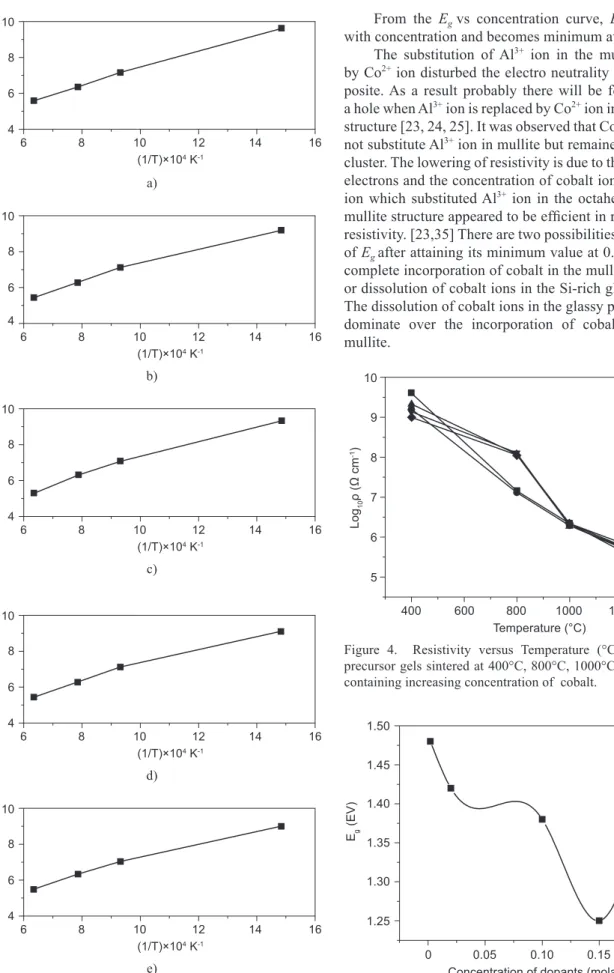
From the Egvs concentration curve, Egdecreases
with concentration and becomes minimum at 0.15M. The substitution of Al3+ ion in the mullite lattice
by Co2+ ion disturbed the electro neutrality of the
com-posite. As a result probably there will be formation of a hole when Al3+ ion is replaced by Co2+ ion in the mullite
structure [23, 24, 25]. It was observed that Co2+ ion could
not substitute Al3+ ion in mullite but remained there as a
cluster. The lowering of resistivity is due to the 3d orbital electrons and the concentration of cobalt ions. The Co2+
ion which substituted Al3+ ion in the octahedral site of
mullite structure appeared to be eficient in reducing the resistivity. [23,35] There are two possibilities of increase of Egafter attaining its minimum value at 0.15M, either
complete incorporation of cobalt in the mullite structure or dissolution of cobalt ions in the Si-rich glassy phase. The dissolution of cobalt ions in the glassy phase should dominate over the incorporation of cobalt ions into mullite. Temperature (°C) G1 G2 G3 G4 G5 L o
g10
ρ ( Ω c m -1) 800
400 600 1000 1200 1400
6 7 8 9 10 5
Figure 4. Resistivity versus Temperature (°C) of mullite precursor gels sintered at 400°C, 800°C, 1000°C and 1300°C containing increasing concentration of cobalt.
Concentration of dopants (molarity) Eg ( E V ) 0.10
0 0.05 0.15 0.20
1.30 1.35 1.40 1.45 1.50 1.25
Figure 5. Activation energy (Eg) vs concentration curve of mullite precursor gels sintered at 400°C, 800°C, 1000°C and 1300°C containing increasing concentration of cobalt.
(1/T)×104 K-1
L
o
g10
ρ ( Ω c m -1) 10
6 8 12 14 16
6 8
4 10
(1/T)×104 K-1
L o g1 0 ρ ( Ω c m -1) 10
6 8 12 14 16
6 8 10
4
(1/T)×104 K-1
L o g1 0 ρ ( Ω c m -1) 10
6 8 12 14 16
6 8 10
4
(1/T)×104 K-1
L
o
g10
ρ ( Ω c m -1) 10
6 8 12 14 16
6 8 10
4
(1/T)×104 K-1
L
o
g10
ρ ( Ω c m -1) 10
6 8 12 14 16
6 8 10
4
Figure 3. Resistivity (log10ρ) versus 1/T × 10-4 graph of mullite precursor gels sintered at 400°C, 800°C, 1000°C and 1300°C containing increasing concentration of cobalt.
e) d) b)
Mullite samples, therefore, behave like nonmetallic electrical conductors, because their conductivity rises faster at lower temperature but slows down at higher temperature.
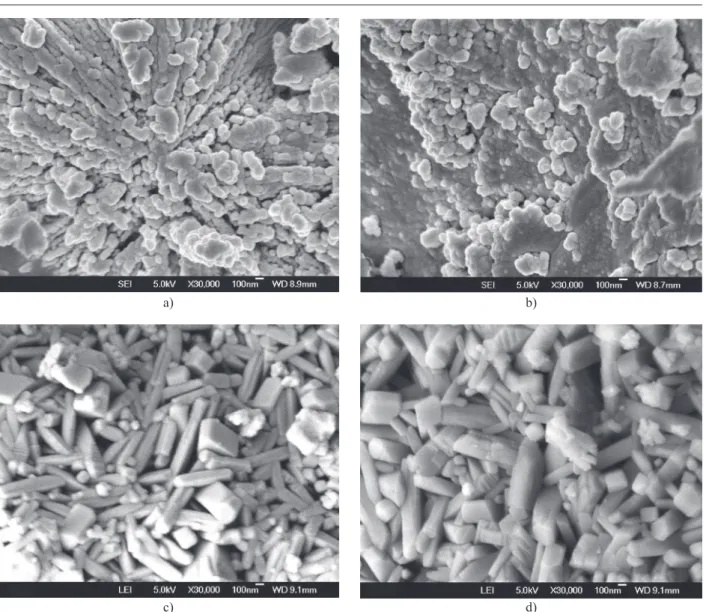
The morphology of mullite particles with lowest (G1) and highest (G5) concentrations of Co2+ sintered at
1000°C and 1300°C was investigated by FESEM. The micrograph for G1 shows almost round
partic-les of mullite of an average size of 200 nm. Numerous smaller particles can also be seen along with amorphous aggregates and see Figure 6a,b [12, 30, 31].
G5 samples shows distinct acicular morphology of
mullite crystals of size 600 nm embedded in the matrix, see Figure 6c,d. The mullite content and crystallization in all the G5 samples were greater than in G1 composites,
indicating the catalytic effect of the Co2+ ions [16, 21].
CONCLUSION
Cobalt doped mullite composites have been syn-thesized by the sol-gel technique, their phase evolution,
band gap activation energy and unit cell parameter has been investigated. The results showed that with increase in Co2+ concentration the crystallization of mullite was
enhanced, which is evident from X-ray diffraction and FESEM of the composites. In terms of unit cell parameter, the a-axis and b-axis show elongation, but the
c-axis almost remains constant. The activation energy of resistivity/band gap energy, Eg, attains a minimum value 1.25 eV at 0.15 M concentration. It has been observed that from 1000°C, the resistivity as well as the band gap energy corresponds to semiconductors.
Acknowledgement
We are grateful to the members of the, Department
of Science and Technology and University Grant Commission (PURSE program), Government of India, for their assistance.
Figure 6. FESEM of mullite precursor gels doped with Cobalt sample G1 and sample G5 sintered at 1000°C and 1300°C. d)
b) a)
References
1. Aksay I.A., Dabbs D.M., Sarikaya M.: J. Am. Ceram. Soc. 74, 2343 (1991).
2. Rahman S., Freimann S.in: Mullite, p. 46, Ed. Schneider H, Komarneni S., Wiley-VCH, Weinheim 2005.
3. Schreuer J., Hildmann B., Schneider H.: J. Am. Ceram. Soc. 89, 1624 (2006).
4. Schneider H., Schreuer J., Hildmann B.:J. Eur.Ceram.Soc. 28, 329 (2008).
5. Perera D.S., Allott G.: J. Mater Sci Lett.4, 1270 (1985). 6. Davis R.F., Pask J.A., Somiya S.: J. Am. Ceram. Soc.
Westerville (1990).
7. Schmucker M., Schneider H. In Mullite, p. 93, Ed. Schneider H., Komarneni S., Wiley-VCH, Weinheim 2005. 8. Vol’khin V.V., Kazakova I.L., Pongratz P., Halwax E.: Inorg
Mater. 36, 375 (2000).
9. Chen Y.F., Wang M.C., Hon M.H.:J. Eur. Ceram. Soc. 24, 2389 (2004).
10. Sahnoune F., Chegaar M., Saheb N., Goeuriot P., Valdivieso F.: Appl. Clay Sci 38, 304 (2008).
11. Pascual J., Zapatero J.: J. Am. Ceram. Soc. 83, 2677 (2000). 12. Tang Y.F., Ling Z.D., Lu Y.N., Li. AD., Ling HQ., Wang
YJ., Shao Y.: Mater. Chem. Phys. 75, 265 (2002).
13. Viswabaskarana V., Gnanama F.D, Balasubramanian M.: Ceram. Inter. 28, 557 (2002).
14. Viswabaskarana V.,Gnanama F.D, Balasubramanian M.: Ceram. Inter. 29, 561 (2003).
15. Viswabaskarana V., Gnanama F.D, Balasubramanian M.: Appl. Clay Sci. 25, 29 (2004).
16. Bagchi B., Das S., Bhattacharya A., Basu R., Nandy P.: J. Sol-Gel. Sci. Technol.55, 135 (2010).
17. T.Martišius., R.Giraitis.: J. Mater. Chem. 13, 121 (2002). 18. S.Aza R., Moya S.J., Epicier T., Fantozzi G.: J. Mat. Sci.
Lett. 9, 1400 (1990).
19. Torecillas Imose M., Takano Y., Yoshinaka M., Hirota Yamaguchi K.O.: J. Am. Ceram. Soc. 81, 1537 (1998). 20. Kong L.B., Zhang T.S., Ma J., Boey F.: J. Alloys. Compd.
359, 292 (2003).
21. Bagchi B., Das S., Bhattacharya A., Basu R., Nandy P.: J. Am. Ceram. Soc. 92, 748 (2009).
22. Esharghawi A., Penot C., Nardou F.:J. Eur. Ceram. Soc. 29, 31 (2009).
23. Chaudhuri S. P., Patra S. K., Chakraborty A. K.: J. Eur. Ceram. Soc. 19, 2941 (1999).
24. Kurajica Stanislav., Tkalcec Emilija., Schmauch Joerg.:J. Eur. Ceram. Soc. 27, 951 (2007).
25. Murthy M. K., Hummel F. A.: J. Am. Ceram. Soc. 43, 267 (1960).
26. Cameron W. E.: Am. Ceram. Soc. Bull. 56, 1003 (1977). 27. Kong L.B., Zhang T.S., Ma J., Boey F.:J. Eur. Ceram. Soc.
23, 2247 (2003).
28. Ferreira da Silva M.G.: J. Sol-Gel. Sci. Technol. 13, 987 (1998).
29. Tkalcec E., Kurajica S., Schmauch J.: Journal of Non-Crystalline Solids, 353, 2837 (2007).
30. Weizhong L., Qiu Qi., Wang Fang., Wei S., Liu Bo., Luo Z.: Ultrasonic Sonochemistry 17, 793 (2010).