*e-mail: josear@power.ufscar.br
Correlation Between Fracture Toughness, Work of Fracture
and Fractal Dimensions of Alumina-Mullite-Zirconia Composites
Sérgio Francisco dos Santos, José de Anchieta Rodrigues*
Department of Materials Engineering, UFSCar
Federal University of São Carlos, 13565-905, São Carlos - SP, Brazil
Received: June 20, 2001; Revised: January 23, 2003
The purpose of this work is to show the correlation between the fractal dimension, D, and mechanical properties such as work of fracture, γwof, and fracture toughness, KIc. Alumina-mullite-zirconia composites were characterized by the slit-island method, SIM, to obtain values of D and its fractional part, D*. The fracture surface roughness was also evaluated using a cyclic voltametric method. It will be shown that there is a positive experimental dependency of γwof on D*and that there is not an evident correlation between KIc and D*.
Keywords:work of fracture, fracture toughness, fractal dimension, roughness
1. Introduction
Ceramic materials are extensively used for specific ap-plications owing to their refractoriness and chemical stabil-ity. The brittleness of these materials, however, limits their applicability. Innumerable studies have focused on alterna-tives to offset this deficiency, and the development of micro-structures with toughening mechanisms offers a possible solution1.
To understand the action of the toughening mechanisms and to increase their effectiveness, it is necessary to study their action in the fracture process. This can be done by characterizing the fracture toughness, KIc, and the work of fracture, γwof, since these properties are related, respectively, to resistance to the onset of crack propagation and to total crack propagation process2.
Another important area that contributes to the study of the fracture process of ceramic materials is quantitative fractography, a method by which one can analyze the “his-tory” of the interaction between crack and microstructure and characterize the crack’s surface roughness3-8.
Surface roughness can be understood as geometrical ir-regularities on a smooth reference surface. The classic defi-nition of roughness, Rs, is given by the ratio of the real sur-face area, AR, to the projected area, A0, (smooth reference surface)3, which can be expressed as:
0 R s AA
R = (1)
To avoid problems with the above definition of rough-ness it must be in mind that the smooth reference surface must be parallel to the average real fracture surface. In this work only this simple definition of roughness will be used because it describes exactly what is made experimentally to determine Rs.
Although the physical meaning of Rs is simple, it is not ease to obtain it directly by experimental means since it is very difficult to measure AR. Therefore, Rs is usually evalu-ated indirectly through microscopic or nanoscopic tech-niques, or even using software for three-dimensional image analyses7. In addition, fractography involves several
com-plex techniques, so roughness can be defined in a variety of ways and can, for instance, be measured by several topo-graphic parameters, including real surface area3-4, real length
of a fracture profile3-4, angular distribution5-6, and the Fourier
spectrum8.
is currently under discussion. From this standpoint, fractal geometry is also an alternative tool to describe roughness, because the real area of fracture surfaces can be related with fractal characteristics such as the fractal dimension, D, and the fractional part of the fractal dimension, D*. The follow-ing theoretical relationship between Rs and D* has been proposed by Mandelbrot9:
* D s
R = η− (2)
where η is a non-dimensional parameter that is less than 1 and is related to the size of the ruler used to measure the length (or area). The fractional part of the fractal dimen-sion, D*, is defined as the fractal dimendimen-sion, D, minus the value 2 of the Euclidian dimension of a smooth surface.
Based on Eq. 2, some studies have attempted to corre-late the fractal characteristics of a fracture surface to its roughness, also taking into account the material’s micro-structure3,4,7,9,10.
Several studies have also attempted to correlate mechani-cal properties with the fractal dimension10-18. It has already
been shown that, in the case of ceramic materials, the values of some mechanical properties increase when the fractal di-mension increases. However must be emphasized that this is a very controversial subject and as an example, Charkaluk16
must be addressed, who presents experimental data showing positive, negative and no correlation between fracture tough-ness and fractal dimension. Nagahama17 deduced
theoreti-cally that it is possible a positive or a negative correlation depending on some microstructural parameter.
In the specific case of fracture toughness, KIc, it must be considered that this mechanical property is usually re-lated to catastrophic fracture tests, e.g., KIc-test. Such prop-erty can only be indirectly related to the topographic fea-tures of the fracture surface, since a significant portion of the elastic energy stored during testing is released in the form of heat, sound, and kinetic propagation energy. The KIc property is associated to the onset of crack propagation while D is related to the fracture surface as a whole. Hence, it is not yet clearly understood how KIc can be experimen-tally related to D, although several proposals have been made10,14,16-18. Some are based on the Griffith-Irwin concept,
which establishes that the critical elastic energy release rate, GIc, can be expressed, under plane stress condition19, as:
E K 2 G 2 Ic ef
Ic= γ = (3)
where γef is the effective fracture energy and E is the Young’s Modulus.
Most models suggest that, to calculate KIc, the real sur-face area must be considered. Thus, γef is calculated by
multiplying the sum of the thermodynamic energy of the surface, γ0, and that of the microplasticity at the tip of the crack, γp, by a fractal factor, η2−D. Hence, the expression can be written as:
D 2 P 0
ef ≈(γ +γ )⋅η −
γ (4)
The association of Eq. 3 with Eq. 4 produces the fol-lowing relation between KIc and D:
D 2 p 0 2
Ic 2( )
E K − η ⋅ γ + γ ≈ (5)
In Eq. 5, the fractal factor includes geometrical contri-butions of the microstructure to the fracture process of a polycrystalline material. Some works in the literature show good qualitative agreement between some proposed mod-els and the results obtained from several brittle materials, however there are also controversies14,17.
This paper seeks to verify the proposal that D or D* may be more adequately related to a mechanical property that reflects the average energy consumed by the crack dur-ing its entire propagation. This mechanical property could be the total energy of fracture, γwof. This property is evalu-ated along the complete fracture process through quasi-static crack propagation. Therefore, it can have a positive relation with the fractal dimension, which is also evaluated on the total fracture surface.
Rodrigues and Pandolfelli12 proposed that, in ceramic
materials in which only geometrical toughening mechanisms occur, a good correlation would be expected between the total energy of fracture, γwof, and D*. These geometrical toughening mechanisms cause the increase of total energy of fracture only through an increase of the real fracture sur-face area. Besides them, γwof is related with the total frac-ture process including the onset of the crack propagation. Another possible relation would be between the roughness, Rs, and the average resistance to crack propagation, R . These relations can be expressed by12:
* D x D 2 x 0 ef wof 0 R
s AA RR
R = =ε − =ε−
γ γ =
= (6)
where R0is the first R-value of an R-curve and must be equal to 2 γef. The average value of R, R , is given by:
(
α −α)
α α= α∫
where α0 and αf represent relative notch size and relative final crack length, respectively, for a sample subjected to a stable crack propagation test in order to obtain the R-curve. From the standpoint of the fractal theory, the parameter εx in Eq. 6 represents only the relative size of a length meas-ure unit, as represented by η in Eq. 2. If this were real, then Rs could not have a specific value that characterizes a frac-ture surface. Hence, εx could represent a non-dimensional construction unit of the fracture surface, which would have to be less than 1, and would be measurable by some micros-copy technique.
Si3N4-SiC composites were tested by Pezzotti and co-workers13, who experimentally found a relation between γ
wof and a fractal parameter. However, these researchers proposed no parametric relation involving either D and γwof or D and R , although they obtained the R-curves of those com-posites.
This paper, therefore, discusses the experimental rela-tion between D* and the mechanical properties, KIc and γwof, for alumina-mullite-zirconia composites with differ-ent amounts of mullite and zirconia phases. Electrochemical cyclic voltametry was also employed to measure the rough-ness of the fracture surfaces.
2. Experimental Procedure
2.1 Materials
The alumina-mullite-zirconia composites used for this study were prepared and their physical and thermo-mechanical properties characterized by Mazzei
et al.20,21. The samples were prepared by reaction sintering
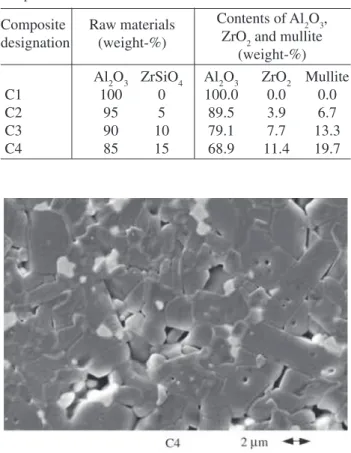
of alumina and zircon, using 0, 5, 10 and 15 wt% of zircon to produce the different composites. Samples with 62 mm × 6 mm × 5 mm dimensions were obtained through 60 MPa uniaxial pressing followed by sintering at 1650 °C for 2 h. The final phase compositions are shown in Table 1. Figure 1 shows the typical microstructure of the compos-ite prepared with 85 wt% of alumina and 15 wt% of zircon.
2.2 Mechanical characterization
An MTS model 810/458-series universal testing machine was used for the mechanical characterization. A 3-point bending test on machined samples was applied to obtain KIc and γwof values. Sets of at least 3 samples were em-ployed in each test condition with the aim of obtain average values for the properties.
Load, P, vs. displacement, d, curves with catastrophic
propagation were used to determine KIc. Mazzei et al.20,21
applied the conditions of plane strain established by ASTM E399-8122. The four-faces machined samples for this test
were straight notched applying a diamond-coated disk of 150 µm in thickness. The notch depth was 30% of the
sam-ple height to facilitate the catastrophic propagation of the crack. The final dimensions of the sample were approxi-mately 55 mm × 5 mm × 4 mm, being the 5-mm dimension oriented to be the height of the sample. A span of 40 µm was used in the 3-point bending arrangement. An actuator velocity of 5 mm/min was applied on samples C1 to C3, while 7 mm/min was applied on sample C4.
P vs. d curves, obtained from stable crack propagation
tests, were used to obtain γwof-values under 3-point bend-ing condition. The actuator velocity used in this case was 1 µm/min. The samples for these tests were prepared with a 90° Chevron notch, applying a 400 µm in thickness dia-mond-coated disk. The tip of the Chevron notch was at 30% of the sample height. The final dimensions of the sam-ples and the orientation of them in the bending test were the same already described for the fracture-toughness test. The final values of γwof were calculated using the value of the work required to reach complete fracture divided by double the projected fracture area.
Table 2 shows the values of KIc and γwof obtained by Mazzei et al.20,21.
Figure 1. Example of the microstructure of the C4-composite
ob-tained by SEM.
Table 1. Compositions produced for the alumina-mullite-zirconia
composites used in this work20,21.
Composite Raw materials Contents of Al2O3,
designation (weight-%) ZrO2 and mullite
(weight-%) Al2O3 ZrSiO4 Al2O3 ZrO2 Mullite
C1 100 0 100.0 0.0 0.0
C2 95 5 89.5 3.9 6.7
C3 90 10 79.1 7.7 13.3
2.3 Characterization of the composites’ fracture surfaces
The fractal dimension, D, was obtained applying the slit island method, SIM, proposed by Mandelbrot et al.11, using
the following steps15:
i. preparation of the fracture surface with a gold film deposited with a conventional Balzers sputtering de-vice;
ii. castable cold mounting of the fractured sample so that the medium fracture plane lay parallel to the im-aginary polishing plane;
iii. grinding and polishing were carried out with a semi-automatic Minimet/Buehler machine. 400 and 600 grade sandpaper was used to remove the excess resin from the surface, followed by 9, 6, 3, and 1 µm dia-mond paste to reveal the first island contours. From then on, only 1 µm diamond paste was used, alternat-ing polishalternat-ing (wear) and fractal measurements; iv. perimeter and area measurements were taken of the
islands using a Labophot-2/Nikon microscope with 100× magnification lens. A Synoptics Optamax V im-age analysis system was employed to facilitate the char-acterization. Considering the whole system used, the resulting ruler size (measurement unit) was 0.54 µm. At least 5 levels of wear were analyzed for each frac-ture surface. At least 4 to 8 different regions of the same surface were analyzed for each wear level. Besides this, both fracture surfaces of each sample were examined for a more representative measurement of fractal char-acteristics. At least 3 samples were used for each test condition.
Area-vs.-perimeter graphs were plotted on a
logarith-mic scale. By linear regression, the angular coefficients of the straight lines were obtained. The corresponding D-val-ues were calculated using the following equation:
ter) log(perime D
2 C
log(area) ⋅ +
= (8)
where C is a constant9-11.
The sharpness of the island boundaries in the image
analysis equipment depends, among other factors, on the how the sample was prepared, how long it was polished, and its cleanliness, as well as lighting, magnification, and focal distance of the equipment. To minimize the influence of these factors on the evaluation of the fractal dimension, an experimental procedure was adopted based on sugges-tions given by Russ23, i.e., only areas in the range of
400 µm2 to 8000 µm2 were measured with 100×
magnifica-tion.
An adapted cyclic voltametric method15 was applied to
measure the average voltametric roughness, Rv, with the pur-pose of evaluating the differences in roughness from one com-posite to another and to verify the relation between rough-ness and the fractal factor, D*
x
−
ε , established by Eq. 6.
3. Results and Discussion
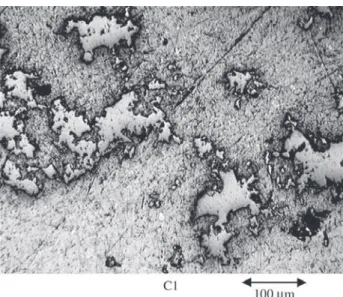
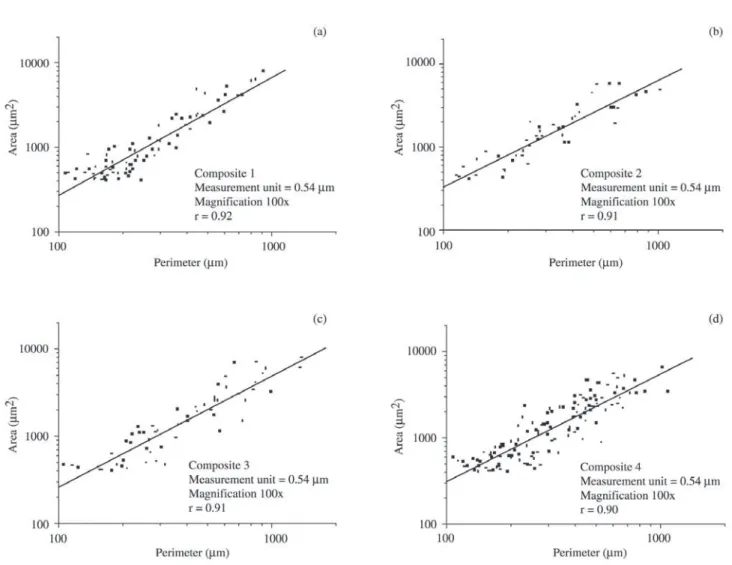
Figure 2 shows a typical optical image from slit islands of the alumina sample’s fracture surface, composition 1, C1, after several wear/polish steps. The slit islands are high-lighted in the photo by bright regions surrounded by dark boundaries, which are promoted by the deposited gold layer. Four examples of log (area) vs. log (perimeter) graphs
resulted from the application of SIM on alumina-mullite-zirconia composites are shown in Fig. 3. The increment of the fractal dimension values, D* = D - 1.00 were calculated based on these graphs. The value of 1.00 rather than 2.00 appears here because, for SIM, the island boundaries are fractal and their reference dimension is therefore equal to 1.00. This investigation was also based on the assumption
Table 2. Mechanical properties of the alumina-mullite-zirconia
composites20,21.
Composite KIc (MPa.m1/2) γ
wof(J/m2) designation
C1 5.3 ± 0.3 34 ± 4
C2 5.3 ± 0.1 50 ± 3
C3 5.4 ± 0.3 52 ± 3
C4 5.6 ± 0.03 67 ± 3
Figure 2. Example of the slit islands of the fracture surface of the
that the fractal dimension of the fracture surface is equal to the fractal dimension of the slit island boundary plus 1 unit9,11.
The graphs in Fig. 3 also show the straight lines ob-tained by linear regression, whose linearity can be verified by correlation factors equal or greater than 0.90. The D*-values were obtained from the angular coefficient of the straight line, using Eq. 8. Table 3 illustrates these D*-val-ues, while Fig. 4 plots these values as a function of the zir-con zir-content in the reaction.
Although the errors in D* are a little bit big, Fig. 4 ap-pears to indicate, a weak positive correlation between D* and the zircon content in the reaction, which in turn deter-mines the zirconia and mullite content in the composites, as shown in Table 1. Therefore, it can be thought that incrementing the content of these phases in the form of
dis-persed particles leads to an increase of the fracture surface’s fractal dimension. It is believed that zirconia and mullite particles generate the microcracking phenomenon20,21, which
in turn affects the fractal dimension. It should be kept in
Figure 3. Examples of log(area) × log(perimeter) graphs of the alumina-mullite-zirconia composites that were used to obtain D*-values.
(a), (b), (c), and (d) show plots for the C1, C2, C3, and C4 compositions of Table 1, respectively. The r-values shown in the captions of the graphs are the correlation factor of the linear regressions.
Table 3. D* values of the fracture surface of
alumina-mullite-zirconia composites obtained by SIM. The value of the ruler length was 0.54 µm.
Composite Zircon content in the D* (ad.) designation reaction (weight%)
C1 0 0.47 ± 0.09
C2 5 0.55 ± 0.08
C3 10 0.58 ± 0.04
mind that the microcracking toughening mechanism is as-sociated with other mechanisms of a geometrical nature, which can directly contribute to the building of the fracture surface’s topography. Among other mechanisms, crack de-flection and crack branching are very significant. There-fore, SIM was sufficiently sensitive to detect topographic differences in the fracture surfaces caused by changes in the composite’s microstructure.
Table 4 presents the values of the average voltametric roughness, Rv, for the materials investigated in this work.
From Table 4 it can be inferred that Rv does not depend on the zircon content in the composites’ formation reac-tion. On the other hand, considering experimental errors, the measured Rv-values agree with the estimated roughness Rs-values for alumina reported in the literature. Dörre and Hübner24 state that the fracture surface of a typical
polycrystalline alumina presents a real area that is 2 to 4 times larger than its projected area. However, we believe that the composites’ fracture surfaces used in our investiga-tion would show differing topographies, since the concen-tration of dispersed zirconia and mullite particles also
var-Table 4. Rv-values of the fracture surface of
alumina-mullite-zirconia composites. The samples used for this characterization were the same as those used for the γwof-tests.
Composite Zircon content in the Rv (ad.) designation reaction (weight-%)
C1 0 4.0± 0.9
C2 5 4 ± 1
C3 10 3.9 ± 0.9
C4 15 3.9 ± 0.9
Figure 4. D* values vs. zircon concentration for the
alumina-mullite-zirconia composites.
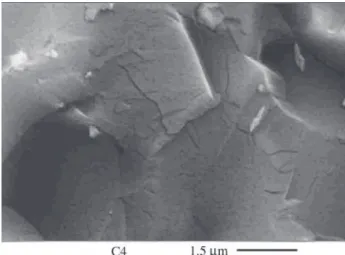
Figure 5. Details of a micrograph of the fracture surface of the
C4-composition showing microcracking.
ied. Furthermore, these composites presented increasing porosity with greater zircon content due to the dissociation occurring during the reaction of this raw material20,21. Hence,
the possibility that the electrochemical method is insensi-tive to minor differences in fracture surface roughness can-not be discarded.
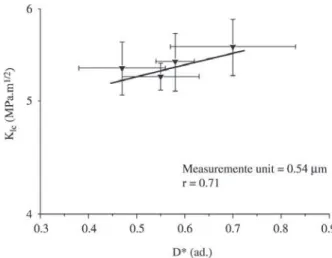
Tables 1 and 2 indicate a positive correlation between γwof and the zirconia and mullite content, but not an evident correlation between KIc and those particles content. It is presumed that this fact results from the sensibility of the γwof-test in recording the contribution of microcracking to the fracture process as a whole. This statement is corrobo-rated by the fact that MEV-micrographs show microcracks associated to the nearby region of zirconia particles in alumina grains, as shown in Fig. 5 for the composite C4. Although not shown here, it was found that this micro-cracking did not occur in the pure alumina sample (compo-sition C1 in Table 1)20,21.
Figure 6 shows that there is not an evident correlation between KIc and D* for the alumina-mullite-zirconia com-posites studied in this work, since the correlation factor of the linear regression is so low as 0.71. The absence of cor-relation illustrated in Fig. 6 agrees, to a certain extent, with the uncertainties about the clear relation between KIc and D* reported in the literature for distinct material classes, including ceramics16.
the composites studied here, involving a certain volume beneath the fracture surfaces and also consuming fracture energy. This, in turn, would have further contributed to the increase in γwof without necessarily disturbing the charac-teristics of the fracture surface.
Lastly, it can be said that these results are consistent, since the materials studied here presented mainly toughen-ing mechanisms that acted geometrically and contributed to the topography of the fracture surface. It should be kept in mind that the zirconia generated “in situ” is neither par-tial nor totally stabilized. The zirconia was, therefore, of
the monoclinic type and the resulting microcracks were caused by post-sintering cooling20,21. Thus, the change in
γwof-values as a function of D* depends on the extent to which these mechanisms participate in the fracture process and how this reflects on the development of the fracture surfaces. Consequently, the statement of Rodrigues and Pandolfelli12 about ceramic materials is correct, i.e., the
to-tal fracture energy is expected to rise with the increasing real area of the fracture surface when only purely geomet-ric toughening mechanisms occur. The monologarithmic plot of γwofvs. D*, in Fig. 7, corroborates the proposed relation given in Eq. 6.
4. Conclusions
The average voltametric roughness, Rv, is apparently not dependent on zirconia and mullite phase concentrations in the case of fracture surfaces of the alumina-mullite-zirconia composites studied in this work.
However, Rv-values found in this work are realistic and agree with reported values of other researchers.
There is not an evident positive relation between frac-ture toughness, KIc, and the fractal dimension, D, when the zirconia and mullite phase concentration was increasingly changed in the alumina-mullite-zirconia composites of this study. In the technical literature it is possible to find reports about positive, negative, and no correlation between the two mentioned parameters.
It was also found that there is a positive correlation be-tween γwof and D* in the alumina-mullite-zirconia compos-ites studied in this work. This emphasizes the fact that D* is far more appropriately related to a mechanical property di-rectly associated with the average energy consumed by the crack throughout its entire propagation.
Acknowledgements
The authors gratefully acknowledge the financial sup-port of FAPESP (Process Nº 96/01988-2) for this work. Thanks are also due to MSc. Ângela C.A. Mazzei for the composite samples, and to Prof. Dr. Carlos Alberto Avaca, University of São Paulo and Dr. Carlúcio Roberto Alves, Ceará State University, for their technical cooperation in applying the cyclic voltametric method. Last but not least, the authors thank Alcoa Alumínio S/A for its donation of the raw materials used in this study.
References
1. Steinbrech, R.W. - Toughening mechanisms for ceramic materials, J. Eur. Ceram. Soc., v. 10, p.131-142, 1992.
2. Sakai, M.; Bradt, R.C. - Fracture toughness testing of brittle materials, International Materials Reviews, v. 38,
n. 2, p. 53-78, 1993.
Figure 6. KIc versus D* monolog-graph for the
alumina-mullite-zirconia composites. The r-values are the correlation factor of the linear regression.
Figure 7.γwofvs. D*monolog-graph for the
3. Banerji, K. - Quantitative Fractography: A Modern Per-spective, Metall. Transactions A, v. 19, n. 4, p. 961-971,
1988.
4. Underwood, E.E.; Banerji, K. - Invited Review: Fractals in fractography, Material Science and Engineering, v.80,
p. 1-14, 1986.
5. Gokhale, A.M.; Underwood, E.E. - A general method for estimation of fracture surface roughness: Part I. Theo-retical Aspects. Metall.Transactions A, v. 21A, n. 5, p.
1193-1199, 1990.
6. Gokhale, A.M.; Drury, W.J. - A general method for esti-mation of fracture surface roughness: Part II. Practical Considerations. Metall. Transactions A, v. 21A, n. 5, p.
1201-1207, 1990.
7. Lange, D.A.; Jennings, H.M.; Shah, S.P. - Relationship between fracture surface roughness and fracture behavior of cement paste and mortar, J. Am. Ceram. Soc., v. 76, n.
3, p. 589-597, 1993.
8. Passoja, D.E.; Amborski, D.J. - Fracture profile analysis by Fourier transform methods, Microstrut. Sci., v. 6, p.
143-148, 1978.
9. Mandelbrot, B.B., The fractal geometry of nature, 3 ed.,
New York-USA, W.H. Freeman and Company, p. 468, 1983. 10. Xin, B.Y. et. al. - Quantitative characterization of the fracture surface of Si single crystals by confocal microscopy, J. Am. Ceram. Soc., v. 78, n. 12, p.
3201-3208, 1995.
11. Mandelbrot, B.B.; Passoja, D.E.; Paullay, A.J. - Fractal character of fracture surfaces of metals, Nature, v. 308,
n. 4, p. 721-722, 1984.
12. Rodrigues J.A.; Pandolfelli, V.C. - Insights on the fractal-fracture behaviour relationship, Materials Research, v.
1, n. 1, p. 47-52, 1998.
13. Pezzotti, G et. al. - Fractal character of fracture surfaces
and boundary values of toughness in simple
ceramic-ceramic system, Materials Science and Engineering A, v.197, p. 109-112, 1995.
14. Tanaka, M. - Fracture toughness and crack morphology in indentation fracture of brittle materials, J. Mat. Sci.,
v. 31, p. 749-755, 1996.
15. Santos, S.F. - Application of the fractals concept for analysis of the fracture process in ceramic materials,
São Carlos, 1999, 193p. Master’s Thesis, Programa de Pós-Graduação em Ciência e Engenharia de Materiais, Universidade Federal de São Carlos (in portuguese). 16. Charkaluk; E.; Bigerelle; M.; Iost, A. - Fractals and
frac-ture, Engineering Fracture Mechanics, v. 61, p. 119-139, 1998.
17. Nagahama, H. - A fractal criterion for ductile and brittle fracture, J. Appl. Phys. v. 75, n. 6, p. 3220-3222, 1994.
18. Mecholsky, Jr. J. J.; Freiman, S.W. - Relationship be-tween fractal geometry and fractography, J. Am. Ceram. Soc., v. 74, n. 12, p. 3136-3138, 1991.
19. Broek, D. - Elementary engineering fracture mechan-ics - Martinus N. Publishers, Boston, p. 469, 1983.
20. Mazzei, A.C., Rodrigues, J.A. – Alumina-mullite-zirconia composites obtained by reaction sintering – Part I Microstructure and mechanical behaviour, J. Mat. Sci.,v. 35, p. 2807-2814, 2000.
21. Mazzei, A.C., Rodrigues, J.A., Pandolfelli, V.C. – Alumina-mullite-zirconia composites obtained by re-action sintering – Part II R-Curve behaviour, J. Mat. Sci., v. 35, p. 2815-2824, 2000.
22. Standart Test Method for Plane Strain Fracture Tougheness of Metallic Materials, E399-81.
23. Russ, J.C. - Fractal Surfaces, Plenum Publishing Corp,
1st ed., New York-USA, p. 309, 1994.
24. Dörre, E., Hübner, H. - Alumina processing, properties and applications, 1st ed., Berlin - German
