www.ann-geophys.net/26/3557/2008/ © European Geosciences Union 2008
Annales
Geophysicae
Five-day planetary waves in the middle atmosphere from Odin
satellite data and ground-based instruments in Northern
Hemisphere summer 2003, 2004, 2005 and 2007
A. Belova1, S. Kirkwood1, D. Murtagh2, N. Mitchell3, W. Singer4, and W. Hocking5 1Swedish Institute of Space Physics, P.O. Box 812, 98128 Kiruna, Sweden
2Chalmers University of Technology, Gothenburg, Sweden 3University of Bath, Bath, UK
4Leibniz Institute for Atmospheric Physics, K¨uhlungsborn, Germany 5University of Western Ontario, London, Ont., N6A 3K7, Canada
Received: 13 December 2007 – Revised: 8 July 2008 – Accepted: 10 October 2008 – Published: 17 November 2008
Abstract. A number of studies have shown that 5-day plan-etary waves modulate noctilucent clouds and the closely re-lated Polar Mesosphere Summer Echoes (PMSE) at the sum-mer mesopause. Sumsum-mer stratospheric winds should inhibit wave propagation through the stratosphere and, although some numerical models (Geisler and Dickinson, 1976) do show a possibility for upward wave propagation, it has also been suggested that the upward propagation may in practice be confined to the winter hemisphere with horizontal prop-agation of the wave from the winter to the summer hemi-sphere at mesohemi-sphere heights causing the effects observed at the summer mesopause. It has further been proposed (Garcia et al., 2005) that 5-day planetary waves observed in the sum-mer mesosphere could be excited in-situ by baroclinic insta-bility in the upper mesosphere. In this study, we first extract and analyze 5-day planetary wave characteristics on a global scale in the middle atmosphere (up to 54 km in temperature, and up to 68 km in ozone concentration) using measurements by the Odin satellite for selected days during northern hemi-sphere summer from 2003, 2004, 2005 and 2007. Second, we show that 5-day temperature fluctuations consistent with westward-traveling 5-day waves are present at the summer mesopause, using local ground-based meteor-radar observa-tions. Finally we examine whether any of three possible sources of the detected temperature fluctuations at the sum-mer mesopause can be excluded: upward propagation from the stratosphere in the summer-hemisphere, horizontal prop-agation from the winter-hemisphere or in-situ excitation as a result of the baroclinic instability. We find that in one case, far from solstice, the baroclinic instability is unlikely to be involved. In one further case, close to solstice, upward prop-Correspondence to:A. Belova
agation in the same hemisphere seems to be ruled out. In all other cases, all or any of the three proposed mechanisms are consistent with the observations.
Keywords. Meteorology and atmospheric dynamics (Mid-dle atmosphere dynamics; Waves and tides)
1 Introduction
In several papers a relationship has been found between 5-day planetary waves and other natural events in the sum-mer polar mesosphere. For example, using local ground-based radar observations and UKMO assimilated global data, it was found that variations in Polar Mesosphere Summer Echoes (PMSE) at heights 80–90 km are closely anti corre-lated with temperature variations associated with 5-day plan-etary waves in the stratosphere at the 1 mb level (Kirkwood and R´echou, 1998; Kirkwood et al., 2002). In the experi-mental studies by Kirkwood et al. (2002) and Kirkwood and Stebel (2003) a correlation was demonstrated between the probability of observing noctilucent clouds (NLC, which in-clude the clouds known as PMC, but are observed by ground-based instruments, at 80–85 km heights) and the combined effects of stationary, 16-day and 5-day planetary waves at the NLC location. In an experimental study based on data from the Student Nitric Oxide Explore Satellite (SNOE) by Merkel et al. (2003) it was found that variations in the bright-ness of Polar Mesospheric Clouds (PMC) had a 5-day pe-riod which corresponded to the 5-day wave observed in the polar summer mesosphere at high latitudes. This result has been confirmed in another paper by Merkel et al. (2008) who also compared the brightness of PMCs seen by SNOE with mesospheric temperatures by the SABER instrument aboard the TIMED satellite, for the summer seasons in both hemi-spheres during 2002–2003. Their results show the presence of planetary wave activity in both PMCs and mesospheric temperatures that are strongly correlated to each other and one of the dominant waves is a 5-day wave with wavenum-ber 1.
In another experimental study, von Savigny et al. (2007), considered the NH summer of 2005, and reported a good general agreement in the quasi 5-day wave activity of NLC occurrence rates (using SCIAMACHY/Envisat limb scatter-ing measurements) and the mesosphere temperature field (from temperature profiles measured with MLS/Aura), indi-cating that planetary wave signatures in the temperature field are the main driver of corresponding signatures in NLCs.
The observations of 5-day wave effects at the summer mesopause are somewhat surprising since the upward prop-agation of 5-day planetary waves should be effectively hin-dered by the prevailing westward winds in the summer strato-sphere and mesostrato-sphere. Although some numerical models (Geisler and Dickinson, 1976) do show a possibility for up-ward wave propagation, it has also been suggested that the upward propagation may in practice be confined to the win-ter hemisphere with horizontal propagation of the wave from the winter to the summer hemisphere at mesosphere heights causing the effects observed at the summer mesopause.
Another possible source for planetary waves in the sum-mer polar mesosphere is the baroclinic instability of the east-erly jet in summer time. Plumb (1983) discussed theoreti-cally the possible occurrence of such baroclinic instability. He pointed out that, around the solstices, the stratospheric easterlies in the summer hemisphere intensify because of
heating in the high-latitudes regions. Almost at the same time, a strong westerly shear develops in the upper meso-sphere driven by internal gravity wave stress (Holton, 1982; Matsuno, 1982). Eventually this shear may become so strong that the jet becomes baroclinically unstable, a process that could lead explain the appearance of the two-day planetary wave. Garcia et al. (2005), who extracted planetary-scale waves from temperature data measured by the SABER in-strument, have found that not only the “2-day wave” attains large amplitudes during the solstice in the summer meso-sphere, but a spectrum of waves, including the 5-day wave, that cluster along a line of constant westward phase velocity. The observed structure of these waves, and the fact that they were found to be present with high amplitude only close to the solstices, was found to be consistent with excitation of a spectrum of atmospheric normal modes by baroclinic in-stability of the easterly summer jet in the mesosphere. In another experimental study based on the SABER measure-ments, (Riggin et al., 2006) found that the 5-day wave prop-agated upwards in the winter hemisphere but was then am-plified at the summer high-latitude mesosphere by baroclinic instability.
In this paper we use both global satellite observations and local ground-based radar observations to investigate the 5-day wave behavior. Space and time filtering of satellite and ground-based data are used to distinguish 5-day plan-etary waves from other atmospheric phenomena and to in-vestigate their propagation characteristics between the strato-sphere and the mesostrato-sphere.
2 Data sources and technique of data analysis
The Odin satellite (Murtagh et al., 2002) was placed into a 600 km sun-synchronous, terminator orbit on 20 February 2001. One of the Odin instruments is an advanced sub-mm radiometer (SMR) which is used for both astronomy and aeronomy missions. In this work we use retrieved ozone and temperature profiles (level-2 version 2.0) produced at the Chalmers University of Technology (Gothenburg) from mea-surements of the Odin Sub-Millimetre Radiometer (SMR) at 544.6 GHz (Frisk et al., 2003; Olberg et al., 2003; Urban et al., 2005).
August 2003, 14 June–11 August 2004, 27 July–17 Septem-ber 2005. There is also one time period available with contin-uous measurements each second day, 22 May–17 June 2007. Note that the ozone retrievals are reliable over a much larger height range than the temperature retrievals. The re-trieved fields of temperature and ozone mixing ratio are avail-able between 82◦N and 82◦S on a grid of about 7◦ in
lati-tude and 30◦ in longitude at mid-latitudes and 15◦–20◦ at
high latitudes. These data have been linearly interpolated to a 2.5◦×3.75◦latitude-longitude grid for the analysis described
in this paper. Missing orbits and short data gaps in time have also been linearly interpolated. The fraction of missing orbits in our case is about 5% of all available data.
Complete coverage of all longitudes is provided by Odin in 12 h (using both ascending and descending nodes). In or-der to extract the signatures of 5-day planetary waves, we first extract the wave-component with spatial wavenumber 1 from each 12 h period of global coverage. This is done by applying a spatial Fourier transform to the values of tem-perature or ozone concentration around each latitude circle, at each height. The lowest harmonic component represents wavenumber one. In order to find the “5-day” temporal com-ponent, we then apply a time-domain band-pass filter (4–6 day band-pass) to the time series of the complex amplitude (equivalent to the amplitude and spatial phase) of this low-est harmonic spatial component. By using a bi-directional filter we avoid introducing artificial phase shifts and, by us-ing a filter with complex coefficients, we are able to extract only westward travelling waves. Odin’s observing sched-ule is usually such that it makes atmospheric observations in two consecutive 12-h periods, then there is a gap of 24 or 48 h (depending on measurement schedule), followed by two more 12-h observation periods. This gap has to be filled by interpolation of the wavenumber one amplitude and phase. The 5-day waves should have slowly varying amplitude and a steady phase progression around the globe, taking 5-days for a complete circuit. Thus the interpolation can accurately represent these waves provided there are no strong disturbing signals from waves with shorter periods than the data gap. Fortunately, according to published analyses of observations from other satellites, we can expect 3-day and longer periods to dominate at wave number 1 (Hirota and Hirooka, 1984; Hirooka and Hirota, 1985; Venne, 1985). The final result of this procedure is a time series, with 12 h time resolution, of the amplitude and spatial phase of the westward travelling, spatial wavenumber one, 4–6 day wave, separately for each latitude and height in the original grid. This can be used to recalculate the perturbation due to the wave as a time series for any latitude, longitude and height. We call the tempera-ture (or ozone mixing ratio) variation due to the 5-day wave, calculated for a particular location, a “5-day perturbation”.
Validation of the Odin ozone data has been reported by Kopp et al. (2007), who made an intercomparison of Odin-SMR ozone profiles with ground-based ozone obser-vations. The results showed that the Odin measurements at
544.9 GHz yielded a systematic bias of 20–30% lower ozone mixing ratios in the middle stratosphere than the ground-based measurements. However, in our work, only perturba-tions in ozone are evaluated and any systematic bias in the absolute values of ozone mixing ratio should not affect our results.
To check the Odin temperature retrievals (from the 544.9 GHz channel) we have compared with temperature data (version 2.2, level 2) obtained by the Microwave Limb Sounder (MLS) experiment during the Aura mission (Schwartz et al., 2008) for the period 27 July–17 September 2005. The results show 5–15% lower values of the zonal mean temperature from the Odin data compared to MLS. A comparison (not shown) between the 5-day temperature perturbations extracted from the Odin and Aura data demon-strates that the perturbation amplitudes in the winter strato-sphere, where planetary waves are strong, have almost the same magnitude (1–4 K from Odin, 1–5 K from Aura) and the perturbation phases and amplitude changes are very sim-ilar between the data sets. Thus, it seems that the Odin data are sufficiently reliable to estimate the properties of 5-day planetary waves, at least for locations and time intervals with reasonably large wave amplitude.
For additional information on planetary wave properties, we use ground-based measurements obtained with meteor radars located in northern Sweden at Esrange (67◦56′N,
21◦04′E), in northern Norway, at Andenes (69◦17′N,
16◦00′E), in northern Canada, at Resolute Bay, (74◦30′N,
95◦00′W) and at Yellowknife, (62◦30′N, 114◦32′W). The
decay time of meteor trails is used to provide estimates of temperature between 85–90 km height. The technique of deriving temperature from meteor echoes can be found in Hocking et al. (2004) and references there-in. Ground-based measurements in this case are the time series of average tem-perature for each day. Temtem-perature data for 2003 and 2007 were obtained from the meteor radar at Esrange; for 2004 – from meteor radars at Andenes, Resolute Bay and Yel-lowknife; for 2005 – from meteor radars at Esrange, Resolute Bay and Yellowknife.
The time series of temperature data from the meteor radars have been filtered, using the same bandpass as for the Odin data, to extract wave components with periods of 4–6 days, to match the 5-day waves found from the satellite data. Note that we cannot distinguish between perturbations due to wavenumber 1 and higher-order waves, nor between west-ward and eastwest-ward traveling disturbances, nor contributions from non-periodic changes, in these temperature data.
−900 −60 −30 0 30 60 90 0.5
1 1.5 2 2.5
∆
T
∆T, 15−29 July 2003
−900 −60 −30 0 30 60 90
0.05 0.1
∆
O3
∆O3, 15−29 July 2003
−900 −60 −30 0 30 60 90
0.5 1 1.5 2 2.5
latitude
∆
T
∆T, 7−17 Sept. 2005
−900 −60 −30 0 30 60 90
0.05 0.1 0.15
latitude
∆
O3
50 km 64 km
50 km 64 km
∆O3, 7−17 Sept. 2005
38 km
40 km
(a)
(c)
(b)
(d)
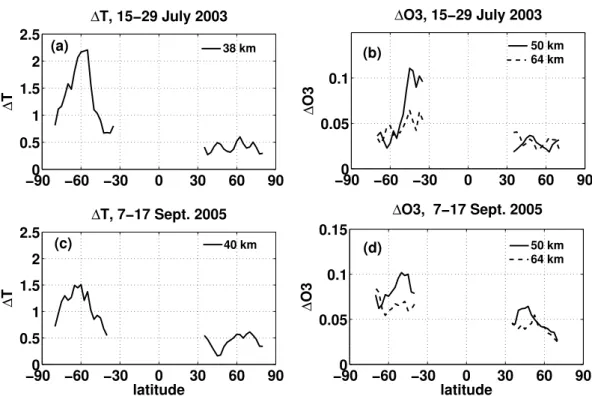
Fig. 1. Mean amplitude of the 5-day planetary wave as a function of latitude from measurements by Odin over the period 15–29 July,
days 196–210, 2003(a, b)and 7–17 September, days 250–260, 2005(c, d). Left hand panels are for the wave in temperature (K) at 38 km (a) and 40 km (c), right hand panels are for the wave in ozone (ppmv) at 50 km (solid line) and 64 km (dashed line).
to the original 5-day wave calculated from non-permutated wave number one. Finally, a comparison between random 5-day waves and the original 5-5-day wave has been made on the basis of the maximal wave amplitude (i.e. if the amplitude of the original wave is higher than 80% of the wave amplitudes resulting from random permutation of the data, we say it is of 80% significance). The significance of the 5-day temperature waves from the meteor radar data has been tested in the same way by applying the same random permutation technique but to the daily temperature estimates, and then, amplitude com-parison between the original and random 5-day waves.
An additional test on the significance of the calculated 5-day waves in the Odin data has been performed using the well-known physical property of this wave, that it should show phase coherence between different latitudes at middle latitudes. Latitude bands between 40◦–60◦N and 40◦–60◦S
have been considered for all heights and for each period to se-lect those time intervals when the 5-day wave shows a phase-coherent pattern for the whole latitude band. Only one or two short time intervals have been found in each available measurement period when this criterion is satisfied. Note that for some intervals there is a substantial phase shift be-tween the wave structures observed at the equivalent lati-tude bands in opposite hemispheres. This behaviour is not a contra-indication of 5-day waves. For example, Prata (1989) demonstrated that the phase of the 5-day temperature wave,
derived using a barotropic normal mode model, could change up to 180◦between 60◦–70◦S and 60◦–70◦N (for solstice
conditions in the case of no background winds in the middle atmosphere).
Finally, we use winds from the meteor-radar at Esrange to give a measure of the 2-day wave amplitude at mesopause heights. As discussed in the introduction, this wave is consid-ered to be produced by baroclinic instability, so that changes in its amplitude should give a good indication of whether the latter source is generating strong waves, or not. Temperature estimates from the meteor radars can be made only with 24-h time resolution so they are not very suitable to look for 2-day waves. Winds are routinely measured with 1-h time resolu-tion, and the 2-day wave is readily detected in the winds (e.g. Pancheva et al., 2004). For the present study we use merid-ional wind and apply a filter with bandpass of 36–54 h.
160 170 180 190 200 210 220 230 240 −2
0 2
196:210, Days 2003
∆
T, K
160 170 180 190 200 210 220 230 240
−2 0 2
166:224, Days 2004
∆
T, K
160 170 180 190 200 210 220 230 240 250 260
−4 −20 2 4
208:260, Days 2005
∆
T, K
150 160 170 180 190 200 210 220 230 240
−2 0 2
152:168, Days 2007
∆
T, K
∆ T, 60N ∆ T, 60S
(a)
(c)
(b)
(d)
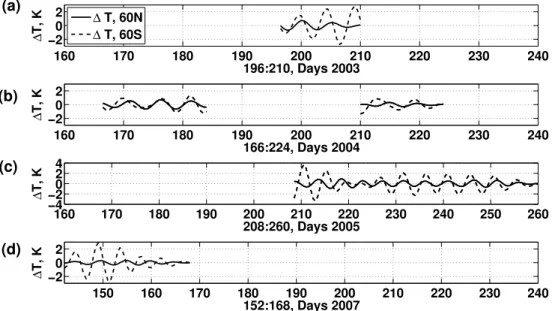
Fig. 2.5-day perturbations from Odin temperature retrievals. Solid lines are for 60◦N, dashed lines are for 60◦S.(a)for period 15–27 July
2003; altitude=38 km, longitude=21◦E.(b)for period 14 June–11 August 2004, altitude=40 km, longitude=16◦E.(c)for period 27 July–17
September 2005, altitude=42 km, longitude=21◦E.(d)for period 22 May–17 June 2007, altitude=46 km, longitude=21◦E.
3 Results
3.1 Planetary wave characteristics from the Odin data 3.1.1 Mean amplitudes of the 5-day wave in temperature
and ozone
First, we consider the 5-day planetary waves (with signifi-cance more than 80%) in the stratosphere obtained from the temperature and ozone data using Odin. Figure 1 demon-strates the mean amplitude of the 5-day wave for two short time intervals when coherent wave–phase has been observed between 40◦–60◦N and between 40◦–60◦S. The wave
am-plitude is shown as a function of latitude during the Northern Hemisphere (NH) summer periods of 2003 (15–29 July, a, b) and 2005 (7–17 September, c, d). Left hand panels are for the wave amplitude in temperature (K) at 38–40 km and right hand panels are for the wave amplitude in ozone (ppmv) at 50 and 64 km. The common feature of the curves in Fig. 1 is that the 5-day wave is observed in both hemispheres but with highest amplitude (more than 2 K in temperature and more than 0.1 ppmv in ozone) in the winter hemisphere (Southern Hemisphere, SH) at 50◦–60◦S. In the summer hemisphere
(NH) the wave amplitude in temperature is equal to 0.2–0.6 K and in ozone equal to 0.025–0.06 ppmv. These wave ampli-tudes have the same range as Prata (1989, 1990) has obtained for the 5-day planetary wave using temperature and ozone from the SBUV-instrument on the Nimbus-6 and Nimbus-7 satellite data.
Note that the difference between wave amplitudes in op-posite hemispheres in Fig. 1c, d (7–17 September 2005) is slightly less than in Fig. 1a, b (15–29 July 2003), likely
be-cause the first case is closer to the equinox when the ampli-tudes should be approximately equal and symmetric relative to the equator.
3.1.2 Characteristics of the 5-day perturbations in ozone and temperature at 60◦N and 60◦S
One of the typical characteristics expected for 5-day plan-etary waves is a global pattern with a (usually) symmetric phase structure relative to the equator. Study of the wave phase has been performed (see the second last paragraph in Sect. 2) for the latitude bands between 40◦–60◦N and 40◦–
60◦S and the results show that, even when the wave
pat-tern is coherent over the whole band in each hemisphere, sometimes there is a phase difference between the latitude bands in the opposite hemispheres. To see whether our ob-servations usually show asymmetry about the equator we compare the phases of the 5-day perturbations in the high-latitude regions at 60◦N and 60◦S in Fig. 2, which
repre-sents the 5-day perturbations of temperature at 38–46 km for the NH summers 2003, 2004, 2005 and 2007. The curves for the different periods are shown at slightly different altitudes, chosen to correspond to the highest significance (>75%) of the 5-day perturbations. Figure 2a, c, d illustrates the per-turbations at longitude=21◦E, over Esrange and Fig. 2b at
longitude=16◦E, over Andenes. This is for comparison later
160 170 180 190 200 210 220 230 240 −0.05
0 0.05
5−day perturbation in ozone (ppmv), 60N
Days 2003
∆
O3
160 170 180 190 200 210 220 230 240
−0.05 0 0.05
Days 2004
∆
O3
160 170 180 190 200 210 220 230 240 250 260
−0.1 0 0.1
Days 2005
∆
O3
150 160 170 180 190 200 210 220 230 240
−0.05 0 0.05
∆
O3
Days 2007
48 km 64 km 50 km 64 km
48 km 64 km
50 km 64 km
(a)
(b)
(c)
(d)
Fig. 3.5-day ozone perturbations from Odin at 60◦N for the NH summers of 2003, 2004, 2005 and 2007.
Table 1. Amplitudes of 5-day temperature perturbations at 38–
46 km height.
Summer Winter hemisphere, hemisphere,
60◦N 60◦S
Fig. 2a (2003), 38 km 0.2–0.6 K 0.5–2.7 K Fig. 2b (2004), 40 km 0.1–0.6 K 0.5–1.5 K Fig. 2c (2005), 40 km 0.1–0.9 K 0.5–3.9 K Fig. 2d (2007), 46 km 0.1–0.5 K 0.5–2.9 K
time intervals there is a phase shift between the perturbations in the opposite hemispheres at 60◦N and 60◦S, at most 1.5
days, corresponding to∼108◦for the 5-day wave.
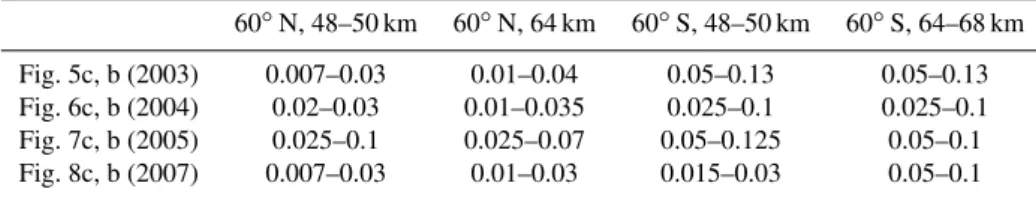
Also the 5-day perturbation in ozone has been examined. These perturbations are plotted in Figs. 5–8 as lines (b) and (c) and will be discussed in detail later in Sect. 3.3. For the moment we note only that the global pattern with approxi-mately symmetric phase structure about to the equator, in-cluding high latitudes (60◦N and 60◦S), is found in ozone
perturbations for days 196–214, 2003 (Fig. 5, curve b) and days 210–224, 2004 (Fig. 6, curve b) at 64–68 km.
A further feature of the waves in temperature and ozone, which is apparent in Figs. 2 and 5–8 is that the amplitudes of 5-day perturbations are highest in the SH (dashed lines in
Fig. 2 only) for all periods. Tables 1 and 2 summarize the am-plitudes of the 5-day perturbations in temperature and ozone as plotted in the figures. Amplitudes in temperature are about 2–5 times more in the SH (winter) than in the NH (summer). The 5-day perturbation amplitudes in ozone are also gener-ally greater in the winter hemisphere (at 60◦S) than in
sum-mer one (at 60◦N). But there is one case when a large
am-plitude (∼0.1 ppmv) is observed at 60◦N. This occurs just
before the equinox in September 2005 (days 240–250, upper panel in Fig. 7, curves c, b) at 50 and 64 km, and the am-plitude values have the same magnitude range as the ozone perturbations in the opposite hemisphere at 60◦S (days 240–
250, lower panel in Fig. 7, curves c, b). This is likely due to the near-equinox conditions, when the 5-day perturbations should have approximately equal amplitudes in both hemi-spheres. In temperature perturbations for this interval the amplitude is still greater at 60◦S than at 60◦N.
To summarize, the 5-day perturbations in temperature and ozone show larger amplitudes in the SH (winter) than in the NH (summer), as expected because of more favorable conditions for wave propagation in the winter hemisphere than in the summer one, due to the eastward and westward zonal winds in the stratosphere in winter and summer, re-spectively. The global pattern with approximately symmet-ric phase structure between the hemispheres, including high latitudes (60◦N and 60◦S), is found most of the time in
temperature perturbations at∼40 km height and part of the
Table 2.Amplitudes of the 5-day ozone perturbations (ppmv) at 48–50 km and 64–68 km, at 60◦N and 60◦S.
60◦N, 48–50 km 60◦N, 64 km 60◦S, 48–50 km 60◦S, 64–68 km
Fig. 5c, b (2003) 0.007–0.03 0.01–0.04 0.05–0.13 0.05–0.13 Fig. 6c, b (2004) 0.02–0.03 0.01–0.035 0.025–0.1 0.025–0.1 Fig. 7c, b (2005) 0.025–0.1 0.025–0.07 0.05–0.125 0.05–0.1 Fig. 8c, b (2007) 0.007–0.03 0.01–0.03 0.015–0.03 0.05–0.1
amplitudes in the winter hemisphere, the general phase-symmetry but occasional lack of phase-phase-symmetry about the equator coincides with conclusions reached in several previ-ous works. For example, Hirota and Hirooka (1984) showed that spatially irregular patterns of the 5-day wave amplitude appear in the winter season of both hemispheres with max-imum amplitude near 70◦ latitude. The latter results were
obtained using TIROS-N and NOAA-A satellite temperature measurements and demonstrated that 5-day wave amplitudes in the upper stratosphere in the winter hemisphere are about 5 times more those in the summer hemispheres. Similar re-sults have been found by Prata (1989, 1990) who also found a small but noticeable asymmetry in the amplitude and phase structure of the 5-day wave at 42 km during the solstices us-ing observations from the Nimbus-6 and Nimbus-7 satellites (up to 90◦/120◦ phase difference in temperature/ozone
be-tween opposite hemispheres). Also, the amplitude asym-metry in the present data coincides with theoretical consid-erations by Miyoshi (1999) who predicted that the 5-day wave amplitude in the stratosphere in the winter hemisphere is larger than in the summer hemisphere, based on a gen-eral circulation model. Garcia et al. (2005) have demon-strated, based on measurements in made in 2002–2004 by the SABER instrument, that the global (symmetric) mode of the 5-day wave was detected clearly only in near-equinox data, and the wave was not distinctly identified as a global mode during the northern or southern winter solstice.
3.1.3 Phase change in the 5-day ozone perturbations with height at 60◦N
As the ozone data from Odin are available for a large height range (up to 68 km), it is possible to study the phase change in the ozone perturbation with height in the summer hemi-sphere. Figure 3 shows the ozone perturbations at 48–50 km and 64 km at 60◦N for the NH summer of 2003 (a), 2004
(b), 2005 (c) and 2007 (d). In Fig. 3 one can see a phase shift between the ozone perturbations by up to 180◦for some
time intervals. Several previous studies show similar phase shifts. The experimental study by Rosenlof and Thomas (1990) has demonstrated a nearly 90◦ phase shift between
50 and 64 km (and 180◦phase shift between 50 and 95 km)
in a 5-day ozone wave in the summer hemisphere (results based on the Solar Mesosphere Explorer (SME) ozone data).
In the model simulation by Salby (1981b), it was found that the phase shift between 50 and 70 km could be between 45◦–
135◦, depending on wind conditions. Another model result
by Geisler and Dickinson (1976) has shown a phase shift up to 180◦between 42 and 70 km at 60◦latitude for the case of
strong solstice zonal wind. Thus, our results are not contrary to the previous studies.
3.2 Planetary wave characteristics at the summer mesopause obtained by ground-based meteor radars Temperatures close to the mesopause (85–90 km), as mea-sured by meteor radars, over northern Scandinavia (Andenes and Esrange) and Canada (Yellowknife and Resolute Bay) are used here to look for evidence of the 5-day wave at mesopause heights. Statistical significances of the 5-day temperature perturbations extracted from the meteor radar temperatures are generally high, between 74% and 97%.
For the NH summers 2004 and 2005, the meteor-radar temperature data sets are available for several locations and the calculated 5-day perturbations from these data are pre-sented in Fig. 4. The upper panel of Fig. 4 shows the 5-day temperature variations over Yellowknife, Resolute Bay and Andenes for 2004; the lower panel illustrates the 5-day os-cillations over Yellowknife, Resolute Bay and Esrange for 2005. For the summers of 2003 and 2007, only temperature data over Esrange are considered and the extracted 5-day per-turbations for these periods are shown as line (a) in Figs. 5, 7 and 8 (these figures will be discussed further in Sect. 3.3).
These figures show that, in general, the waves appear in bursts in the summer mesopause region with amplitudes reaching∼2.5–5 K. This is in agreement with experimental
results by Merkel et al. (2008) who found wave amplitudes of 2–3.5 K around the summer mesopause in 2002–2003 using results from the SABER instrument on the TIMED satellite. The maximum wave amplitude,∼15 K, is observed over
Yel-lowknife for the summers of 2004 and 2005 (dashed lines in Fig. 4). This high wave amplitude supports the simulation results by Geisler and Dickinson (1976) who suggested that the 5-day wave amplitude in the summer mesosphere could reach as much as 10 K.
170 180 190 200 210 220 230 −10
0 10
∆
T, K
Days 2004
∆ T, from the meteor radars at 85−90 km
210 215 220 225 230 235 240 245 250 255 260
−10 0 10
∆
T, K
Days 2005 Esrange
Resolute Bay Yellowknife
Andenes Resolute Bay Yellowknife
Fig. 4. 5-day wave perturbations obtained from ground-based radar measurements of temperature by meteor radars: Upper panel: for 14
June–11 August 2004. Solid line is from temperature data over Andenes (69◦17′N, 16◦00′E), at 90 km; dashed line is from temperature data
over Yellowknife, (62◦30′N, 114◦32′W) at 88 km; dotted line is from temperature data over Resolute Bay (74◦30′N, 95◦00′W) at 87 km.
Lower panel: for 27 July–17 September 2005. Solid line is from temperature data over Esrange (67◦56′N, 21◦04′E), at 85 km; dashed and
dotted lines are from Yellowknife and Resolute Bay, respectively.
Scandinavia (solid line) and over Canada (dotted line). The phase shift of 1.5–2.5 days is a reasonable result if we con-sider westward traveling planetary waves from 16◦E–21◦E
to the 95◦W–114◦W longitude sector, which is between two
sites separated by 111◦–135◦in longitude. A 5-day (with
pe-riod varying between 4.5 and 6 days) planetary wave of zonal wave number 1 propagates westward by 60◦–80◦degrees of
longitude per day, thus it propagates 111◦–135◦westward in
1.4–2.25 days. Figure 4 also demonstrates good coincidence in phase for waves over Canada, at Resolute Bay (95◦W)
and at Yellowknife (114◦W), which are located quite close
to each other in longitude, for days 217–230, 2004 (upper panel) and days 233–247, 2005 (lower panel).
Thus, the evidence is good that the meteor radars really do see the temperature perturbations caused by 5-day, westward traveling, planetary waves and that the temperature pertur-bations are substantial (up to 15 K), particularly over Yel-lowknife at 62◦N. We note that latitudes near 60◦ are the
most favorable of all our meteor-radar latitudes for ground-base NLC observations and 5-day periodicities have also been reported in NLC observed from the ground (Kirkwood et al., 2003).
3.3 Comparison of planetary waves between Odin strato-spheric/mesospheric data and ground-based radar mea-surements near the mesopause
In the upper stratosphere, where ozone concentration is pho-tochemically controlled, i.e., ozone is very short lived and is approximately in photochemical equilibrium (Brasseur and Solomon, 1986), an increase in temperature will increase the rate at which ozone is destroyed and therefore will tend to induce a change in ozone of the opposite sign. So temper-ature and ozone are anticorrelated. In the numerical sim-ulation by Smith (1995) it was shown that the anticorrela-tion of mean ozone and temperature is due primarily to the temperature dependence of many of the photochemical reac-tion rates. The experimental work by Calisesi et al. (2004) has also demonstrated that the ozone is negatively corre-lated with temperature above 40 km. Pendlebury et al. (2008) calculated time-lagged correlation of temperature and ozone in Northern hemisphere summer (at 52◦N) using the
Fig. 5. Wave perturbations for 15 July–13 August 2003: Upper panel: 2-day wave from ground-based radar measurements of meridional wind (m/s) over Esrange (67◦56′N, 21◦04′E), at 90 km. Middle panel: 5-day perturbations: (a) from ground-based radar measurements of
temperature over Esrange (67◦56′N, 21◦04′E), at 85 km. (b–d) from Odin retrievals at latitude=60◦N, longitude=21◦E: for ozone (ppmv)
at 64 km (b) and at 50 km (c), for temperature (K) at 38 km (d), (Note: reverse scale for ozone). Lower panel: 5-day perturbations: (a) same as on the middle panel. (b–d) from Odin retrievals at latitude=60◦S, longitude=21◦E: for ozone (ppmv) at 68 km (b) and at 50 km (c), for
temperature (K) at 38 km (d), (Note: reverse scale for ozone).
in order to trace the 5-day planetary waves to higher altitude. We need to do this since good-quality temperature retrievals from Odin are not available to such high altitudes as reliable estimates of ozone concentration.
Our aim is to try to follow the wave perturbations from the stratosphere up through the mesosphere to the mesopause, to see if their behaviour is inconsistent with any or all of the three possible sources we consider for 5-day waves at the summer mesopause. The first possible source is verti-cal wave propagation from lower to upper altitudes in the summer hemisphere. The second possibility is the same pro-cess but in the winter hemisphere, with subsequent horizontal travel of the wave at mesospheric heights into the opposite, summer, hemisphere. We use changes in amplitude of the waves detected in the Odin data at different heights and in different hemispheres as a diagnostic of the first two possible sources. The third possible source is baroclinic instability of the easterly jet in the in the summer mesosphere. Since this instability is expected to be most effective in generating 2-day waves (see introduction), we use the amplitude of 2-2-day waves as a diagnostic of the third source.
In Figs. 5–8 the 2-day wind perturbations (upper panel) and 5-day temperature perturbations (middle and lower pan-els), close to the summer mesopause at 68◦–69◦N, are
plot-ted together with the perturbations at lower altitudes (38– 68 km) in both hemispheres at 60◦N (middle panel) and
60◦S (lower panel). The curves (a) in the middle and lower
panels represent 5-day temperature perturbations (obtained from the meteor radar data). Other curves are calculated from the Odin data: lines (b) and (c) show the 5-day ozone per-turbations at 64–68 km and 48–50 km, respectively; line (d) shows the 5-day temperature perturbation at 38–46 km. Note that a reverse scale is applied for ozone, on plots (b) and (c), because we use ozone as a proxy for temperature in the upper stratosphere and higher up, where an anticorrelation should be observed between temperature and ozone. The perturbation amplitudes and phases have been discussed ear-lier in Sect. 3.1.2, so now we pay the most attention to the wave envelope, i.e. to the amplitude changes over time at the different heights. Each year is discussed separately in the following paragraphs.
Figure 5 shows the 5-day perturbations for the summer of 2003. One can see a similar wave envelop for days 197–210 in both hemispheres at 38–68 km (middle and lower pan-els). At the summer polar mesopause (a), the amplitude is highest between days 200–213 and at the beginning of this interval (days 200–207) the perturbation amplitude is also high at lower altitudes (38–68 km) in the same hemisphere at 60◦N and in the opposite hemisphere at 60◦S. As the
Fig. 6. Wave perturbations for 14 June–11 August 2004: Upper panel: 2-day wave from ground-based radar measurements of meridional wind (m/s) over Esrange (67◦56′N, 21◦04′E), at 90 km. Middle panel: 5-day perturbations: (a) from ground-based radar measurements of
temperature over Andenes (69◦17′N, 16◦00′E), at 90 km. (b–d) from Odin retrievals at latitude=60◦N, longitude=21◦E: for ozone (ppmv)
at 64 km (b) and at 48 km (c), for temperature (K) at 40 km (d), (Note: reverse scale for ozone). Lower panel: 5-day perturbations: (a) same as on the middle panel. (b–d) same as on the middle panel but for latitude=60◦S. (Note: reverse scale for ozone).
the perturbation amplitude around the summer mesopause re-mains large. This could in principle be a result of a change in wave amplification as it propagates upward, due to changes in background winds. However, considering the amplitude in the 2-day wave (upper panel), we see that it has maxima around days 206 and 212. These occur in about the same in-terval as the maximum amplitude of the 5-day wave at 85 km, so it is possible that they are both influenced simultaneously by the baroclinic instability.
A similar comparison of the wave pattern in both hemi-spheres for the summer of 2004 is shown in Fig. 6. Curve (a) demonstrates that the 5-day perturbation amplitude at the summer polar mesopause is rather high for days 175–205. In the NH (middle panel) the perturbation amplitude at 40– 48 km (d, c) is high during days 170–185 but it is attenu-ated at 64 km (b). Note that this interval covers midsummer (day 175), when the stratospheric easterlies are strongest, and direct upward propagation through those easterlies should be most difficult. Starting at day 195 the perturbation ampli-tude at 64 km in the NH grows and could be the source of the increase in wave amplitude seen at 90 km, lasting until day 208 (middle panel, curve (a)). In the opposite, winter, hemisphere at 60◦S (lower panel), the perturbation
ampli-tude is high for days 175–188 and increases between 48 and 64 km. So the wave seems to propagate upwards in the SH and could in principle propagate to the summer hemisphere at mesospheric heights. However, the 2-day wave (upper
panel) shows 2 bursts of higher amplitude which correlate well with the 5-day wave at 90 km, days 175–190 and 194– 200, so the baroclinic instability seems a good candidate for both waves in this case (which is very close to solstice).
Figure 7 shows the 5-day perturbations for the summer of 2005. The highest amplitudes around the summer mesopause (curve a) at 85 km are seen for days 225–240. At the same time, the waves in the NH (middle panel) at lower levels do not show any increase in amplitude before day 240. How-ever wave amplitude at 64 km is as high as that at 50 km so it is possible that the wave propagates vertically in the polar summer hemisphere between 64 and 85 km, and that the in-creased amplitude at 85 km is due to changes in background wind. There is no information about planetary waves in the SH (lower panel) above 42 km for these days but there is a noticeable amplitude increase at 60◦S at 42 km at about the
Fig. 7.Wave perturbations for 27 July–17 September 2005: Upper panel: 2-day wave from ground-based radar measurements of meridional wind (m/s) over Esrange (67◦56′N, 21◦04′E), at 90 km. Middle panel: 5-day perturbations: (a) from ground-based radar measurements of
temperature over Esrange (67◦56′N, 21◦04′E), at 85 km. (b–d) from Odin retrievals at latitude=60◦N, longitude=21◦E: for ozone (ppmv)
at 64 km (b) and at 50 km (c), for temperature (K) at 42 km (d), (Note: reverse scale for ozone). Lower panel: (a) same as on the middle panel. (b–d) from Odin retrievals at latitude=60◦S, longitude=21◦E: for ozone (ppmv) at 68 km (b) and at 50 km (c), for temperature (K) at
42 km (d), (Note: reverse scale for ozone).
time interval indicating no direct connection with perturba-tions from lower heights.
Figure 8 shows the 5-day perturbations for the period 22 May–17 June 2007. Around the summer mesopause, curve (a), the highest amplitudes are observed for days 150– 162.
At the lower heights at 60◦N (middle panel) the
pertur-bations show close phase consistency and increasing ampli-tude with height, consistent with vertical propagation dur-ing days 150–155 between 46 and 85 km. In the SH (lower panel) the perturbations are extremely small at 48 compared to 64 km, so the data is hard to interpret. The 2-day wave (upper panel) shows a clear amplitude maximum at the same time as the maximum in the 5-day wave, so that baroclinic instability seems also to be a possible source in this case.
In summary, 5-day wave energy at mesopause heights is generally seen in short “packets” of a few cycles of higher amplitude. Amplitude changes are sometimes correlated at all heights between 40 and 85 km but more often it is hard to see clear correlation over all heights. When we test whether Northern-Hemisphere or Southern-Hemisphere planetary waves at lower altitudes are a possible source of the fluctuations at the summer mesopause we find that both are possible in all except one case (close to solstice when we find evidence against a NH source). Correlation between bursts in 5-day and in 2-day waves at mesopause heights is rather good in two cases, supporting the possibility that both
are caused by baroclinic instability. However in one case of a 5-day wave, 50–65 days after solstice, the baroclinic insta-bility seems an unlikely source.
4 Conclusions
In this paper we have used global observations from the Odin satellite data and ground-based meteor-radar observa-tions from Scandinavia and Canada to investigate the propa-gation of 5-day waves from the stratosphere to the mesopause in the Northern Hemisphere summers of 2003, 2004, 2005 and 2007.
The satellite data show 5-day planetary waves in temper-ature up to 54 km height. These waves have the expected higher amplitudes in the winter hemisphere and (usually) inter-hemispheric symmetry in phase. Wave amplitudes are about 2 K (maximum∼4 K) in the winter stratosphere and
about 0.5 K (maximum∼1 K) in the summer stratosphere.
The Odin data show 5-day waves in ozone concentration at 24–68 km height. In general the wave amplitude in ozone is about 0.0025–0.05 ppmv in the summer hemisphere and about 0.05–0.1 ppmv in winter. There is one case when al-most equal amplitudes in the ozone wave (∼0.1 ppmv) were
Fig. 8. Wave perturbations for 22 May–17 June 2007: Upper panel: 2-day wave from ground-based radar measurements of meridional wind (m/s) over Esrange (67◦56′N, 21◦04′E), at 90 km. Middle panel: 5-day perturbations:: a) from ground-based radar measurements of
temperature over Esrange (67◦56′N, 21◦04′E), at 85 km. (b–d) from Odin retrievals at latitude=60◦N, longitude=21◦E: for ozone (ppmv)
at 64 km (b) and at 48 km (c), for temperature (K) at 46 km (d), (Note: reverse scale for ozone). Lower panel: (a) same as on the middle panel. (b–d) same as on the middle panel but for latitude=60◦S. (Note: reverse scale for ozone).
Study of the phase change in the ozone perturbations with height in the summer hemisphere at 60◦N shows phase shifts
up to 180◦between 48–50 and 64 km, which can in principle
be explained by different background wind conditions. The 5-day temperature perturbations at the summer mesopause, derived from the meteor-radar observations at 85–90 km height show high amplitudes (up to 15 K) and 1–2.5 day phase shifts between Scandinavia and Canada, consistent with the expected westward propagation of 5-day planetary waves.
Wave amplitudes are highly variable in time, with “pack-ets” of high amplitude lasting only few cycles. Comparison between wave envelopes in both winter and summer strato-sphere/lower mesosphere and at the summer mesopause shows no evidence that wave propagation to the summer mesopause is inhibited in the summer hemisphere, except in one case, close to equinox. For some periods, simultane-ous amplitude changes are seen at all heights in both hemi-spheres, so that the possibility that waves reach the summer mesopause by upward propagation through the winter strato-sphere and mesostrato-sphere cannot be ruled out. For other peri-ods, no good correlation is seen between amplitude changes at the mesopause and at lower heights, suggesting sensitiv-ity to other factors. One such factor could be background atmospheric winds (as in the numerical simulation results of Geisler and Dickinson, 1976). Another possible influence is in-situ generation or amplification of the 5-day wave in
the summer mesosphere as result of the baroclinic instability (Plumb, 1983; Garcia et al., 2005; Riggin et al., 2006). How-ever this is unlikely to be effective late in the summer when high-amplitude 5-day waves can still be seen.
Acknowledgements. We thank the anonymous reviewers for their constructive comments on the original manuscript. This work was financed by the Swedish National Space Board.
Topical Editor U.-P. Hoppe thanks two anonymous referees for their help in evaluating this paper.
References
Andrews, D. G., Holton, J. R., and Leovy, C. B.: Middle Atmo-sphere Dynamics, Academic Press, London, 169–171, 1987. Brasseur, G. and Solomon, S.: Aeronomy of the middle atmosphere,
D. Reidel, Norwell, 204–211, 1986.
Calisesi, Y., K¨ampfer, N., Ruffieux, D., and Viatte, P.: Upper strato-spheric ozone anomalies at the winter midlatitudes, Proceedings of the XX Quadrennial Ozone Symposium, edited by: Zerefos, Ch., vol. I, 308–311, 2004.
Garcia, R. R., Lieberman, R., Russell III, J. M., and Mlynczak, M. G.: Large-scale waves in the mesosphere and lower ther-mosphere observed by SABER, J. Atmos. Sci., 62, 4384–4399, 2005.
Geisler, J. E. and Dickinson, R. E.: The five-day wave on a sphere with realistic zonal winds, J. Atmos. Sci., 33, 632–641, 1976. Frisk, U., Hagstr¨om, M., Ala-Laurinaho, J., Andersson, S., Berges,
Florin, G., Fredrixon, M., Gaier, T., Haas, R., Hirvonen, T., Hjal-marsson, ˚A., Jakobsson, B., Jukkala, P., Kildal, P., Kollberg, E., Lassing, J., Lecacheux, A., Lehikoinen, P., Lehto, A., Mallat, J., Marty, C., Michet, D., Narbonne, J., Nexon, M., Olberg, M., Olofsson, O., Olofsson, G., Orign´e, A., Petersson, M., Piironen, P., Pons, R., Pouliquen, D., Ristocelli, I., Rosolen, C., Rouaix, G., R¨ais¨anen, A., Serra, G., Sj¨oberg, F., Stenmark, L., Torchin-sky, S., Tuovinen, J., Ullberg, C., Vinterhav, E., Wadefalk, N., Zi-rath, H., Zimmermann, P., and Zimmermann, R.: The Odin satel-lite: I. Radiometer design and test, Astron. Astrophys., 402(3), L27–34, 2003.
Hirooka, T.: Normal mode Rossby waves as revealed by UARS/ISAMS Observations, J. Atmos. Sci., 57, 1277–1285, 2000.
Hirota, I. and Hirooka, T.: Normal mode Rossby wave observed in the upper stratosphere. Part I: first symmetric modes of zonal wavenumbers 1 and 2, J. Atmos. Sci., 41, 1253–1267, 1984. Hirota, I. and Hirooka, T.: Normal mode Rossby wave observed in
the upper stratosphere. Part II: second asymmetric and symmetric modes of zonal wavenumbers 1 and 2, J. Atmos. Sci., 42, 536– 548, 1985.
Hocking, W. K., Singer, W., Bremer, J., Mitchell, N. J., Batista, P., Clemesha, B., and Donner, M.: Meteor Radar Temperatures at multiple sites derived with SKiYMET radars and compared to OH, rocket and lidar measurements, J. Atmos. Solar-Terr. Phys., 66, 585–593, 2004.
Holton, J. R.: The role of gravity wave induced drag and diffusion in the momentum budget of the mesosphere, J. Atmos. Sci., 39, 791–799, 1982.
Kirkwood, S. and Rechou, A.: Planetary-wave modulation of PMSE, Geophys. Res. Lett., 25, 4509–4512, 1998.
Kirkwood, S., Barabash, V., Br¨andstr¨om, U., Mostr¨om, A., Stebel, K., Mitchell, N., and Hocking, W.: Noctilucent clouds, PMSE and 5-day planetary waves: a case study, Geophys. Res. Lett., 29, 1411–1414, 2002.
Kirkwood, S. and Stebel, K.: Influence of planetary waves on noc-tilucent cloud occurrence over NW Europe, J. Geophys. Res., 108(D8), 8440–8455, 2003.
Kopp, G., Belova, A., Diez y Riega, V. E., Groß, J., Hochschild, G., Hoffmann, P., Murtagh, D., Raffalski, U., and Urban J.: In-tercomparison of Odin–SMR ozone profiles with ground-based millimetre-wave observations in the Arctic, the mid-latitudes, and the tropics, Can. J. Phys. 85, 1097–1110, 2007.
Lawrence, A. R. and Jarvis, M. J.: Simultaneous observations of planetary waves from 30 to 220 km, J. Atmos. Solar-Terr. Phys., 65, 765–777, 2003.
Matsuno, T.: A quasi-one-dimensional model of the middle atmo-sphere circulation interacting with internal gravity waves, J. Me-teorol. Soc. Japan, 60, 215–226, 1982.
Merkel, A. W., Thomas, G. E., Palo, S. E., and Bailey, S. M.: Obser-vations of the 5-day planetary wave in PMC measurements from the Student Nitric Oxide Explore Satellite, Geophys. Res. Lett., 30(4), 1196, doi:10.1029/2002GL016524, 2003.
Merkel, A. W., Garcia, R. R., Bailey, S. M., and Russell III, J. M.: Observational studies of planetary waves in PMCs and meso-spheric temperature measured by SNOE and SABER, J. Geo-phys. Res., 113, D14202, doi:10.1029/2007JD009396, 2008. Miyoshi, Y.: Numerical simulation of 5-day and 16-day waves in
the mesopause region, Earth Planets Space, 51, 763–772, 1999.
Murtagh, D., Frisk, U., Merino, F., Ridal, M., Jonsson, A., Stegman, J., Witt, G., Eriksson, P., Jimenez, C., M´egie, G., de La No¨e¨e, J., Ricaud, P., Baron, P., Pardo, J.-R., Hauchecorne, A., Llewellyn, E. J., Degenstein, D. A., Gattinger, R. L., Lloyd, N. D., Evans, W. F. J., McDade, I. C., Haley, C. Sioris, C., von Savigny, C., Solheim, B. H., McConnell, J. C., Strong, K., Richardson, E. H., Leppelmeier, G. W., Kyr¨ol¨a, E., Auvinen, H., and Oikarinen, L.: An overview of the Odin atmospheric mission, Can. J. Phys., 80, 309–319, 2002.
Olberg, M., Frisk, U., Lecacheux, A., Olofsson, O., Baron, P. Bergmann, P., Florin, G., Hjalmarsson, ˚A., Larsson, B., Murtagh, D., Olofsson, G., Pagani, L., Sandquist, A., Teyssier, D., Torchin-sky, S., and Volk, K.: The Odin satellite: II. Radiometer data processing and calibration, Astron. Astrophys., 402(3), L35–38, 2003.
Pancheva, D., Mitchell, N. J., Manson, A. H., Meek, C. E., Jacobi, Ch., Portnyagin, Yu., Merzlyakov, E., Hocking, W. K., Mac-Dougall, J., Singer, W., Igarashi, K., Clark, R. R., Riggin, D. M., Franke, S. J., K¨urschner, D., Fahrutdinova, A. N., Stepanov, A. M., Kashcheyev, B. L., Oleynikov A. N., and Muller, H. G.: Variability of the quasi-2-day wave observed in the MLT region during the PSMOS campaign of June–August 1999, J. Atmos. Solar Terr. Phys., 66, 539–565, 2004.
Pendlebury, D., Shepherd, T. G., Pritchard, M., and McLandress, C.: Normal mode Rossby waves and their effects on chemi-cal composition in the late summer stratosphere, Atmos. Chem. Phys., 8, 1925–1935, 2008,
http://www.atmos-chem-phys.net/8/1925/2008/.
Plumb, R. A.: Baroclinic instability of the summer mesosphere: a mechanism for the quasi-two-day wave?, J. Atmos. Sci., 40, 262–270, 1983.
Prata, A. J.: Observations of the 5-Day Wave in the Stratosphere and Mesosphere, J. Atmos. Sci., 46, 2473–2477, 1989.
Prata, A. J.: Travelling waves in Nimbus-7 SBUV ozone measure-ments: Observations and theory, Q. J. Roy. Meteorol. Soc., 116, 1091–1122, 1990.
Riggin, D. M., Liu, H.-L., Lieberman, R. S., Roble, R. G., Russell III, J. M., Mertens, C. J., Mlynczak, M. G., Pancheva, D., Franke, S. J., Murayama, Y., Manson, A. H., Meek, C. E., and Vincent, R. A.: Observations of the 5-day wave in the mesosphere and lower thermosphere, J. Atmos. Solar-Terr. Phys., 68, 323–339, 2006.
Rosenlof, K. H. and Thomas, R. J.: Five-day mesospheric waves observed in solar mesosphere explorer ozone, J. Geophys. Res., 95, 895–899, 1990.
Salby, M. L.: Rossby normal modes in nonuniform background configurations. Part I: Simple fields, J. Atmos. Sci., 38, 1803– 1826, 1981a.
Salby, M.L.: Rossby normal modes in nonuniform background con-figurations. Part II: equinox and solstice conditions, J. Atmos. Sci., 38, 1827–1840, 1981b.
von Savigny, C., Robert, C., Bovensmann, H., Burrows, J. P., and Schwartz, M.: Satellite observations of the quasi 5-day wave in noctilucent clouds and mesopause temperature, Geophys. Res. Lett., 34, L24808, doi:10.1029/2007GL030987, 2007.
J.-L. F., Mlybcak, M. G., Pawson III, S., Russell, J. M. R., San-tee, M. L., Snyder, W. V., Stek, P. C., Thurstans, R. P., Tompkins, A. M., Wagner, P. A., Walker, K. A., Waters, J. W., and Wu, D. L.: Validation of the Aura Microwave Limb Sounder temper-ature and geopotential height measurements, J. Geophys. Res., 113, D15S11, doi:10.1029/2007JD008783, 2008.
Smith, A. K.: Numerical simulation of global variations of temper-ature, ozone, and trace species in the stratosphere, J. Geophys. Res., 100(D1), 1253–1270, 1995.
Urban, J., Lauti´e, N., Le Flochmo¨en, E., Jim´enez, C., Eriksson, P., de La No¨e, J., Dupuy, E., Ekstr¨om, M., El Amraoui, L., Frisk, U., Murtagh, D., Olberg, M., and Ricaud, P.: Odin/SMR limb observations of stratospheric trace gases: Level 2 processing of ClO, N2O, HNO3, and O3, J. Geophys. Res., 110, D14307, doi:10.1029/2004JD005741, 2005.