Advanced Pharmaceutical Bulletin, 2013, 3(2), 395-402 doi: http://dx.doi.org/10.5681/apb.2013.063
http://apb.tbzmed.ac.ir/
*Corresponding author: Mohammad Saeid Hejazi, Department of Pharmaceutical Biotechnology, Faculty of Pharmacy, Tabriz University of Medical Sciences, Tabriz, Iran. Tel: +98 (411) 3372256, Fax: +98 (411) 3344798, Email: saeidhejazi@tbzmed.ac.ir, msaeidhejazi@yahoo.com
Influence of Foreign DNA Introduction and Periplasmic Expression of
Recombinant Human Interleukin-2 on Hydrogen Peroxide Quantity
and Catalase Activity in Escherichia coli
Lena Mahmoudi Azar1, Elnaz Mehdizadeh Aghdam1, Farrokh Karimi1,2, Babak Haghshenas1,3, Abolfazl Barzegari4, Parichehr Yaghmaei5, Mohammad Saeid Hejazi1,6*
1
Department of Pharmaceutical Biotechnology, Faculty of Pharmacy, Tabriz University of Medical Sciences, Tabriz, Iran.
2
Department of Biotechnology, Faculty of Science, Maragheh University, Maragheh, Iran.
3
Institute of Bioscience, University of Putra Malaysia, Kualalumpur, Malaysia.
4
Research Center of Pharmaceutical Nanotechnology, Tabriz University of Medical Sciences, Tabriz, Iran.
5
Islamic Azad University, Science and Research Branch of Tehran, Iran.
6
Faculty of Advanced Biomedical Sciences, Tabriz University of Medical Sciences, Tabriz, Iran.
Introduction
Prokaryotic expression systems such as Escherichia coli have been greatly utilized for production of recombinant proteins; however, they have not been constructed as a foreign protein producer, naturally.1-3 The physiology of the host cell impeded by plasmid presence and the expression of recombinant genes and consequently cellular stress reactions are imposed.4,5 Metabolic load is considered as the main reason for cell growth depletion in recombinant cells.2 The presence of plasmid and its replication as well as overexpression of recombinant genes are causative factors to metabolic
load.6,7 In these conditions, cell growth can be restricted due to the low accessibility of energy and nutrient resources, a condition identified as starvation. Accordingly, expression of many genes for amino acid biosynthesis is repressed. This starvation-like effect seems to be the chief cause for the decreased expression of the foreign gene products in high cell-density cultures.8
There are several approaches to improve recombinant protein production, such as selecting high level expression systems, optimizing expression conditions
A R T I C L E I N F O A B S T R A C T
Article Type: Research Article
Article History: Received: 29 March 2013 Revised: 18 April 2013 Accepted: 22 April 2013 ePublished: 20 August 2013
Keywords: Hydrogen peroxide Catalase activity Periplasmic expression Escherichia coli Recombinant protein
Mahmoudi Azar et al.
for improving protein solubility9 and optimization of media formulation.10,11 Additionally, in order to control protein production induced stresses, some gene manipulations such as metabolic genes12-15 and stress responsive genes16-18 have been applied in several cases. In the other side, determination of unknown inhibiting factors during foreign protein production and resolving their inhibitory effects could improve the yield of the production theoretically.
Reactive oxygen species (ROS) such as superoxide (O2-•) and hydrogen peroxide (H2O2) are produced as normal by-products of aerobic life. Imbalance between generation and elimination of ROS promotes oxidative stress which causes lethal cell damages.19-23 Oxidation of various cell constituents as DNA,24 lipids and proteins,25 induces fundamental changes responsible for death.26,27 It is established that specific oxidation of thiol groups of proteins involved in detoxification of H2O2 and biosynthesis pathway such as cobalamin-independent methionine synthase (MetE) is caused by H2O2-induced oxidative stress. MetE is inactivated by H2O2 in E. coli which is associated with methionine limitation imposed by oxidative stress.28,29
The respiratory chain can be the source of as much as 87% of the total H2O2 production in E. coli.30 Most of the H2O2 in exponentially growing E. coli cultures is generated from superoxide ion (2O2– + 2e–+ 4H+ → H2O2 + O2) and the generation of superoxide anion and hydrogen peroxide depends on the stage of culture development.30 In E. coli, H2O2 is removed by two kinds of catalases producing H2O and O2. These enzymes include hydroperoxidase I (HPI), existing during aerobic growth and transcriptionally controlled at various levels,31 and hydroperoxidase II (HPII),32,33 which is induced during stationary phase.
Having synthesized in the cytoplasm, some of recombinant proteins are sent into the extracytoplasmic spaces chiefly the periplasm.34,35 Besides, in order to increase cell productivity and product quality, it is a common strategy to export recombinant products to the periplasm. As its oxidative environment leads to appropriate disulfide bond formation and consequent correct folding,36 less degradation due to presence of fewer proteases37 and the easy extraction of final proteins.38 The presence of superoxide dismutases containing copper plus zinc ions (Cu, Zn-SOD)39,40 and KatG (HPI) enzymes metabolizing superoxide anion and hydrogen peroxide in the periplasmic space of E. coli, respectively, protects the environment from oxidative damage.20
Reportedly, one of the impacts of starvation on E. coli
cells is the increasing of some defense proteins responding to oxidative stress. These proteins prevent accumulation of oxidative damage in growth arrested cells.41 In addition, although, an aerobic environment seems to be preferable for E. coli cultivation, oxygen can easily become limited in aerobic fast-growing cultures which influence cell physiology through the accumulation of acetate.42 In the other side, the
presence of oxygen can oxidize electron carriers to generate hydrogen peroxide or superoxide anion, resulting in oxidative stress.43 In spite of these known associations, relation of metabolic burden and oxidative stress in foreign protein producing cells has not been investigated inclusively. Recently, we studied H2O2 concentration and catalase activity following introduction of foreign DNA and recombinant protein expression. Our results showed a significant elevation in hydrogen peroxide concentration as the most stable component of ROS and reduction of catalase activity as an important H2O2 decomposer.44,45 This could be considered as a limiting factor in production of recombinant protein. Following our previous reports and considering the benefits of periplasmic expression of foreign proteins and consequently the high interest in production of recombinant proteins in periplasmic space, we aimed to investigate H2O2 concentration and catalase activity following periplasmic expression of recombinant human IL-2 as a non-enzymatic and nontoxic as well as non-functional protein for E. coli in the recombinant cells. Moreover, correlation between H2O2 concentration and catalase activity following recombinant protein expression with cell growth was studied. The special emphasis is given to the comparison of the alteration in H2O2 concentration and catalase activity among recombinant protein expressing, foreign DNA introduced and wild type cells.
Materials and Methods
Bacterial strains and culture media
E. coliDH5α and BL21(DE3) strains were used as host
cells for plasmid amplification and recombinant protein expression, respectively. pET-22b(+) expression vector was used for cloning of hIL-2 coding DNA. Bacteria were grown in LB (Bacto-tryptone 10 g/l, yeast extract 5 g/l, and NaCl 10 g/l) or LB agar media supplemented with ampicillin (100 µg/ml) in shaker incubator overnight at 37 °C.
PCR amplification of hIL-2 DNA and construction of pET2hIL2 plasmid
Plasmid r-PWhIL-2B7.MA (a kind gift from Dr. Joop Gäken King’s College London, London) was used as the template DNA for mature IL-2 encoding DNA amplification using polymerase chain reaction (PCR) technique. Therefore, a pair of specific forward [5´-CGC GGA TCC TGC ACC TAC TTC AAG T-3´] and reverse [5´-ACT AAG CTT TTA AGT CAG TGT TGA G-3´] primers creating BamHI and HindIII restriction sites at 5 and 3 ends of the amplified DNA fragment, respectively, were designed based on human interleukin-2 gene sequence. The primers were supplied from Eurofins MWG Operon Company. The PCR reaction was performed to amplify DNA fragments.
ROS in periplasmic IL-2 expressing E. coli
and cloned into pTZ57R/T cloning vector. E. coli
DH5α cells were transformed with the cloning solution and were cultured on LB medium containing ampicillin, IPTG and X-gal. Treatment of the clones with BamHI and HindIII enzymes resulted in the release of hIL-2 coding DNA with sticky ends. The released fragment was extracted from the gel and ligated in pET-22b(+) expression vector resulting in construction of pET2hIL2 vector (Figure 1)
Figure 1. Agarose gel electrophoresis of pET-22b(+) and pET2hIL2 plasmids after digestion with BamHI and HindIII restriction enzymes. a) 1kb DNA ladder, b) digested pET2hIL2 containing of hIL-2 and c) digested empty vector pET-22b(+).
Evaluation of hIL-2 expression
Having treated with IPTG (0.5 mM), cultures were incubated and then cells harvested by centrifugation at 4000 rpm. Pellets resuspended in 50 µl of loading buffer (2X SDS gel-loading buffer) and 50 µl of 10 mM phosphate buffer (pH 7.0) containing lysozyme. In order to extract periplasmic proteins, the solution was sonicated for 10 minutes and total proteins were isolated after the pellet resuspention in 50 µl of loading buffer and 50 µl of H2O and boiled for 15 minutes. Then, SDS-PAGE electrophoresis gel (12% separating gel and 5% stacking gel) was used for evaluation of recombinant hIL-2 expression.
Growth curve
In order to draw the growth curve of the cells, optical density (OD) of the cultures was measured spectrophotometrically at 600 nm every half hour. Having adjusted the OD of overnight grown cultures at 1, the samples were diluted 1/100 (v/v) and incubated. As a means to investigate the consequence of recombinant protein expression on the growth rate, the media were treated with IPTG with final concentration of 0.5 mM at OD 0.5. As all following studies, wild type untransformed and pET-22b(+) transformed cells were used as negative controls.
Measurement of H2O2 concentration
Sample preparation
1.5 ml of bacterial culture was collected at ODs 0.6, 0.7, 0.8 and 1.2 by centrifugation at 13000 rpm for 10 min. The pellet was homogenized in 1.5 ml of 0.1%
(w/v) trichloroacetic acid by sonication at 22 KHz for 10 min in an ice bath. After centrifugation again at 14000 rpm for 10 min, the final supernatant was used for H2O2 assay.
H2O2 measurement
The protocol described by Velikova and colleagues46 was used for H2O2 assay.0.5 ml of the supernatant was added to the mixture of 0.5 ml of 10 mM phosphate buffer (pH 7.0) and 1 ml of 1M potassium iodide and kept in dark place for 10 min. Then, the absorbance of solution was read at 390 nm and H2O2 concentration was calculated using the standard curve. The blank sample was made of 1 ml of 10 mM phosphate buffer (pH 7.0) and 1 ml of 1M potassium iodide.
Catalase activity assay
Sample preparation for catalase activity and protein estimation
In order to measure catalase activity, suspended cells in 1 ml of buffer (50 mM phosphate buffer (pH 7.0) and 0.5 mM EDTA) were lysed in sonicator at 22 kHz in an ice bath for 10 min. After removing the pellet by centrifuging at 14000 rpm for 10 min at 4 °C, the supernatant was used to determine catalase activity.
Measurement of catalase activity
Catalase activity measurement was based on H2O2 decomposition assay spectrophotometrically. H2O2 decomposition was measured according to the absorbance difference between 0 and 5 min at 240 nm in 2 ml reaction mixture and quantified based on standard curve. The reaction mixture contained 200 µl cell extract, 50 mM phosphate potassium buffer (pH 7.0), 0.5 mM EDTA and 10 mM hydrogen peroxide 30%. One catalase activity unit is the amount of enzyme decomposing 1.0 µmole of hydrogen peroxide per minute at pH 7.0 and 25 °C.
Total protein measurement
Total protein concentration was determined according to Bradford method47 using bovine serum albumin as the standard. 200 µl of cell extract was added to the solution containing 1400 µl of 50 mM K-phosphate buffer, 0.5 mM EDTA and 400 µl of Bradford reagent and the absorbence of reaction was measured at 595 nm between 5 to 30 min.
Statistical analyses
All data were represented as means ± S.E.M of three or four replicates. Statistical analyses were performed using one-way analysis of variance (ANOVA). Statistical assessment of difference between mean values was performed by least significance difference (LSD) test at p<0.05 using SPSS (16 version) software.
Results
Evaluation of recombinant hIL-2 expression
Mahmoudi Azar et al.
Bacterial cellswere induced with 0.5 mM IPTG at OD 0.5 after and incubation for 2.5 hours in shaker at 37°C. Following the total and periplasmic protein extraction and SDS- PAGE analysis, the existence of a protein band with molecular weight of about 14.5 KDa is corresponding to hIL-2 expression in the cells (Figure 2). Expression of hIL-2 protein was not observed in empty vector transformed and non-induced cells used as negative controls.
Figure 2. SDS-PAGE analysis of total and periplasmic expression of human interleukin-2. Total protein extracted from non induced pET2hIL2 transformed cells (lane a) and empty pET-22b(+) vector transformed (lane b) as negative controls. Total protein extracted from pET2hIL2 transformed cells after inducing with IPTG 0.5 mM (lane c and lane e), and periplasmic protein extraction pET2hIL2 transformed cells after inducing with IPTG 0.5 mM (lane d and lane f). Lane g is protein ladder.
Growth curve
As shown Figure 3, among three types of bacteria, wild type cells displayed faster growth than recombinant cells. It passes the lag phase and enters exponential phase faster than recombinant bacteria. pET2hIL2 as expressing cells show lower growth than others. It grew slower and passes lag phase and exponential phase later than others and also enters stationary phase earlier than pET-22b(+) and wild type cells. pET-22b(+) as empty vector transformed cells, displayed growth between wild type and expressing cells. It enters exponential phase before hIL-2 expressing cells and after wild type cells. The entrance of empty vector transformed cells into stationary phase was observed after recombinant pET2hIL2 transformed cells, but before wild type.
Measurement of H2O2 concentration
H2O2 concentration variations are represented in Figure 4. Comparison of bacterial cells H2O2 content indicates a significant increase at the amount of H2O2 between wild type and hIL-2 expressing cells at each OD. According to Figure 4 increase of H2O2 content was observed from OD: 0.6 to OD: 0.7 at all cell types. A noticeable difference between OD: 0.7 and OD: 0.8 was not existed in H2O2 quantities, but decrease of H2O2 was distinguished at OD: 1.2 in all bacteria. Peak of H2O2 amount was 19.43 ± 1 µM at OD: 0.7 related to hIL-2 expressing cells. At the same optical density, pET-22b(+) empty vector transformed cells and wild type cells showed 11.80 ± 0.65 µM and 9.09 ± 1.11 µM
H2O2 content respectively. Lowest amount of H2O2 was measured as 2.56 ± 0.87 µM and 2.26 ± 0.92 µM at OD: 0.6 and 1.2 in wild type cells. At ODs 0.6, 0.8 and 1.2, the highest amount of H2O2 was also measured in recombinant hIL-2 expressing cells as 13.61 ± 0.69 µM, 13.76 ± 1.13 µM and 7.13 ± 0.28 µM respectively. The amounts of H2O2 were 8.94 ± 1.13 µM, 11.80 ± 0.65 µM, 8.34 ± 0.66 µM and 3.64 ± 1.02 µM from OD 0.6 to 1.2 in pET-22b(+) empty vector transformed cells, approximately, the quantities between wild type and expressing cells. Finally, comparison of H2O2 concentration among different types of bacterial cells at the all ODs showed a significant increase on H2O2 amount from wild type to pET2hIL2 expressing cells.
Figure 3. Growth curve of wild type and recombinant E .coli cells (pET-22b(+), pET2hIL2) for 8 hours. Optical density was measured every 30 minutes and induction of the cells was done with IPTG (0.5 mM) at OD: 0.5 by 0.5 mM IPTG.
Figure 4. H2O2 concentration of wild type (BL21(DE3)) and
recombinant E. coli cells (pET-22b(+), pET2hIL2) at OD 0.6, 0.7 0.8 and 1.2. Significant increase in H2O2 concentration is
ROS in periplasmic IL-2 expressing E. coli
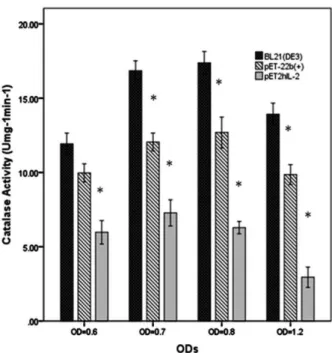
Catalase activity assay
Catalase is an endogenous antioxidant enzyme present in all aerobic cells and removes toxic H2O2 molecule from the cell by converting it into H2O molecule. One catalase unit is the amount of enzyme decomposing 1.0 µmole of hydrogen peroxide per minute at pH 7.0 and 25 °C. As shown in Figure 5, catalase activity was decreased significantly from 11.92 ± 0.72 Umg-1min-1 in wild type cells to 9.97 ± 0.61 Umg-1min-1 and 5.97 ± 0.78 Umg-1min-1 respectively in empty vector transformed cells and expressing cells at OD: 0.6. Wild type cells had maximum catalase activity compared to recombinant bacteria as 16.86 ± 0.66 Umg-1min-1 and 17.38 ± 0.76 Umg-1min-1 especially at OD: 0.7 and 0.8. Empty vector transformed cells displayed high catalase activity than pET2hIL2 producing cells and low catalase activity than BL21 (DE3) wild type cells at ODs 0.6, 0.7, 0.8 and 1.2 as 9.97 ± 0.61 Umg-1min-1, 12.05 ± 0.59 Umg-1min-1, 12.68 ± 1.04and 9.85 ± 0.67 Umg-1min-1.The measured catalase activity at all ODs (0.6, 0.7, 0.8 and 1.2) was demonstrated the noticeable decrease from wild type to pET-22b(+) empty vector transformed cells and pET2hIL2 expressing cells. Finally, catalase activity among different types of bacteria at all ODs showed a significant decrease on the level of catalase activity from wild type to pET2hIL2 expressing cells and also, high level of catalase activity was shown at OD: 0.7 and 0.8 related to wild type cells.
Figure 5. Catalase activity of wild type and recombinant E. coli cells (pET-22b(+), pET2hIL2) at OD 0.6, 0.7, 0.8 and 1.2. Significant decrease in catalase activity is distinguished among wild type cells and recombinant E. coli cells which are shown by "*" (p<0.05). All data were represented as means ± S.E.M of three or four replicates.
Discussion
Reaching high levels of recombinant protein production impairs the metabolism of host cell48 even if the protein itself is non toxic or has no obvious biological activity
on the cell.2,3 These challenges often occur in the place where recombinant proteins locate. All recombinant proteins are first produced and mostly sited in the cytoplasm.2 However, in E. coli, foreign gene products can be placed in various intracellular compartments, such as the cytoplasm, inner membrane, periplasm, and outer member49 or can be secreted extracellularly.50 Aerobic microorganisms are always under the risk of oxidative stress following imbalance between generation and detoxifying of ROS.51 Nevertheless, E. coli and other cells are equipped with several antioxidant enzymes against consequent oxidative damage. For instance, E. coli has two forms of superoxide dismutase (MnSOD and FeSOD)40 and two forms of catalase (HPI and HPII).33 SOD decomposes the superoxide radical into hydrogen peroxide and oxygen, and catalase catalyses hydrogen peroxide into molecular oxygen and water.52
Considering recombinant protein expression as a kind of challenge in the host cells, ROS generation could be one of the causative factors for reduced cell growth and protein production in recombinant cells. This hypothesis was proved in our previous study on cytoplasmic hIL-2 and mouse interleukin-4 (mIL-4) expressing cells. The present study aimed to evaluate ROS generation and cell growth rate following of recombinant protein expression in periplasm, as a location with different aspects of oxidation properties. The best conditions for recombinant protein production such as bacterial hosts, expression systems and products’ purification are so important.53-55
We have already reported H2O2 generation following expression of recombinant proteins in E. coli.44,45 In this study the effect of periplasmic expression of hIL-2 on H2O2 concentration and catalase activity was investigated. To achieve this goal variation in H2O2 concentration and catalase activity were examined in wild type and recombinant cells containing pET-22b(+) and pET2hIL2 vectors. Both transformed cells (pET-22b(+) and pET2hIL2) are ampicillin resistant cells, but pET2hIL2 expressing cells has an extra sequence of hIL-2 gene compared to empty vector pET-22b(+). Assuming that the only difference between pET2hIL2 and pET-22b(+) transformed cells is hIL-2 protein production, the various changes in H2O2 concentration and catalase activity in hIL-2 expressing cells and empty vector transformed cells is attributed to absolute effect of the recombinant protein expression. Recombinant cells and wild type cells were also compared in terms of growth rate.
Mahmoudi Azar et al.
concentration was observed in recombinant cells compared to wild type cells. Between transformed cells, H2O2 concentration was increased significantly in periplasmic hIL-2 expressing cells compared to empty vector harboring cells (Figure 4). These variations derive from the presence of foreign DNA and recombinant protein expression in recombinant bacterial cells. In contrast to the increase of H2O2 concentration, reduction of catalase activity was observed in recombinant cells. Catalase activity was decreased significantly in recombinant cells compared to wild type cells. Maximum catalase activity was observed in wild type cells. Recombinant periplasmic hIL-2 expressing cells had the lowest catalase activity and empty vector pET-22b(+) harboring cells showed quantities between expressing cells and wild type cells, like other comparative instances (Figure 5). The results obtained from the present study show that entrance of foreign DNA in host cells reduces growth rate of recombinant bacteria which is in accordance with H2O2 accumulation and catalase activity decline. Variation of H2O2 concentration and catalase activity is intensive in periplasmic hIL-2 expressing cells than empty vector containing cells. These results revealed a correlation between expression of recombinant hIL-2 protein and changes in H2O2 amount and catalase activity. Our findings suggest complementary studies to elucidate the effect of ROS elimination on the improvement of growth rate and recombinant protein production in recombinant cells.
Conclusion
It is concluded that periplasmic hIL-2 expression affects the host cell’s hydrogen peroxide concentration possibly due to reduced catalase activity. These effects results in suppression of the growth rate of the recombinant cells meaning that in addition to metabolic load, “H2O2 upshift stress resulted from hIL-2 expression” could be considered as a reason for cell growth repression. Additionally, comparison of recombinant hIL-2 expression and introduction of DNA (empty plasmid) into the cells showed that influence of recombinant hIL-2 expression on the H2O2 concentration elevation and catalase activity reduction is more than the effects of empty vector introduction.
Conflict of Interest
The authors report no conflicts of interest.
References
1. Bentley WE, Mirjalili N, Andersen DC, Davis RH, Kompala DS. Plasmid-encoded protein: the principal factor in the "metabolic burden" associated with recombinant bacteria. Biotechnol
Bioeng 1990;35(7):668-81.
2. Glick BR. Metabolic load and heterologous gene expression. Biotechnol Adv 1995;13(2):247-61.
3. Hoffmann F, Rinas U. Stress induced by recombinant protein production in Escherichia coli.
Adv Biochem Eng Biotechnol 2004;89:73-92.
4. Ron EZ. Bacterial stress response. In: Rosenberg E, DeLong E, Lory S, Stackebrandt E, Thompson F, editors. The prokaryotes. 4th ed. Berlin: Springer; 2013. P. 589-603.
5. Chou CP. Engineering cell physiology to enhance recombinant protein production in Escherichia coli.
Appl Microbiol Biotechnol 2007;76(3):521-32.
6. Wang Z, Xiang L, Shao J, Wegrzyn A, Wegrzyn G. Effects of the presence of ColE1 plasmid DNA in Escherichia coli on the host cell metabolism.
Microb Cell Fact 2006;5:34.
7. Grabherr R, Nilsson E, Striedner G, Bayer K. Stabilizing plasmid copy number to improve recombinant protein production. Biotechnol Bioeng
2002;77(2):142-7.
8. Yoon SH, Han MJ, Lee SY, Jeong KJ, Yoo JS. Combined transcriptome and proteome analysis of Escherichia coli during high cell density culture.
Biotechnol Bioeng 2003;81(7):753-67.
9. Doonan S. Protein Purification Protocols. In: Yip TT, Hutchens TW, editors. Methods in Molecular Biology. Totowa, NJ: Humana Press Inc;1996. P. 57-75.
10. Rathore AS, Bilbrey RE, Steinmeyer DE. Optimization of an osmotic shock procedure for isolation of a protein product expressed in E. coli.
Biotechnol Prog 2003;19(5):1541-6.
11. Broedel SE, Papciak, SM, Jones WR. The selection of optimum media formulations for improved expression of recombinant proteins in E. coli. Tech Bull 2001;2:1-7.
12. De Anda R, Lara AR, Hernandez V, Hernandez-Montalvo V, Gosset G, Bolivar F, et al. Replacement of the glucose phosphotransferase transport system by galactose permease reduces acetate accumulation and improves process performance of Escherichia coli for recombinant protein production without impairment of growth rate. Metab Eng 2006;8(3):281-90.
13. Vemuri GN, Eiteman MA, Altman E. Increased recombinant protein production in Escherichia coli strains with overexpressed water-forming NADH oxidase and a deleted ArcA regulatory protein.
Biotechnol Bioeng 2006;94(3):538-42.
14. Picon A, Teixeira De Mattos MJ, Postma PW. Reducing the glucose uptake rate in Escherichia coli affects growth rate but not protein production.
Biotechnol Bioeng 2005;90(2):191-200.
15. Gosset G. Improvement of Escherichia coli production strains by modification of the phosphoenolpyruvate:sugar phosphotransferase system. Microb Cell Fact 2005;4(1):14.
ROS in periplasmic IL-2 expressing E. coli
Escherichia coli. Protein Expr Purif
2004;36(1):150-6.
17. De Marco A, Vigh L, Diamant S, Goloubinoff P. Native folding of aggregation-prone recombinant proteins in Escherichia coli by osmolytes, plasmid- or benzyl alcohol-overexpressed molecular
chaperones. Cell Stress Chaperones
2005;10(4):329-39.
18. Lethanh H, Neubauer P, Hoffmann F. The small heat-shock proteins IbpA and IbpB reduce the stress load of recombinant Escherichia coli and delay degradation of inclusion bodies. Microb Cell Fact
2005;4(1):6.
19. Cabiscol E, Tamarit J, Ros J. Oxidative stress in bacteria and protein damage by reactive oxygen species. Int Microbiol 2000;3(1):3-8.
20. Lushchak VI. Adaptive response to oxidative stress: Bacteria, fungi, plants and animals. Comp Biochem
Physiol C Toxicol Pharmacol 2011;153(2):175-90.
21. Dong C, Li G, Li Z, Zhu H, Zhou M, Hu Z. Molecular cloning and expression analysis of an Mn-SOD gene from Nelumbo nucifera. Appl
Biochem Biotechnol 2009;158(3):605-14.
22. Dong C, Zheng X, Li G, Zhu H, Zhou M, Hu Z. Molecular cloning and expression of two cytosolic copper-zinc superoxide dismutases genes from Nelumbo nucifera. Appl Biochem Biotechnol
2011;163(5):679-91.
23. Khaket TP, Ahmad R. Biochemical studies on hemoglobin modified with reactive oxygen species
(ROS). Appl Biochem Biotechnol
2011;164(8):1422-30.
24. Wiseman H, Halliwell B. Damage to DNA by reactive oxygen and nitrogen species: role in inflammatory disease and progression to cancer.
Biochem J 1996;313 ( Pt 1):17-29.
25. Stadtman ER. Metal ion-catalyzed oxidation of proteins: biochemical mechanism and biological consequences. Free Radic Biol Med 1990;9(4):315-25.
26. Boonstra J, Post JA. Molecular events associated with reactive oxygen species and cell cycle progression in mammalian cells. Gene 2004;337:1-13.
27. Giannattasio S, Guaragnella N, Corte-Real M, Passarella S, Marra E. Acid stress adaptation protects Saccharomyces cerevisiae from acetic acid-induced programmed cell death. Gene 2005;354:93-8.
28. Hondorp ER, Matthews RG. Oxidative stress inactivates cobalamin-independent methionine synthase (MetE) in Escherichia coli. PLoS Biol
2004;2(11):e336.
29. Leichert LI, Jakob U. Protein thiol modifications visualized in vivo. PLoS Biol 2004;2(11):e333. 30. Gonzalez-Flecha B, Demple B. Metabolic sources
of hydrogen peroxide in aerobically growing Escherichia coli. J Biol Chem 1995;270(23):13681-7.
31. Gonzalez-Flecha B, Demple B. Homeostatic regulation of intracellular hydrogen peroxide concentration in aerobically growing Escherichia coli. J Bacteriol 1997;179(2):382-8.
32. Von Ossowski I, Mulvey MR, Leco PA, Borys A, Loewen PC. Nucleotide sequence of Escherichia coli katE, which encodes catalase HPII. J Bacteriol
1991;173(2):514-20.
33. Loewen PC, Switala J, Triggs-Raine BL. Catalases HPI and HPII in Escherichia coli are induced
independently. Arch Biochem Biophys
1985;243(1):144-9.
34. Cornelis P. Expressing genes in different Escherichia coli compartments. Curr Opin Biotechnol 2000;11(5):450-4.
35. Baneyx F. Recombinant protein expression in Escherichia coli. Curr Opin Biotechnol
1999;10(5):411-21.
36. Messens J, Collet JF. Pathways of disulfide bond formation in Escherichia coli. Int J Biochem Cell Biol 2006;38(7):1050-62.
37. Gottesman S. Proteases and their targets in
Escherichia coli. Annu Rev Genet 1996;30:465-506. 38. Anderluh G, Gokce I, Lakey JH. Expression of proteins using the third domain of the Escherichia coli periplasmic-protein TolA as a fusion partner.
Protein Expres Purif 2003;28(1):173-81.
39. Benov LT, Fridovich I. Escherichia coli expresses a copper- and zinc-containing superoxide dismutase.
J Biol Chem 1994;269(41):25310-4.
40. Hadji I, Marzouki MN, Ferraro D, Fasano E, Majdoub H, Pani G, et al. Purification and characterization of a Cu,Zn-SOD from garlic (Allium sativum L.). Antioxidant effect on tumoral
cell lines. Appl Biochem Biotechnol
2007;143(2):129-41.
41. Nystrom T. Starvation, cessation of growth and
bacterial aging. Curr Opin Microbiol
1999;2(2):214-9.
42. Phue JN, Shiloach J. Impact of dissolved oxygen concentration on acetate accumulation and physiology of E. coli BL21, evaluating transcription levels of key genes at different dissolved oxygen conditions. Metab Eng 2005;7(5-6):353-63.
43. Storz G, Imlay JA. Oxidative stress. Curr Opin Microbiol 1999;2(2):188-94.
44. Hejazi MS, Karimi F, Mehdizadeh Aghdam E, Barzegari A, Farshdosti Hagh M, Parvizi M, et al. Cytoplasmic expression of recombinant interleukin-2 and interleukin-4 proteins results in hydrogen peroxide accumulation and reduction in catalase activity in Escherichia coli. DARU 2009;17(2):64-71.
Mahmoudi Azar et al.
46. Velikova V, Yordanov I, Edreva A. Oxidative stress and some antioxidant systems in acid raintreated bean plants- Protective role of exogenous polyamines. Plant Sci 2000;151(1):59-66.
47. Bradford MM. A rapid and sensitive method for the quantitation of microgram quantities of protein utilizing the principle of protein-dye binding. Anal
Biochem 1976;72:248-54.
48. Boor KJ. Bacterial stress responses: what doesn't kill them can make then stronger. PLoS Biol
2006;4(1):e23.
49. Lee HJ, Gu MB. Construction of a sodA::luxCDABE fusion Escherichia coli: comparison with a katG fusion strain through their responses to oxidative stresses. Appl Microbiol Biotechnol 2003;60(5):577-80.
50. Georgiou G, Segatori L. Preparative expression of secreted proteins in bacteria: status report and future
prospects. Curr Opin Biotechnol 2005;16(5):538-45.
51. Paradies G, Petrosillo G, Pistolese M, Ruggiero FM. Reactive oxygen species affect mitochondrial electron transport complex I activity through
oxidative cardiolipin damage. Gene
2002;286(1):135-41.
52. Lushchak VI. Oxidative stress and mechanisms of protection against it in bacteria. Biochemistry
(Mosc) 2001;66(5):476-89.
53. Hans PS, Kim Kusk M. Advanced genetic strategies for expression recombinant potein in
Escherichia coli. J Biotechnol 2004;14:113-28 54. Makrides SC. Strategies for achieving high-level
expression of genes in Escherichia coli. Microbiol Rev 1996;60(3):512-38.
55. Studier FW, Moffatt BA. Use of bacteriophage T7 RNA polymerase to direct selective high-level expression of cloned genes. J Mol Biol